Data Science with Python Certification Course
- 132k Enrolled Learners
- Weekend
- Live Class
(49300)


 Copy Link!
Around 70% of the earth’s surface is covered with water. But why am I telling you this? Well, the amount of data being generated is no less than the amount of water we have. The only difference between the two is, we’re running out of water and on the other hand data is flooding out of dozens of connected devices we use every day, and it shows no signs of slowing down. By the end of this R for Data Science blog, you will be able to understand the importance of Data Science and its implementation using the R language.
In this R for Data Science blog, I’ll be covering the following topics:
According to a recent survey, 90% of all data today was created in the last two years, that’s 2.5 quintillion bytes of data per day! It’s hard to imagine data in that volume. Wrapping your mind around processing, analyzing and managing this much data is only going to cause a migraine.

R for Data Science
Since technology took over the world, everything runs on data! Our mobile phones, cars, microwave ovens, air conditioners, etc, are all connected to the internet and they’re continuously generating data. Even we humans run on data! We pick up information, analyze it and make important decisions. This is exactly what data science is.
Data science is the process of extracting useful insights from data, to make better decisions.
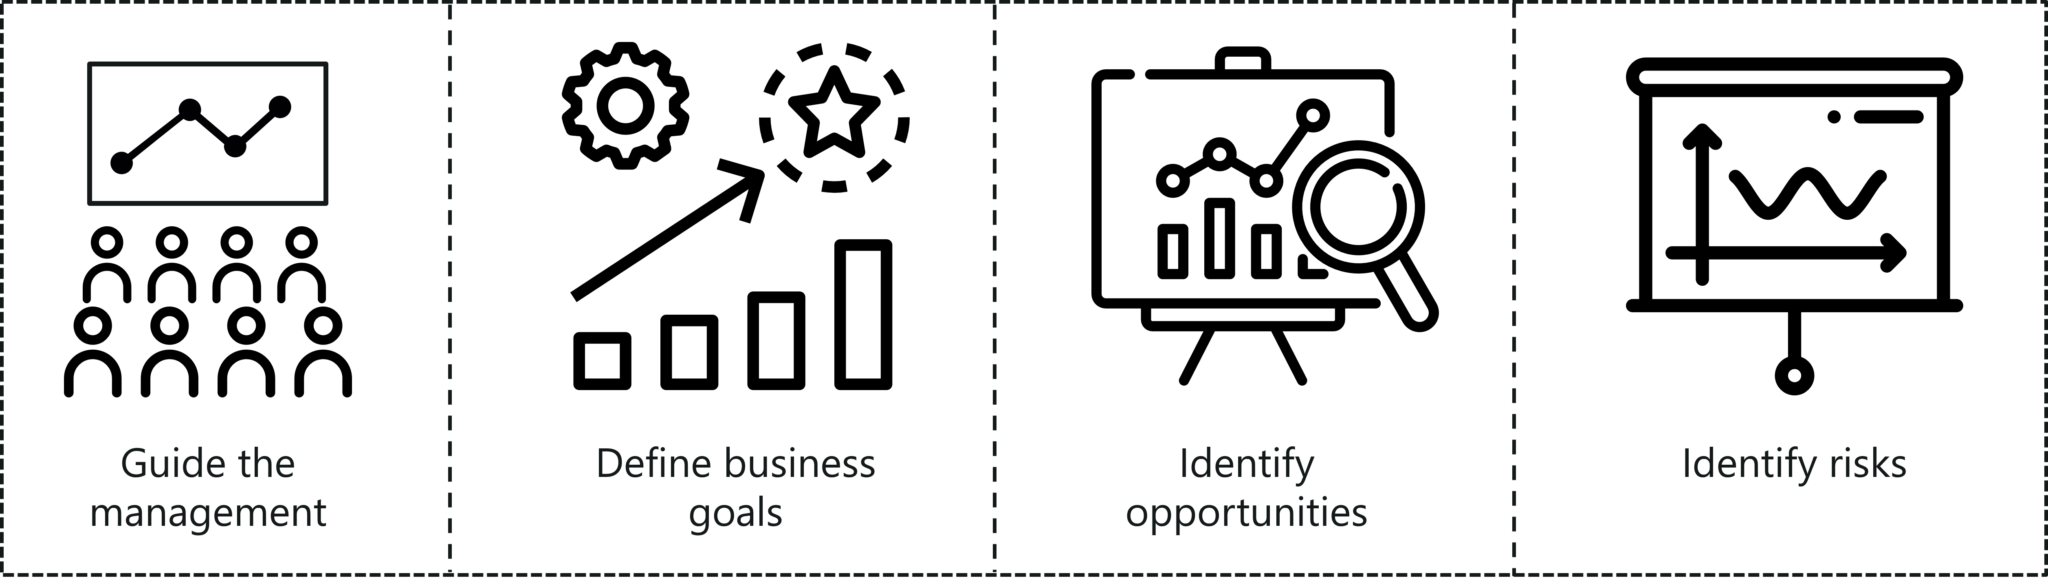
Companies use data to add value to their everyday business. The fundamental goal of data science is to help companies make quicker and better decisions, which can take them to the top of their market. This makes Data Science one of the most promising career opportunities.
Check out this blog to learn more about Data Science Career Opportunities.
R for Data Science
Following are 4 ways in which data science can help grow a business:
There are many more plus points of implementing Data Science in your business and if you want to grow your business, you must consider enrolling for a Data Science Training.
Here’s a blog specifically dedicated to the Advantages of Data Science Training.
Now let’s understand the importance of data science with a real-world use case.
Walmart is the world’s biggest retailer with over 20,000 stores in 28 countries. It is currently building the world’ biggest private cloud, to process 2.5 petabytes of data every hour. The reason behind Walmart’s success is how they use customer data to get useful insights about customers shopping patterns.
The data analysts and data scientists at Walmart know every detail about their customers. They know that if a customer buys item A, they might also buy item B.
How do they know all of this? Well, they use the data they get from all their customers and analyze it to see what a particular customer is looking for.
Let’s consider the Halloween and cookie sales example.
 Walmart use case – R for Data Science
During Halloween, sales analysts at Walmart analyzed the data in real-time and found that though a specific cookie was popular across all Walmart stores, there were 2 stores where it was not selling at all.
The situation was immediately examined, and it was found that a simple stocking oversight caused the cookies not being put on the shelves for sales. This issue was rectified immediately which prevented further loss of sales.
Walmart use case – R for Data Science
Another such example is that through association rule mining, Walmart found out that Strawberry pop-tarts sales increased by 7 times before a Hurricane.
A data analyst at Walmart identified this association between Hurricane and Strawberry pop-tarts through data mining and they placed all the Strawberry pop-tarts at the checkouts before a hurricane.
 Walmart use case – R for Data Science
Not only that, Walmart is leveraging social media data to find about the trending products so that they can be introduced to the Walmart stores across the world.
For instance, Walmart analyzed social media data to find out the users were crazy about “Cake Pops”. Walmart responded to this data analysis quickly and Cake Pops hit the Walmart stores. Walmart has huge amounts of data at its fingertips and the resources to go on to collect far more.
By combining this with the ability to make very fast decisions and implement changes based on incoming, real-time data, it is clear Walmart sees data as key to keeping itself at the top.
Just like how Walmart uses data science to grow their business, there are several other applications of data science that make it such an important field in today’s world.
Here’s a blog on the Top 10 Data Science Applications, that will give you a better understanding of the impact that data science has on various fields.
Alright now that you know how powerful data can be if you analyze it properly with effective algorithms and tools, let’s discuss what data science exactly is and the various stages of a data life cycle.
According to Wikipedia, Data science is an interdisciplinary field that uses scientific methods, processes, algorithms and systems to extract knowledge and insights from data in various forms, both structured and unstructured. If you want to learn more about Data Science, check out this video by our Data Science experts.
This video will help you understand the various aspects of Data Science.
Despite the recent increase in computing power and access to data over the last couple of years, our ability to use the data within the decision-making process is lost. When an organization is facing an issue, they should be able to apply the data correctly to solve the problem. That’s how data science works.
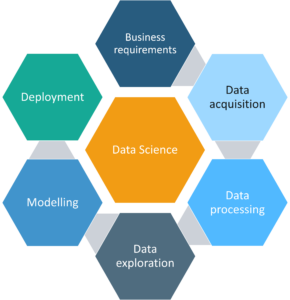
Now let’s understand the data science life cycle. There are 6 steps in this cycle:
R for Data Science
Before you can even start on a data science project, it is critical that you understand the problem you are trying to solve. In this stage, you should also be identifying the central objectives of your project by identifying the variables that need to be predicted.
Now that you’ve defined the objectives of your project, it’s time to start gathering the data. Data mining is the process of gathering your data from different sources. At this stage, some of the questions worth considering are – what data do I need for my project? Where does it live? How can I obtain it? What is the most efficient way to store and access all of it?
Generally finding the right data takes both time and effort. If the data required is stored in a database, you’re in luck. But, if your data doesn’t exist in a database, you’ll need to scrape it.
This is where you transform your data into the desired format so that you can read the data. After importing all the data, we move on to the most time-consuming step of all – cleaning and preparing the data. According to interviews with data scientists, this process can often take 50 to 80 percent of their time.
Data cleaning refers to the process of removing irrelevant and inconsistent data. These inconsistencies have to be identified and fixed in this stage.
The data exploration stage is where you understand the patterns in your data and retrieve all the useful insights from the data. You discover the hidden patterns and start to form hypotheses about your data. You can implement various data visualization packages such as ggplot2 in R to get a more clear understanding of the data.
At this stage, you need to carry out model training. Model training involves splitting the data set into 2 sets, one for training and the other for testing. After which you must build the models by using the training dataset. These models make use of various machine learning algorithms such as K Nearest Neighbor, Support Vector Machine, Linear regression and so on.
The final step is to evaluate the efficiency of these models and check how accurately they can predict the outcome.
The aim of this stage is to deploy the models into production or production-like environment for final user acceptance. This is where you check if your model is suitable for production. The users must validate the performance of the models and if there are any issues with the model then they must be fixed in this stage.
Machine learning is the science of getting computers to act by feeding them data and letting them learn a few tricks on their own, without being explicitly programmed to do so. That sounds awfully a lot like a human child.
Let’s consider a small scenario to understand machine learning. 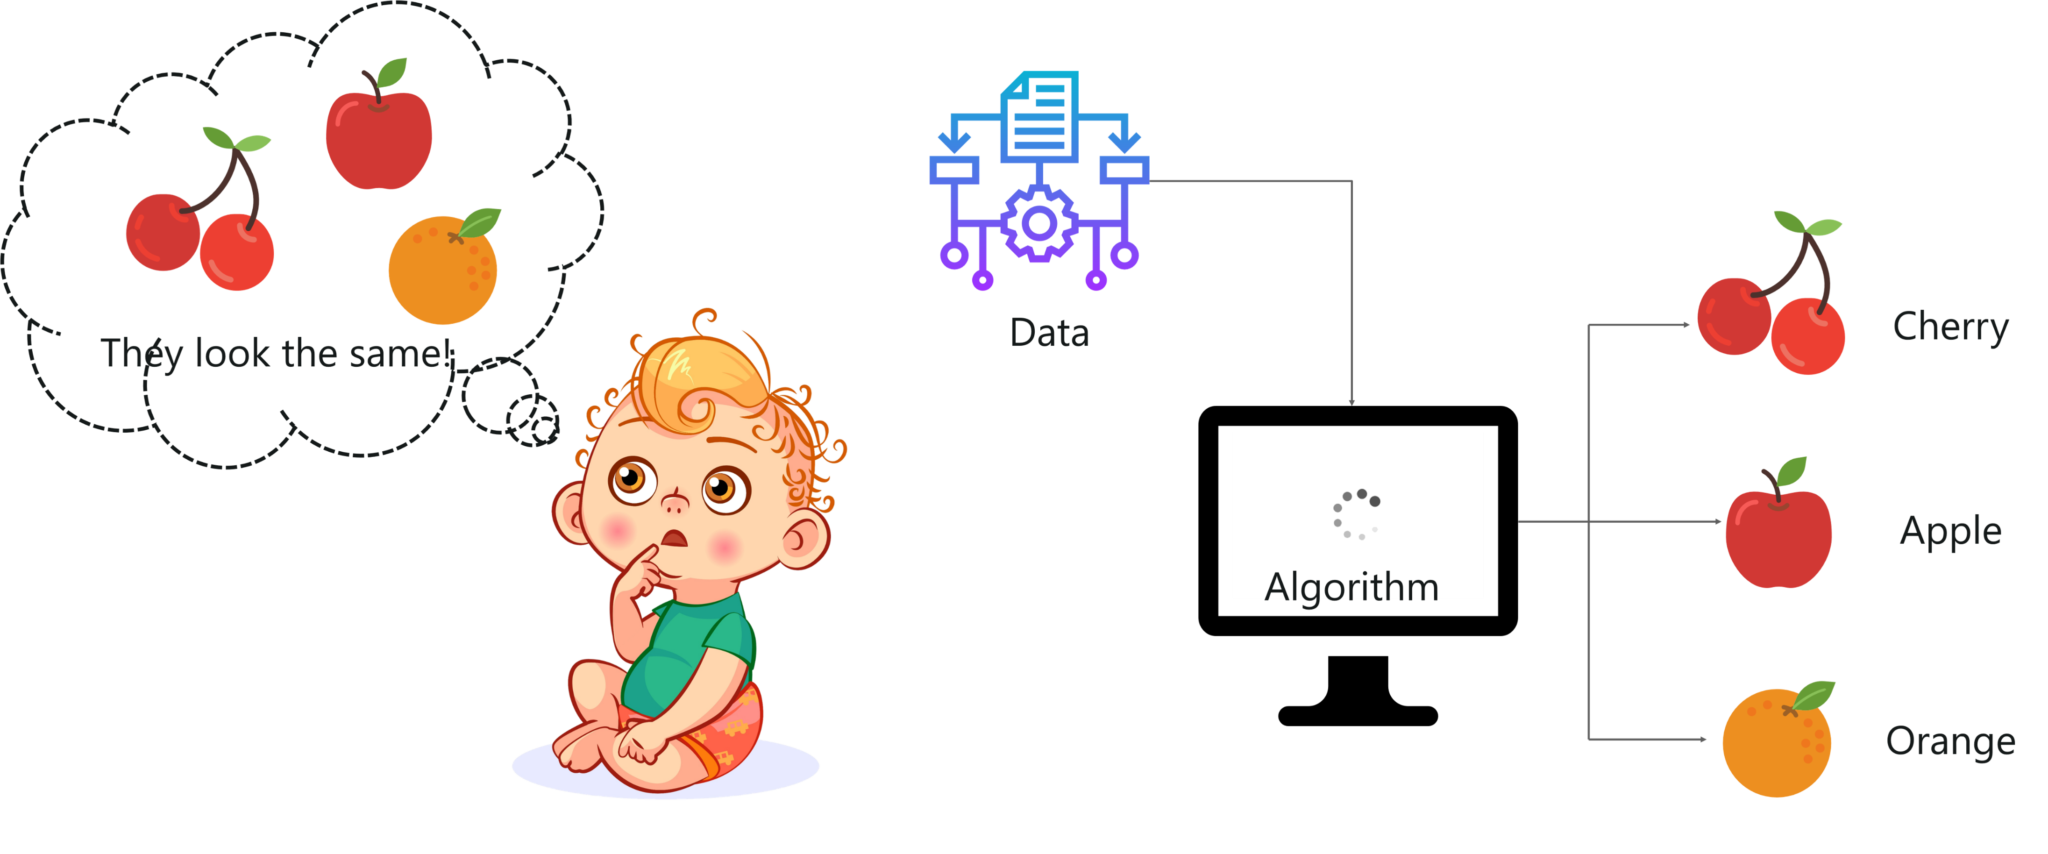
R For Data Science
If you’re interested in learning more about machine learning, check out this video.
This video gives an introduction to Machine Learning and its various types.
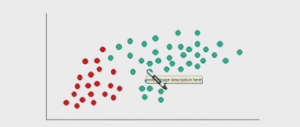
Now before we look at the different types of machine learning, let’s understand the process of machine learning. It all starts with an algorithm. Let’s say you want to input images of pets into your computer and you want your computer to classify them into 2 classes. One class containing images of cats and the other containing images of dogs. 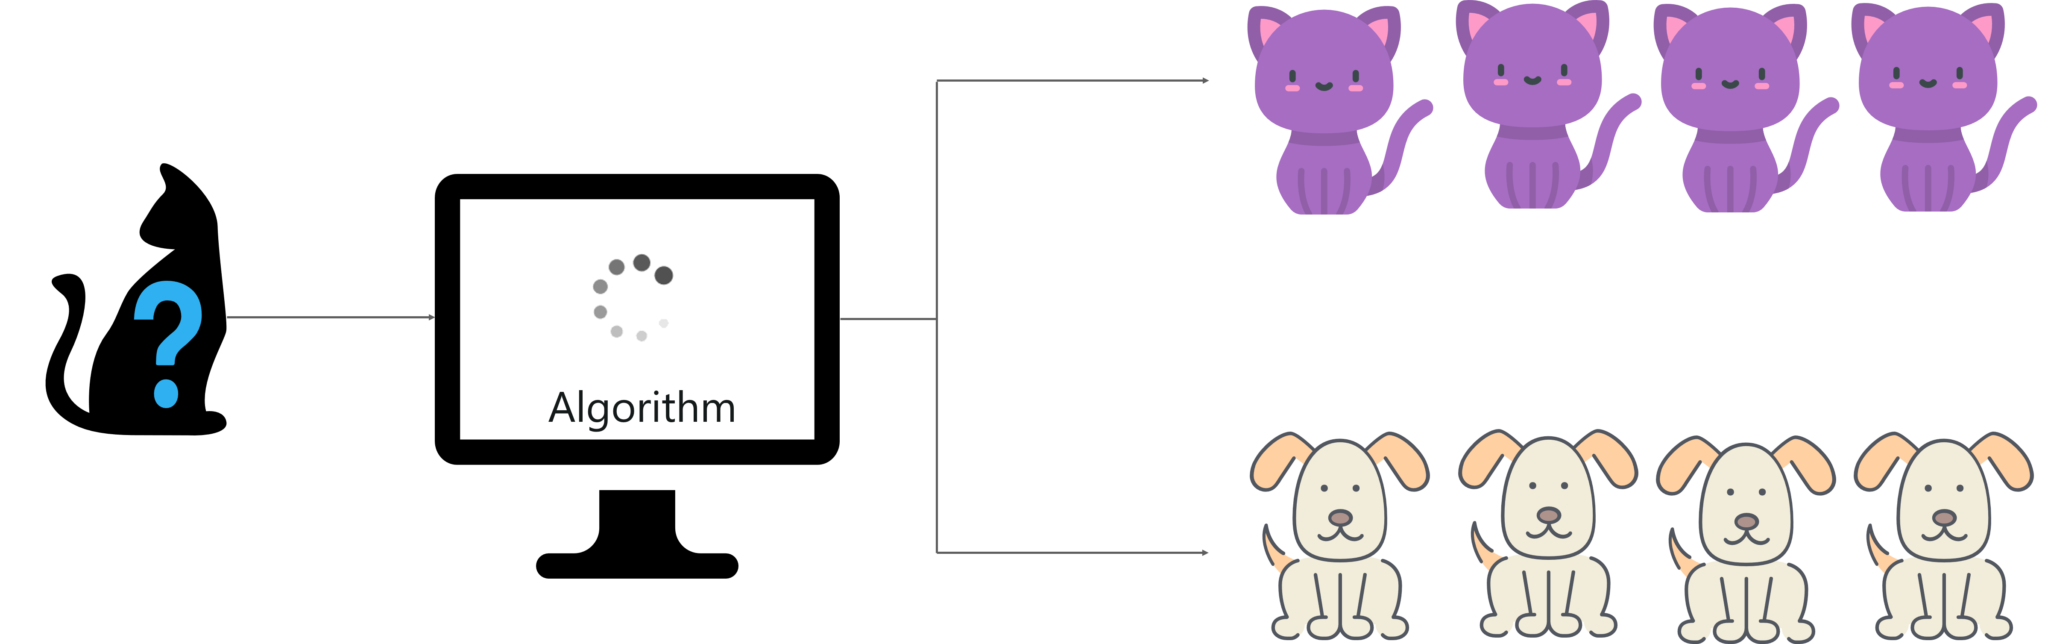
R For Data Science
Your first step would be to develop an algorithm or a logic that classifies the input images into two categories. Then, the algorithm is trained using a training data set to create a model. This model is then tested by using the testing data set to check if the algorithm can correctly distinguish between a cat and a dog.
If the algorithm can accurately classify the images into 2 categories, then the algorithm is deployed. Otherwise, the algorithm is further trained until it reaches a certain level of accuracy.
There are 3 different ways to train or teach a machine:
Supervised means to oversee or direct a certain activity and make sure it’s done correctly. In supervised learning, you feed the model a set of data called training data, which contains both input data and the corresponding expected output. The training data acts as a teacher and teaches the model the correct output for a particular input so that it can make accurate decisions when later presented with new data. 
R For Data Science
Once the machine is trained, you give it another set of data called Testing data. The testing data includes only input data, not the corresponding expected output. So, this time the model must predict the output based on what it had learned in the training phase.
Supervised learning is used on data that can be labeled. Like in the example about classifying a data set into either cats or dogs, the training data set is labeled. So, if the algorithm is fed an image of a cat, that image is labeled as a cat and similarly for a dog. This is how the model is taught, it is told that “this is a cat” by labeling it. After the algorithm is taught, it is then tested.
Unsupervised means to act without anyone’s supervision or direction. When a child grows into an adult, he no longer needs someone to guide him at every step. He observes and learns without any help. This is how unsupervised learning works.
 R for Data Science
In unsupervised learning, the model is given a data set which is neither labeled nor classified. The model explores the data and draws inferences from data sets to define hidden structures from unlabeled data. But it cannot add label clusters like it cannot say this a group of cats or dogs, but it will separate all the cats from dogs.
Reinforcement means to establish or encourage a pattern of behavior. What would happen if you were dropped off at an isolated island?
Initially, you’d panic and be unsure of what to do, where to get food from, how to live and so on. But after a while you will have to adapt, you must learn how to live on the island, adapt to the changing climates, learn what to eat and what not to eat.
You’re following the hit and trail concept because you’re new to this surrounding and the only way to learn, is experience and then learn from your experience.
 R for Data Science
This is what reinforcement learning is. It is a learning method wherein an agent (you, stuck on an island) interacts with its environment (island) by producing actions and discovers errors or rewards. And once it gets trained it gets ready to predict the new data presented to it.
Now that you have a good understanding of machine learning and data science, let’s look at how you can implement the data life cycle by using the statistical programming language called R.
A lot of people have this question in mind, What is Data Science in R?
I’ve also been asked, What does R stand for in R programming?
The answer is, R is basically an open source programming and statistical language used for data analysis, data manipulation and data visualization. It is a multi-purpose programming language popularly used in the field of Data Science.
Most of you know that the two main languages used for Data Science are Python and R. But which one should you choose?
 R has more statistical support R was built as a statistical language, and it shows. This is a good thing because statistics is a key part of Data Science. The state models package in Python provides decent coverage for statistical methods, but the R ecosystem is far larger.
 Data manipulation
With R, you can easily shape the dataset into a format that could be easily accessed and analyzed by slicing large multivariate datasets.

R has built-in functions for data analysis
In R we can use the summary built-in function to analyze summary statistics. Whereas in Python you need to import packages such as statsmodels to do this
8000+ packages
R has over 8000 packages that can be used to implement various statistical analysis tools related to hypothesis testing, model fitting, clustering techniques, and machine learning
 Data visualization
In order to understand a dataset and the relationship between various variables, it is important to visualize the data.
 Massive community support
R is the most sought-after technology because of its ingenuity and community support. Over 2.5 million users are using R. Companies such as TechCrunch, Google, Facebook, Mozilla, etc make use of R.
If you’re still confused, check out this blog, where we’ve discussed R and Python in depth. If you want to learn the R programming language, refer the below video.
This video will help you in understanding the fundamentals of the R tool and help you build a strong foundation in R.
Looking to accelerate your Data Science career? Explore Edureka’s MS + PGP Program in Data Science, which combines industry-focused training, hands-on projects, and globally recognized credentials to help you build job-ready Data Science and AI skills.
Earlier in this blog, we have discussed the data life cycle, it begins with data acquisition and ends with predicting the desired output. In this section, we’ll run a demo that will make you understand each of these data life cycle stages in depth. We always begin a data cycle by defining the problem statement.
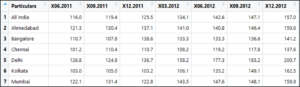
To study the House Price Index (HPI) variation in India. The HPI measures the price changes of residential housing as a percentage change from some specific start date. The HPI can be used to predict the price of a house at a later time.
We’re using HPI data set in this demo. The data set contains the HPI information about various cities in India for each quarter, between the years 2011 and 2013.
For this demo, we’ll be performing each and every step of the Data Life Cycle. We’ll start by data acquisition, followed by data cleaning and exploration, data manipulation and finally, we’ll end it with data visualization.
Now that you have a clear understanding of the logic behind this demo, let’s begin by importing the data. There are multiple ways to import data into the RStudio. Data can be imported through the web, through databases or using local files. My data set is stored in the /Users/zulaikha/Desktop/ path and I’m using the read.csv() method to read the data from the housing_index.csv file.
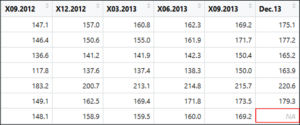
house <- read.csv('/Users/zulaikha/Desktop/housing_index.csv') The data set is read and stored in a variable called a house. You can now view the data set by using the View() method in R.
View(house)
 View the data set – R for Data Science
Next, lets clean the data set.
 house <- read.table(file = 'housing_index.csv', sep = ',', header = TRUE, na.strings = 'NA')
house <-na.omit(house)
The read.table() function has the following attributes:
In our case, there is a N/A value in the data set which gets removed because inconsistencies in the data set can cause trouble and we don’t want that.
 Omit N/A elements – R for Data Science
Once you have a clean data set, the next task is to look for the data types, for example, we expect housing indexes to have numerical datatypes but if that’s not true, we’ll have to do the conversion. This can be achieved by using class() function on our data set.
sapply(house, class)
The output shows that the variables are in numeric format, so we don’t have to convert them. But of your variables are not in the numeric format, then you can use the as.numeric() function to convert variables into numeric values from character datatype.
summary(house)
summary() function in R views the five-point summary of different variables within your data set. This is what our data looks like:
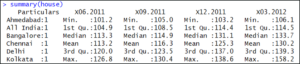 Summary of the data set – R for Data Science
Our next step is to manipulate the data, this includes creating new variables, transforming data, filtering only the required fields in the data set and so on.
Let’s try manipulating the data set. We’ll start by filtering out only the HPI from 2012 onward, the below command shows how this is done:
housing_2012 <- house[,c(1,5:11)]
To view the filtered data set, follow the below command:
housing_2012
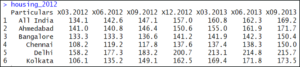 Data manipulation – R for Data Science
Now, let’s perform more data manipulation by transposing our data, this can be done by using t() function in R. Transpose means to convert rows to columns. The below lines of code will perform the transpose:
 col_names <-housing_2012$Particulars
row_names<-colnames(housing_2012)
housing_data_transpose <-as.data.frame(t(housing_2012[,1]),row.names= F)
colnames(housing_data_transpose) <- col_names
housing_data_transpose$quarter<-row_names[-1]
housing_data_transpose<-housing_data_transpose[,c(7,1:7)]
In our next step, let’s create a variable called hpi_150, which shows the records that have crossed 150 housing index in a quarter. Follow the below command to do this:
housing_data_transpose$hpi_150 <- apply(housing_data_transpose, MARGIN=1, FUN=function(x)length(which(x[c(-1,-2)]>150)))
Next, if we try to display the counts of the records that have an HPI over 150, we get this:
housing_data_transpose
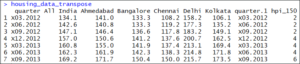
Transpose output – R for Data Science
Our final step is to visualize the data. When it comes to data visualization, R has several packages such as ggplot, ggvis and so on.
Let’s start by using a boxplot. A boxplot will give you an overview of the numerical data. This boxplot will show how the housing indexes vary across quarters.
boxplot(housing_2012[-1])
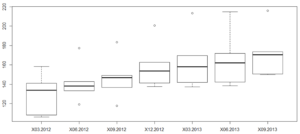 Boxplot – R for Data Science
Now, let’s plot a graph that shows how housing index prices proceeded over the quarters for all over India. This graph shows the values for various quarters.
plot(housing_data_transpose$`All India`)
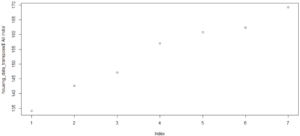 Linear plot – R for Data Science
Now let’s use the line format to view the same graph:
plot(housing_data_transpose$`All India`, type = 'l')
the type attribute is set to ‘L’, which indicates a line graph.
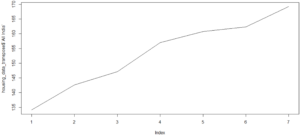
Line plot – R for Data Science
If we want to see the variation in the HPI for a particular state, we can do that too. For this let’s use the data visualization package provided by R, called ggplot2.
 require(ggplot2)

ggplot(housing_data_transpose, aes(quarter, Bangalore, fill = Bangalore)) +geom_bar(stat='identity', position='dodge')
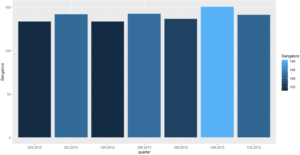
ggplot2 – R for Data Science
The above graph shows the prices of different quarters for Bangalore.
That was it for our demo. Give yourself a pat on the back because you just executed an entire data life cycle by using R.
With this, we come to the end of this R for Data Science blog. I hope you found this blog informative, if you have any doubts, leave a comment and we’ll get back to you at the earliest.
Stay tuned for more blogs on the trending technologies.
If you are looking for online structured training in Data Science, edureka! has a specially curated Data Science with Python Course which helps you gain expertise in Statistics, Data Wrangling, Exploratory Data Analysis, Machine Learning Algorithms like K-Means Clustering, Decision Trees, Random Forest, Naive Bayes. You’ll learn the concepts of Time Series, Text Mining and an introduction to Deep Learning as well. New batches for this course are starting soon!!


 Thank you for registering Join Edureka Meetup community for 100+ Free Webinars each month JOIN MEETUP GROUP