


Advanced Power BI Certification Course with G ...
- 13k Enrolled Learners
- Weekend/Weekday
- Live Class
(4230)


 Copy Link!
The first thing that comes to anyone’s mind about QlikView is that it is a BI (Business Intelligence) tool. This is absolutely true. But, QlikView can offer much more. Whatever it can offer extra is exactly what I’m going to talk about in this QlikView tutorial blog.
QlikView is a Self-Service Business Intelligence, Data Visualization and Data Analytics tool. You may ask what is Self-Service Business Intelligence? And rightly so, let me answer that question first as part of this QlikView tutorial.
Self-service business intelligence (SSBI) is an approach to data analytics, pursued by non-technical users who do not have a background in either statistical analysis or business intelligence or data mining.
This enables the end users to be self-dependent, thus freeing up the bandwidth of the organization’s BI and IT teams from creating the reports and dashboards for them. So are there other tools in the market which are comparable to QlikView? Let’s understand what in the next part of this QlikView tutorial blog.
You might be aware of Tableau, which is a direct competitor to QlikView. A lot of people are of the opinion that Tableau is better than QlikView. Which is not true. Because Tableau is just a data visualization and BI tool. However, QlikView is an end-to-end ETL solution cum Analytics engine cum BI and data visualization tool.
Tableau is however, more user-friendly because non-technical business users can get started straight-away. But QlikView needs a developer’s intervention to create reports or dashboards. Might I also mention that Tableau has a better looking UI compared to QlikView.
But one place where QlikView is a downright winner is Speed. Since QlikView stores the data in the Server RAM, it is very fast compared to Tableau. So that’s about it. Both these tools have their own advantages and short-comings.
So, through this QlikView tutorial blog, let’s go ahead and understand the benefits that make it stand out.
The data which you sent to QlikView is first of all, compressed to almost 10% of its original size and then stored in server RAM. Since it is stored in the server’s RAM, it is called In-Memory storage and this essentially results in even the processing and calculations being really fast.
The data which is stored in-memory can be immediately accessed by multiple users for data exploration. And for data sets, which are too large to fit in-memory, QlikView can directly connect to the data source.
Data Association is the ability to automatically recognize the relationship between various fields present in a dataset. An example of this is if two fields have the same name, it is easier to join them. Thus, the users need not pre-configure the relationships between different data entities.
This is a special feature which you will notice because this is not available in most other tools. Relationships in QlikView are visually appealing because they are represented by Colors, and not by arrows/ lines. Also, while searching for data, not only will the direct results be displayed, but even related searches for it will be returned. This is thanks to Data Association.
Now, those were a few noticeable features of QlikView. So, let me go further into how QlikView works by talking about QlikView’s architecture and components in this QlikView tutorial.
Below is the architecture diagram of QlikView. Take a look at it before understanding the explanation I have provided.
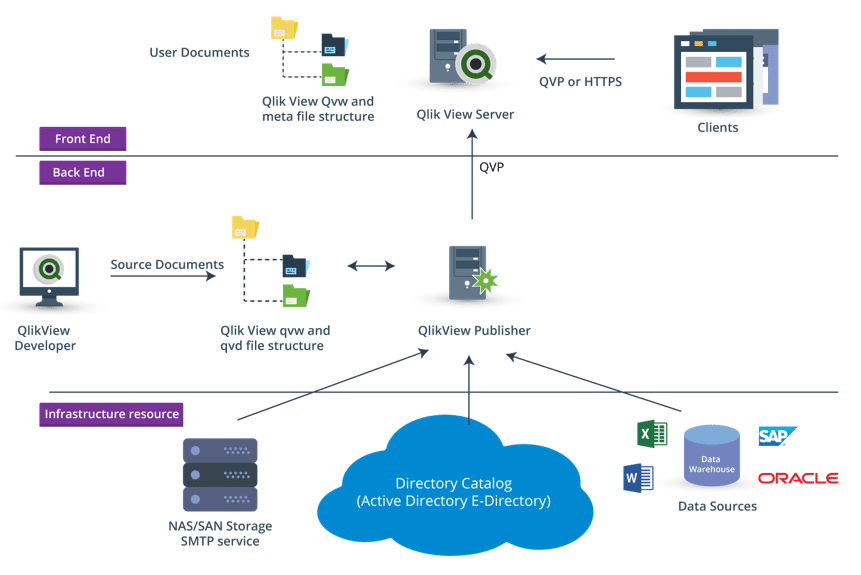
As you can see, there are 2 main categorizations:
Infrastructure Resource is the other one visible from the architecture, which comes under back-end.
As obvious from the name, this is the UI point for end users. The UI here is a browser-based access point, from where documents can be viewed. The documents I’m referring to are nothing but the already created BI reports hosted on the internet by the QlikView Server.
As an end-user, you can access these documents on the Web by going to the respective URL which is nothing but HTTPS communication. You can otherwise access it also via QVP, which is QlikView’s propriety communication protocol. You can then interact with that data by making analysis, deriving insights and then come to a conclusion.
What more can you do?
You can share these reports and documents with other users, work on it together and collaborate on the insights gained from the data in real-time. Even if not in real-time, it can be done offline.
These documents are in the .qvw format, and can also be stored in the Windows OS as a standalone document. Since all the action happens here in the QlikView server, it is responsible for the client-server communication between the user and the QlikView Back-End system.
The back-End consists of two components:-
QlikView Developer or often referred to as QlikView Desktop is a Windows-based desktop tool mostly used by developers or designers. This is where the source files reside. It is used for data extract, load and transformation and it can also be used to create a custom GUI layout of reports.
The custom GUI can be created via drag and drop functionality and the very same will be reflected in the front-end. The file types which are created using the Developer are again stored with .qvw extension. These are the same files which are passed onto the QlikView server in the Front-End.
The .qvw files can be modified to .qvd files, which are data-only files. Data-only files mean those files which contain only the data and neither the GUI components nor the reports.
QlikView Publisher is another back-end component which is used as a distribution service to distribute the .qvw documents to various QlikView servers and users. It also does data loading. It is also responsible for maintaining the user access and privileges. It also does direct loading of data from data sources by using the scripts defined in the .qvw files. The data sources can be Data Warehouse, Excel files, Salesforce, Oracle DB, various Databases, etc.
So this is where the fun part of this QlikView tutorial blog starts. I will show you how to add data to your QlikView desktop and based on that, I’ll show you how to create a basic dashboard and create visualizations. Note that I’m using QlikView 12 which is a desktop version. The below screenshot is how QlikView looks like.
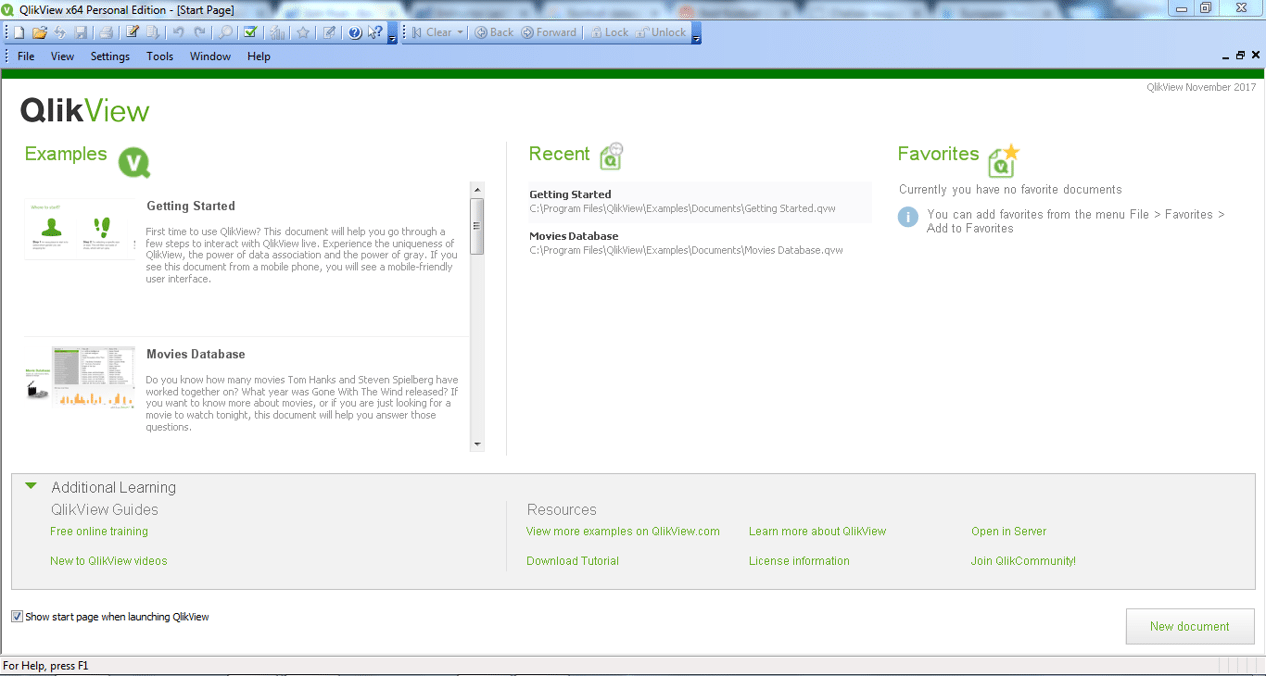
If you are using QlikView for the first time, then you would see something like what you see above. You can click on ‘Getting Started’, or ‘Movies Database’, or any other from the ‘Examples’ tab to access any default or in-built dashboards and reports.
However, we will be dealing with a dataset and for practice, you can download it from here. Okay, so what’s the first thing we have to do to get started? Load the data right?
To load the data to QlikView, click on File –> New. After doing so, the below window will popup.
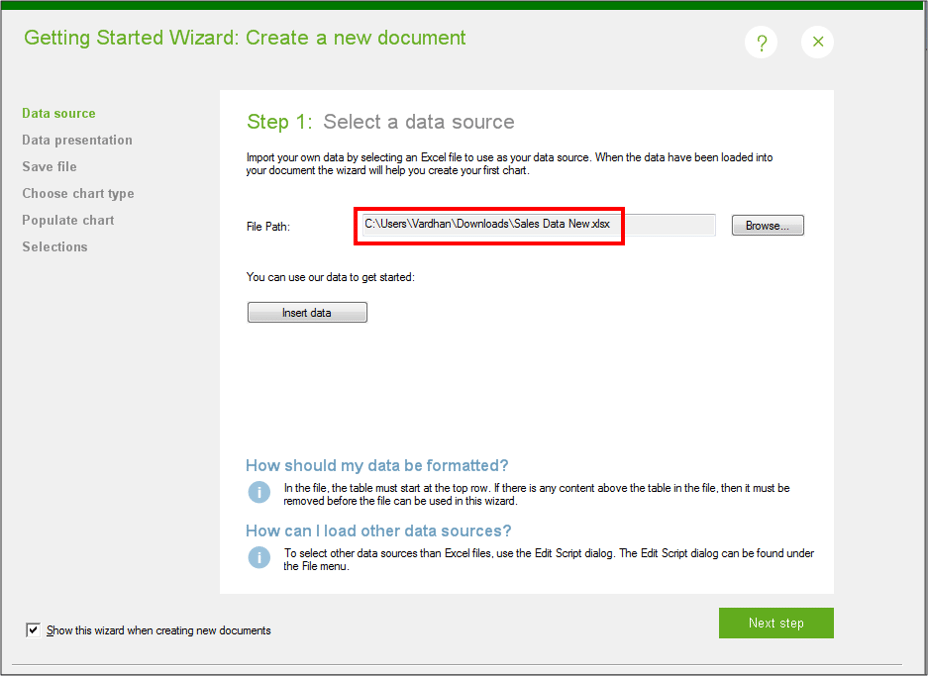
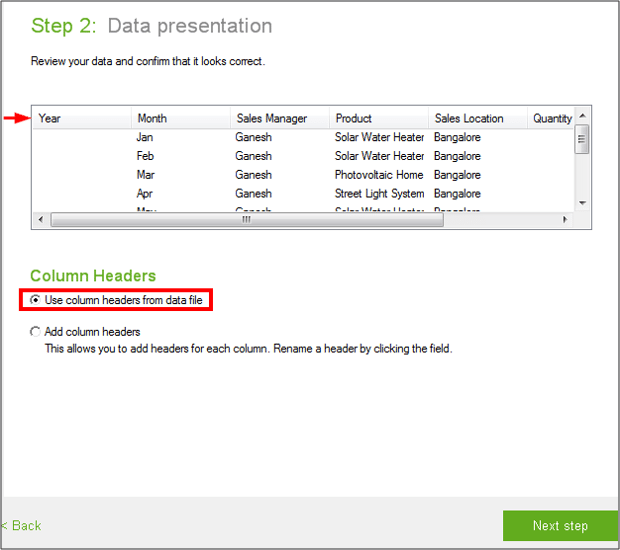
In the first step, enter the data source by feeding the path of the excel file and click on ‘Next step’. You will then get the below window which is the data presentation step. Make sure you have checked ‘Use column headers from data file’ and then click on ‘Next step’.
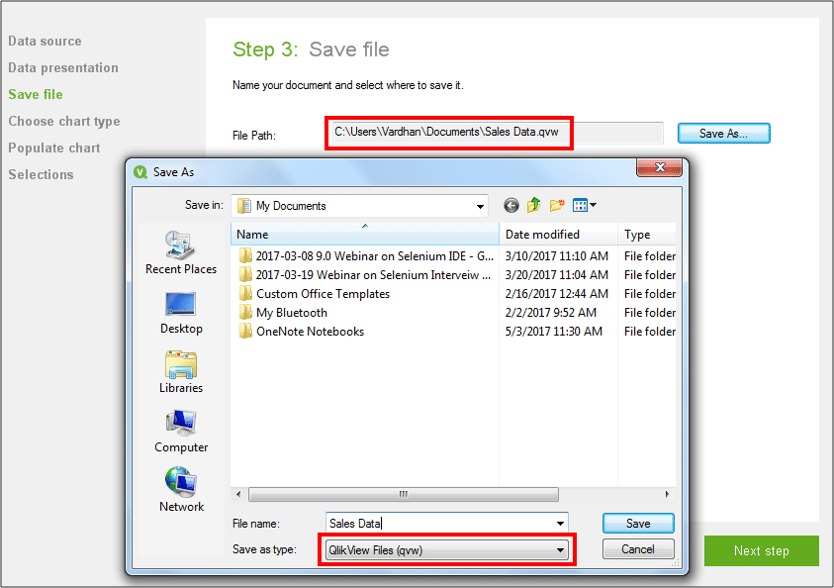
In the next step, you will have to save the QlikView workbook file. Enter a name of your choice and click on ‘Next step’. You should be able to see the ‘File Path’ similar to the below screenshot.
You will be prompted with another window for authenticating you with your machine and QlikView software. Click ‘Ok’ to proceed.
You will then be asked to choose a chart for visualizing your data. You can select ‘Bar chart’ and click on ‘Next step’.
Next is the most important step because here we have to populate the chart with some data. If you want to analyze and visualize the data, then you have to create a schema or define a relationship between the dimensions and measures. Because the analysis is always a measure of a particular dimension.
In our dataset, the various fields are Year, Month, Sales Manager, Product, Sales Location, Quantity and Sales. Let’s choose ‘Month’ to be dimension and ‘Sales’ as the measure. The same is depicted in the below screenshot.
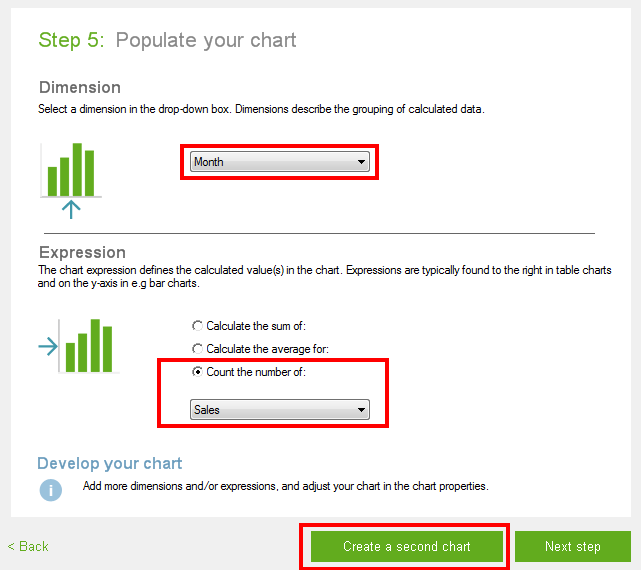
You can click on ‘Next step’ or ‘Create a second chart’. I have chosen the later for creating a new ‘Line chart’ whose dimension and measure will be ‘Sales Manager’ and ‘Quantity’ respectively. You can probably choose the same and go to the next step.
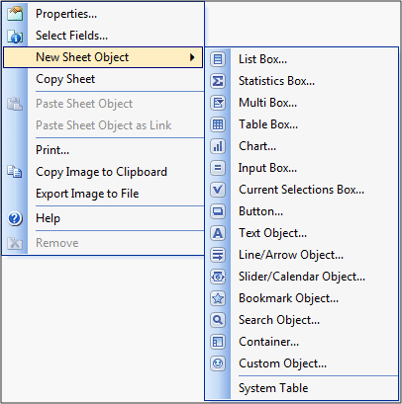
The last step is to add an object for making selections and visualizations on the fly. You can choose from Listboxes, Table Box, Statistics box and many more. I have initially chosen Listboxes. Take a look at the below screenshot for reference.
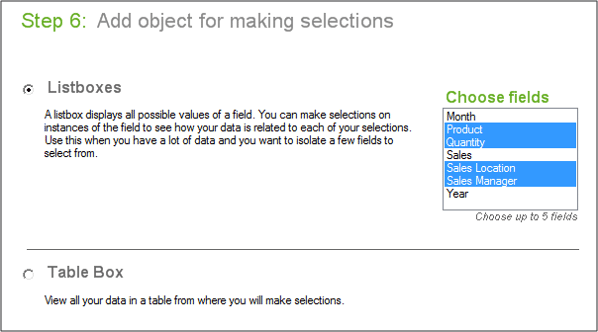
You can choose up to 5 fields initially. But later from the Application’s Canvas, you can add more fields. I have chosen Product, Quantity, Sales Location, Month, Sales Manager and Year.
Even though this is how it looks initially, you can move the charts and objects around as per your convenience within the Canvas. In fact, you can even align them however you want to. Either horizontally or vertically. The options to do so can be found by right-clicking on the Canvas.
To further add objects, you can again right click on the Canvas and select ‘New Sheet Object’. You can choose the box type or chart type from the list. Few of the box types are List Box, Statistics Box, Multi-Box, Table Box, Chart, Input Box, etc.
From here on, it is all about what you want to visualize. You can simply click on any of the graphs and you will be shown a different graph corresponding to the details of that list. You can also click on certain values from a list box and graphs will change according to the selection by displaying only related fields of those values.
And this is the reason why this tool got the name “QlikView“. You can interact with your data by simply clicking on some chart or object. So, what kind of visualization can we do?
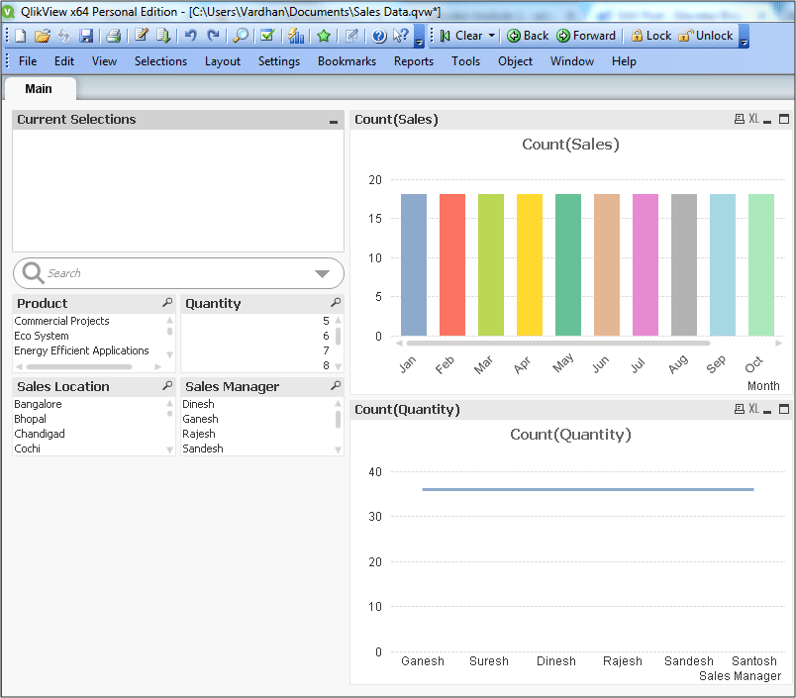
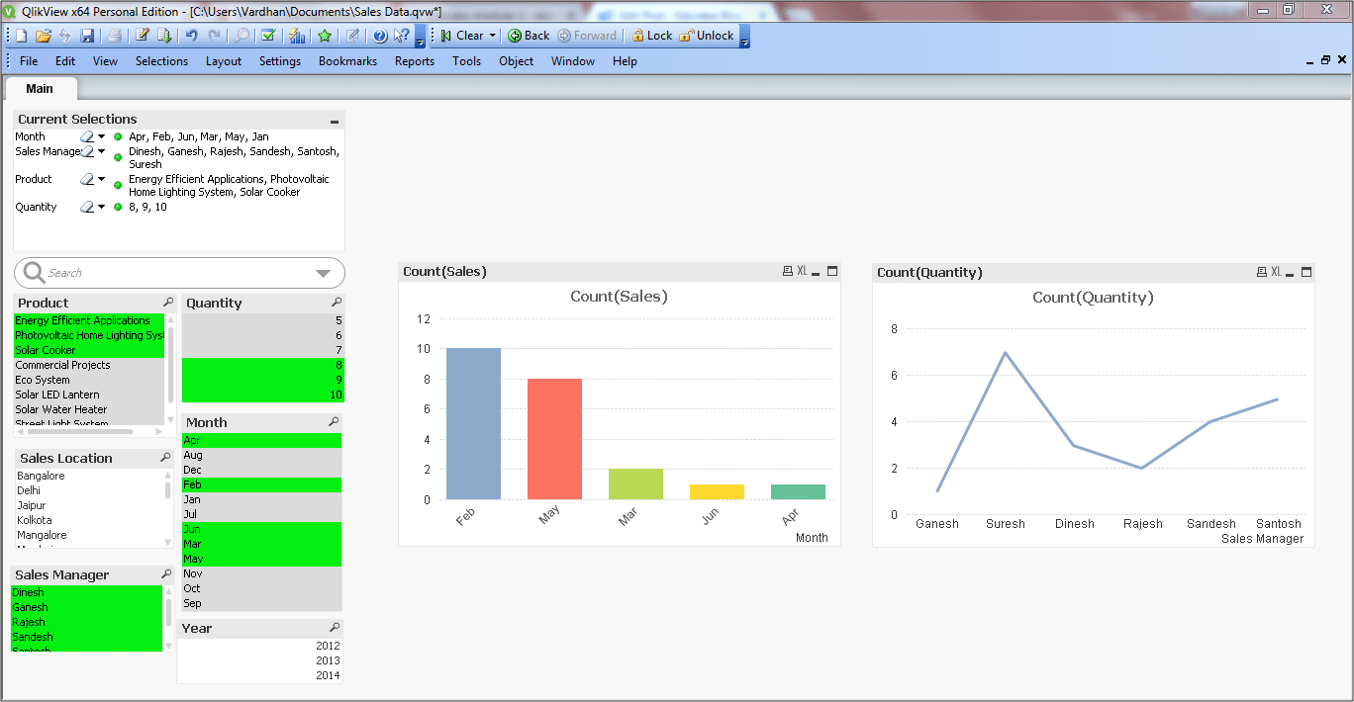
What I have visualized is, how the sales is during the first 6 months of all the years. How many have each of the Sales Managers contributed during this period time on select products: Energy Efficient Applications, Photovoltaic Home Lighting System and Solar Cooker.
The final visualization is below. You can bring about a similar visualization by clicking on values as highlighted on the left side of the screenshot. Also, the selections made to bring about that visualization is mentioned separately on the top.
So, that’s the end of this QlikView tutorial blog. I urge you to get to this point and then explore your dataset the way you want to. Explore the power of QlikView and be amazed.
If you are interested in learning more about QlikView, check out Edureka’s Qlikview Certification Training which comes with instructor-led live online training and 24*7 support to guide you throughout your learning period.
Got a question for us? Please mention it in the comments section and we will get back to you.


 Thank you for registering Join Edureka Meetup community for 100+ Free Webinars each month JOIN MEETUP GROUP