
Data Science with Python Certification Course
- 131k Enrolled Learners
- Weekend
- Live Class
(49300)


 Copy Link!
Anaconda is the data science platform for data scientists, IT professionals and business leaders of tomorrow. It is a distribution of Python, R, etc. With more than 300 packages for data science, it becomes one of the best platforms for any project. In this python anaconda tutorial, we will discuss how we can use anaconda for python programming. Following are the topics discussed in this blog:
Gain expertise in scripting in Python and prepare yourself to take up Python job opportunities with Edureka’s Python Certification Course Training, a trusted online learning company with a network of more than 250,000 satisfied learners spread across the globe.
Anaconda is an open-source distribution for python and R. It is used for data science, machine learning, deep learning, etc. With the availability of more than 300 libraries for data science, it becomes fairly optimal for any programmer to work on anaconda for data science.

Anaconda helps in simplified package management and deployment. Anaconda comes with a wide variety of tools to easily collect data from various sources using various machine learning and AI algorithms. It helps in getting an easily manageable environment setup which can deploy any project with the click of a single button.
Now that we know what anaconda is, let’s try to understand how we can install anaconda and set up an environment to work on our systems.
To install anaconda go to https://www.anaconda.com/download.
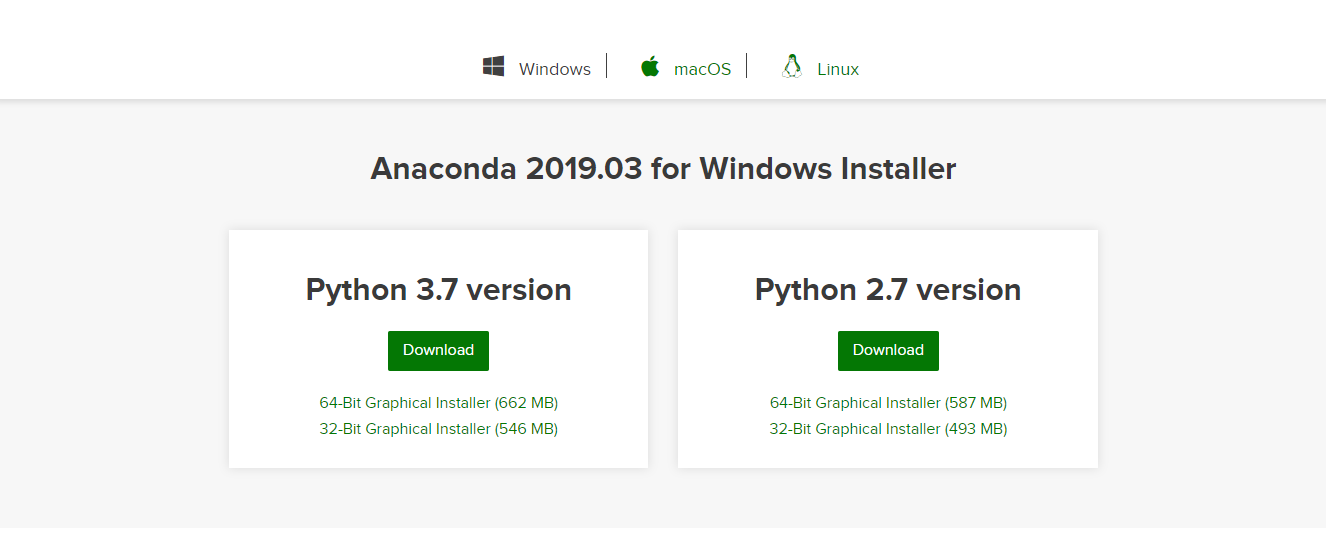
Choose a version suitable for you and click on download. Once you complete the download, open the setup.
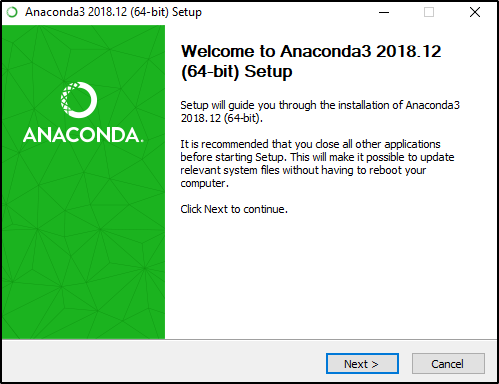
Follow the instructions in the setup. Don’t forget to click on add anaconda to my path environment variable. After the installation is complete, you will get a window like shown in the image below.

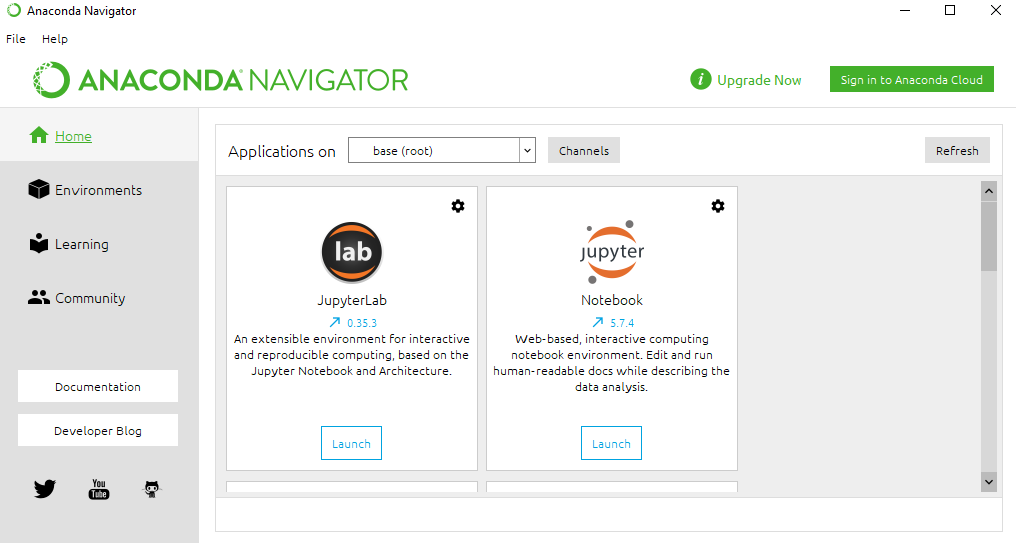
After finishing the installation, open anaconda prompt and type jupyter notebook.
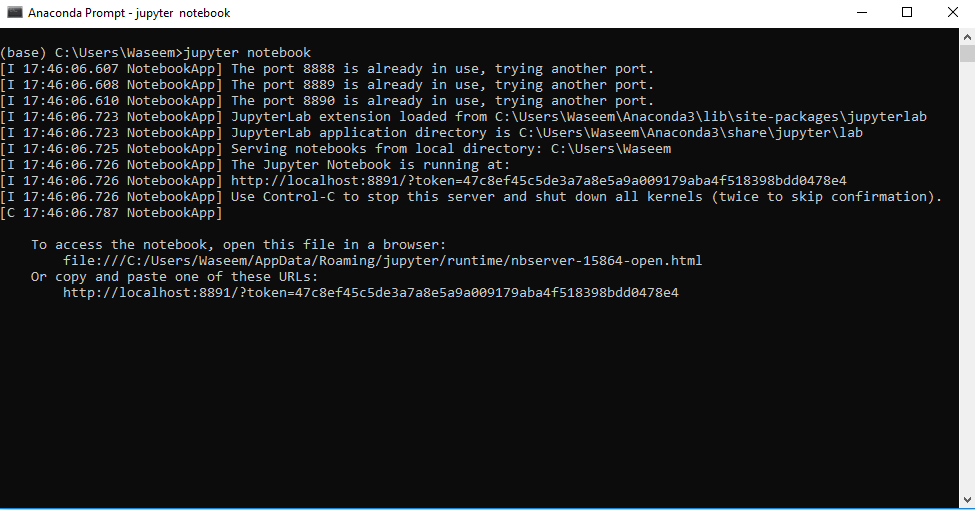
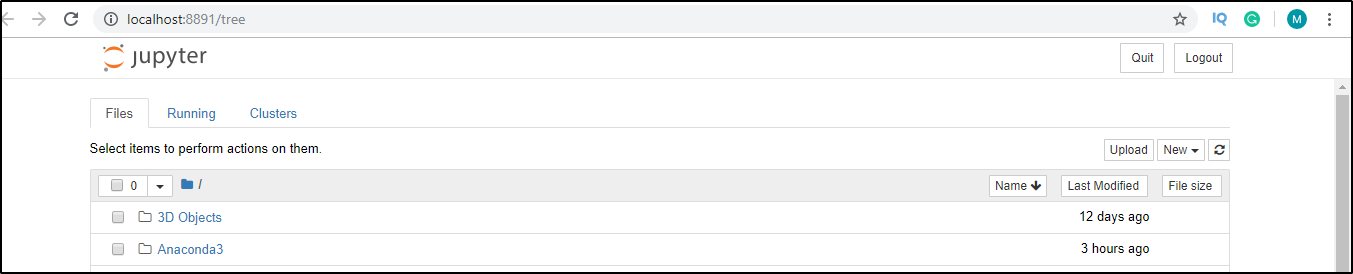
You will see a window like shown in the image below.
Now that we know how to use anaconda for python lets take a look at how we can install various libraries in anaconda for any project.
Open anaconda prompt and check if the library is already installed or not.
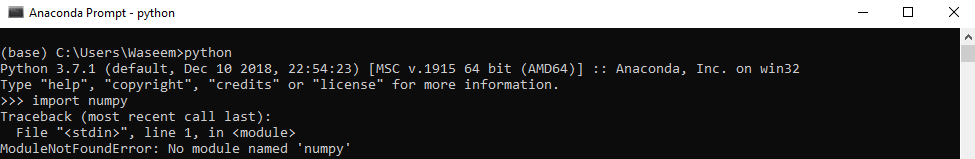
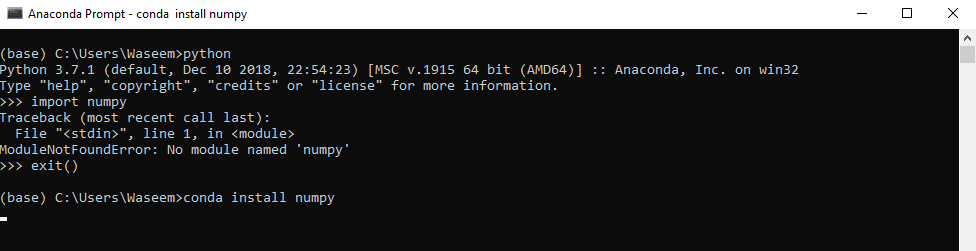
Since there is no module named numpy present, we will run the following command to install numpy.
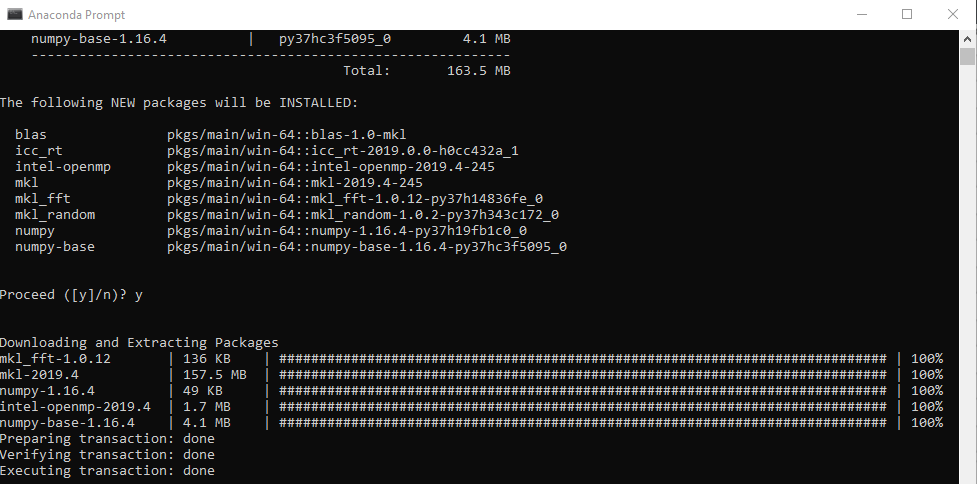
You will get the window shown in the image once you complete the installation.
Once you have installed a library, just try to import the module again for assurance.
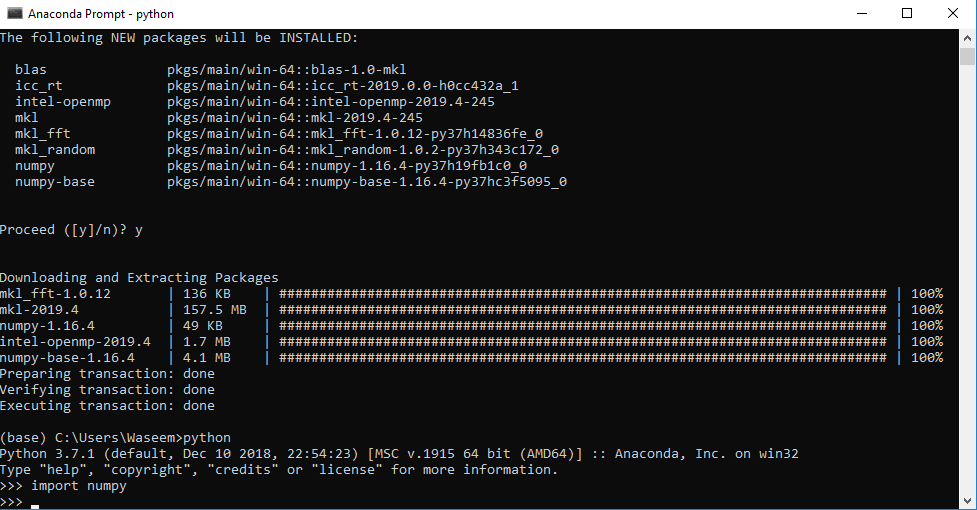
As you can see, there is no error that we got in the beginning, so this is how we can install various libraries in anaconda.
Anaconda Navigator is a desktop GUI that comes with the anaconda distribution. It allows us to launch applications and manage conda packages, environment and without using command-line commands.
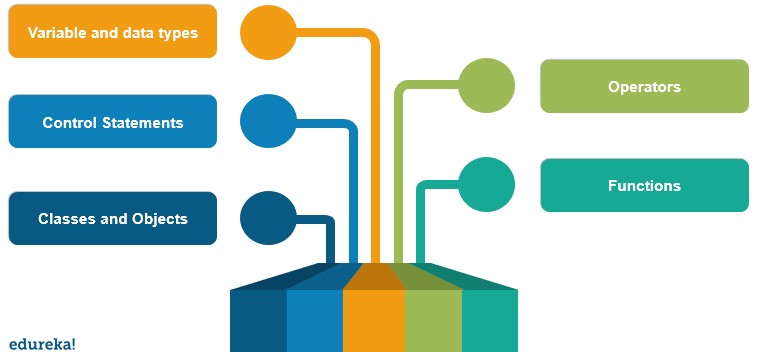
Variables and data types are the building blocks of any programming language. Python has 6 data types depending upon the properties they possess. List, dictionary, set, tuple, are the collection data types in the python programming language.
Following is an example to show how variables and data types are used in python.
#variable declaration
name = "Edureka"
f = 1991
print("python was founded in"  , f)
#data types
a = [1,2,3,4,5,6,7]
b = {1 : 'edureka' , 2: 'python'}
c = (1,2,3,4,5)
d = {1,2,3,4,5}
print("the list is" , a)
print("the dictionary is" , b)
print("the tuple is" , c)
print("the set is " , d)
Operators in Python are used for operations between values or variables. There are 7 types of operators in python.
Following is an example with the use of a few operators in python.
a = 10
b = 15
#arithmetic operator
print(a + b)
print(a - b)
print(a * b)
#assignment operator
a += 10
print(a)
#comparison operator
#a != 10
#b == a
#logical operator
a > b and a > 10
#this will return true if both the statements are true.
Statements like if, else, break, continue are used as a control statement to gain control over the execution for optimal results. We can use these statements in various loops in python for controlling the outcome. Following is an example to show how we can work with control and conditional statements.
name = 'edureka'
for i in name:
     if i == 'a':
         break
     else:
         print(i)
Python functions provide code reusability in an efficient way, where we can write the logic for a problem statement and run a few arguments to get the optimal solutions. Following is an example of how we can use functions in python.
def func(a):
      return a ** a
res = func(10)
print(res)
Since python supports object-oriented programming, we can work with classes and objects as well. Following is an example of how we can work with classes and objects in python.
class Parent:
      def func(self):
            print('this is parent')

class Child(Parent):
      def func1(self):
           print('this is child')

ob = new Child()
ob.func()
These are a few fundamental concepts in python to start with. Now talking about the larger package support in anaconda, we can work with a lot of libraries. Let’s take a look at how we can use python anaconda for data analytics.
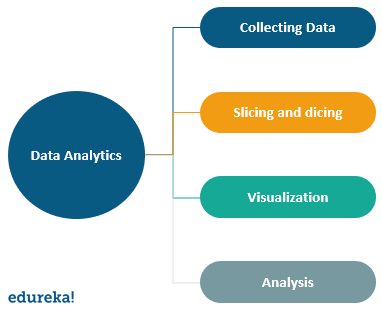
These are certain steps involved in data analysis. Let’s take a look at how data analysis works in anaconda and various libraries that we can use.
The collection of data is as simple as loading a CSV file in the program. Then we can make use of the relevant data to analyze particular instances or entries in the data. Following is the code to load the CSV data in the program.
import pandas as pd
import numpy as np
import matplotlib.pyplot as plt
import seaborn as sns
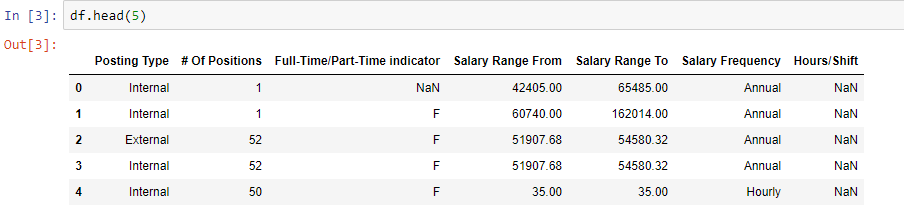
df = pd.read_csv('filename.csv')
print(df.head(5))
After we load the data set in the program, we must filter the data with a few changes like eliminating the null values and unnecessary fields that may cause ambiguity in the analysis.
Following is an example of how we can filter the data according to the requirements.
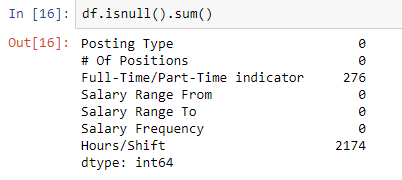
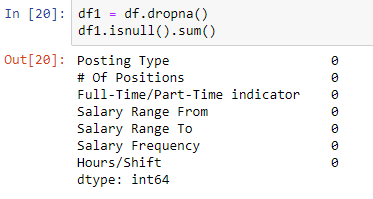
print(df.isnull().sum())
#this will give the sum of all the null values in the dataset.
df1 = df.dropna(axis=0 , how= 'any')
#this will drop rows with null values.
We can drop the null values as well.
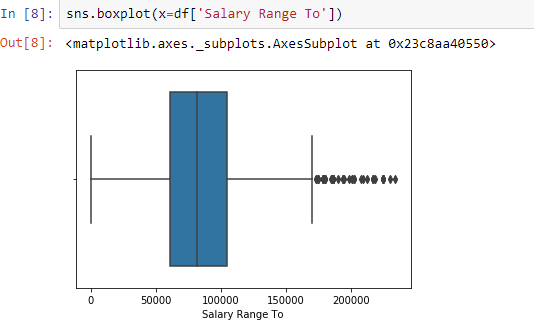
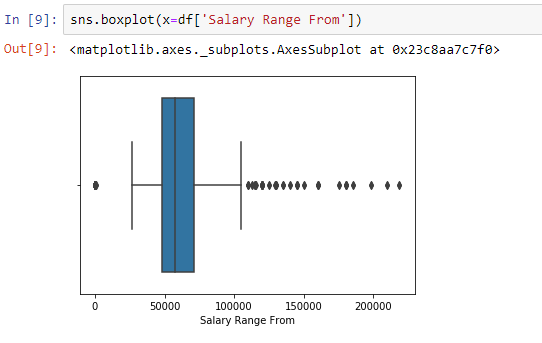
BoxPlot
sns.boxplot(x=df['Salary Range From'])
sns.boxplot(x=df['Salary Range To'])
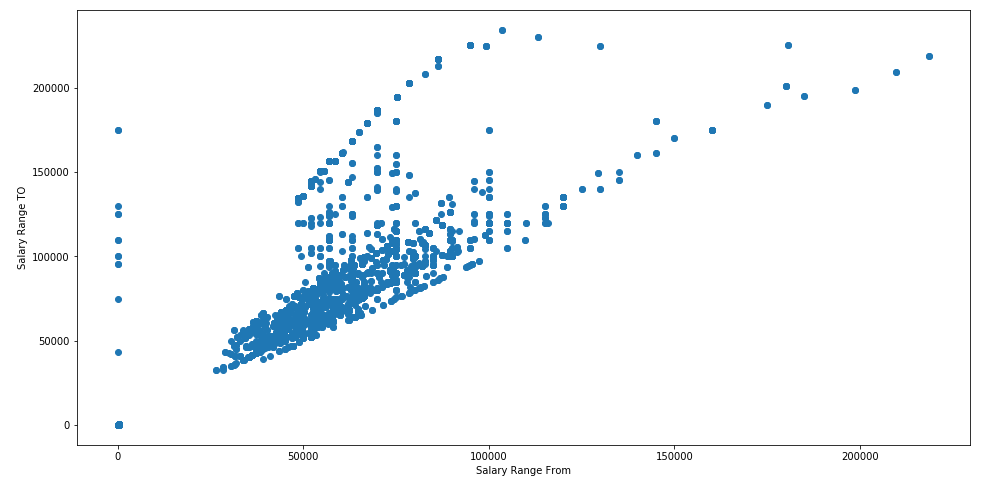
ScatterPlot
import matplotlib.pyplot as plt
fig, ax = plt.subplots(figsize=(16,8))
ax.scatter(df['Salary Range From'] , df['Salary Range To'])
ax.set_xlabel('Salary Range From')
ax.set_ylabel('Salary Range TO')
plt.show()
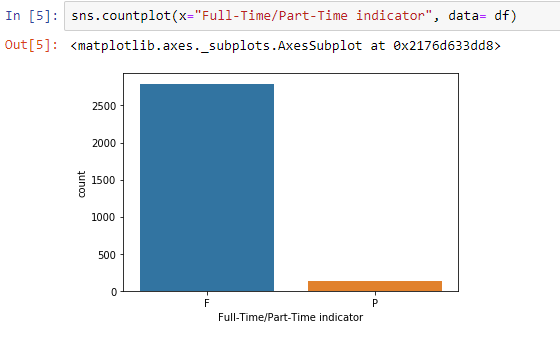
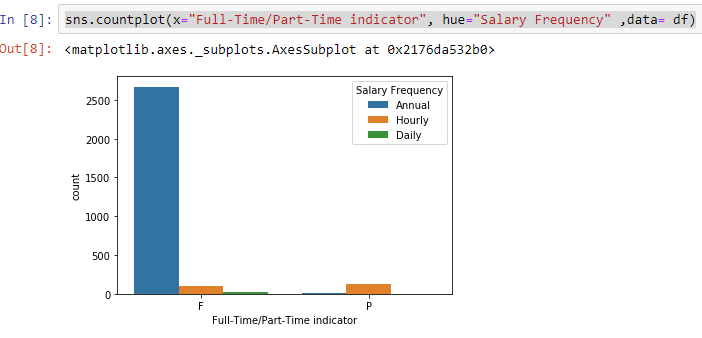
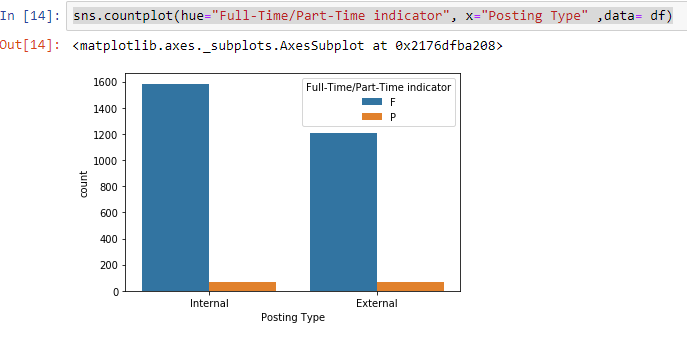
Once we have changed the data according to the requirements, it is necessary to analyze this data. One such way of doing this is by visualization of the results. A better visual representation helps in an optimal analysis of the data projections.
Following is an example to visualize the data.
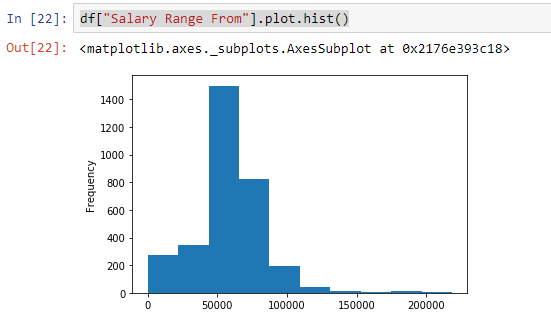
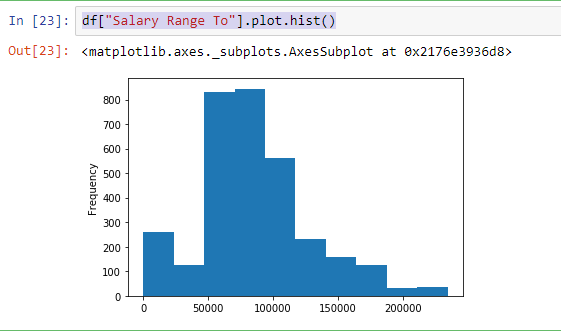
sns.countplot(x= "Full-Time/Part-Time indicator" , data= df)
sns.countplot(x="Full-Time/Part-Time indicator" , hue="Salary Frequency" , data= df)
sns.countplot(hue="Full-Time/Part-Time indicator", x="Posting Type" ,data= df)
df["Salary Range From"].plot.hist()
df["Salary Range To"].plot.hist()
import matplotlib.pyplot as plt
fig = plt.figure(figsize = (10,10))
ax = fig.gca()
sns.heatmap(df1.corr(), annot=True, fmt=".2f")
plt.title("Correlation",fontsize=5)
plt.show()
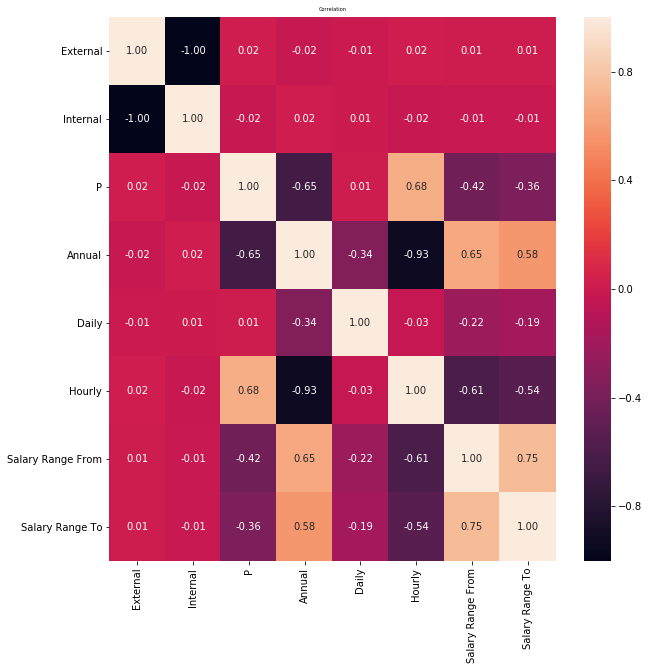
After visualization, we can make our analysis looking at the various plots and graphs. Suppose we are working on job data, by looking at the visual representation of a particular job in a region we can make out the number of jobs in a particular domain.
From the above analysis, we can assume the following results
In this python anaconda tutorial, we have understood how we can setup anaconda for python with use cases that covered python fundamentals, data analysis, and machine learning. With over 300 packages for data science, anaconda provides optimal support with efficient results.
Don’t miss out on the opportunity to become a Python master. Enroll in our comprehensive Masters in Python and discover how to write code like a pro.
Have any questions? mention them in the comments of this article on ‘python anaconda tutorial’, and we will get back to you as soon as possible.


 Thank you for registering Join Edureka Meetup community for 100+ Free Webinars each month JOIN MEETUP GROUP