In a world where data is being generated at such an alarming rate, the correct analysis of that data at the correct time is very useful. One of the most amazing framework to handle big data in real-time and perform analysis is Apache Spark. Together, Python for Spark or PySpark is one of the most sought-after certification courses, giving Scala for Spark a run for its money. So in this PySpark Tutorial blog, I’ll discuss the following topics:
- What is PySpark?
- PySpark in the Industry
- Why Go for Python?
- Spark RDDs
- Machine Learning with PySpark
PySpark Tutorial: What is PySpark?
Apache Spark is a fast cluster computing framework which is used for processing, querying and analyzing Big data. Being based on In-memory computation, it has an advantage over several other big data Frameworks.

Originally written in Scala Programming Language, the open source community has developed an amazing tool to support Python for Apache Spark. PySpark helps data scientists interface with RDDs in Apache Spark and Python through its library Py4j. There are many features that make PySpark a better framework than others:
- Speed: It is 100x faster than traditional large-scale data processing frameworks
- Powerful Caching: Simple programming layer provides powerful caching and disk persistence capabilities
- Deployment: Can be deployed through Mesos, Hadoop via Yarn, or Spark’s own cluster manager
- Real Time: Real-time computation & low latency because of in-memory computation
- Polyglot: Supports programming in Scala, Java, Python and R
Let’s move ahead with our PySpark Tutorial Blog and see where is Spark used in the industry.
PySpark in the Industry
Every Industry revolves around Big Data and where there’s Big Data there’s Analysis involved. So let’s have a look at the various industries where Apache Spark is used. Learn more about Big Data and its applications from the Data Engineering Course.

Media is one of the biggest industry growing towards online streaming. Netflix uses Apache Spark for real-time stream processing to provide personalized online recommendations to its customers. It processes 450 billion events per day which flow to server-side applications.

Finance is another sector where Apache Spark’s Real-Time processing plays an important role. Banks are using Spark to access and analyse the social media profiles, to gain insights which can help them make right business decisions for credit risk assessment, targeted ads and customer segmentation. Customer Churn is also reduced using Spark. Fraud Detection is one of the most widely used areas of Machine Learning where Spark is involved.

Healthcare providers are using Apache Spark to Analyse patient records along with past clinical data to identify which patients are likely to face health issues after being discharged from the clinic. Apache Spark is used in Genomic Sequencing to reduce the time needed to process genome data.

Retail and E-commerce is an industry where one can’t imagine it running without the use of Analysis and Targeted Advertising. One of the largest E-commerce platform today Alibaba runs some of the largest Spark Jobs in the world in order to analyse petabytes of data. Alibaba performs feature extraction in image data. eBay uses Apache Spark to provide Targeted Offers, enhance customer experience and optimize overall performance.

Travel Industries also use Apache Spark. TripAdvisor, a leading travel website that helps users plan a perfect trip is using Apache Spark to speed up its personalized customer recommendations.TripAdvisor uses apache spark to provide advice to millions of travellers by comparing hundreds of websites to find the best hotel prices for its customers.
An important aspect of this PySpark Tutorial is to understand why we need to go for Python? Why not Java, Scala or R?
Subscribe to our youtube channel to get new updates..!
Why Go for Python?
Easy to Learn: For programmers Python is comparatively easier to learn because of its syntax and standard libraries. Moreover, it’s a dynamically typed language, which means RDDs can hold objects of multiple types.

A vast set of Libraries: Scala does not have sufficient data science tools and libraries like Python for machine learning and natural language processing. Moreover, Scala lacks good visualization and local data transformations.

Huge Community Support: Python has a global community with millions of developers that interact online and offline in thousands of virtual and physical locations.

One of the most important topics in this PySpark Tutorial is the use of RDDs. Let’s understand what are RDDs
Spark RDDs
When it comes to iterative distributed computing, i.e. processing data over multiple jobs in computations, we need to reuse or share data among multiple jobs. Earlier frameworks like Hadoop had problems while dealing with multiple operations/jobs like
- Storing Data in Intermediate Storage such as HDFS
- Multiple I/O jobs make the computations slow
- Replications and serializations which in turn makes the process even slower
RDDs try to solve all the problems by enabling fault-tolerant distributed In-memory computations. RDD is short for Resilient Distributed Datasets. RDD is a distributed memory abstraction which lets programmers perform in-memory computations on large clusters in a fault-tolerant manner. They are the read-only collection of objects partitioned across a set of machines that can be rebuilt if a partition is lost. There are several operations performed on RDDs:
- Transformations: Transformations create a new dataset from an existing one. Lazy Evaluation
- Actions: Spark forces the calculations for execution only when actions are invoked on the RDDs
The best way to become a Data Engineer is by getting the Azure Data Engineering Certification in Mumbai
Let’s understand a few Transformations, Actions and Functions
Reading a file and Displaying Top n elements:
rdd = sc.textFile("file:///home/edureka/Desktop/Sample")
rdd.take(n)
Output:
[u'Deforestation is arising as the main environmental and social issue which has now taken the form of more than a powerful demon. ',
 u'We must know about the causes, effects and ways to solve the problems arisen because of the deforestation. ',
 u'We have provided many paragraphs, long and short essay on deforestation in order to help your kids and children to get aware about the problem as well as get participated in the essay writing competition in the school or outside the school. ',
 u'You can select any deforestation essay given below according to the class standard. ',
 u'Deforestation is arising as the major global problem to the society and environment.']
Converting to lowercase and Splitting:(Lower and Split)
def Func(lines):
lines = lines.lower()
lines = lines.split()
return lines
rdd1 = rdd.map(Func)

rdd1.take(5)
Output:
[[u'deforestation',
  u'is',
  u'arising',
  u'as',
  u'the',
  u'main',
  u'environmental',
  u'and',
  u'social',
  u'issue',
  u'which',
  u'has',
  u'now',
  u'taken',
.....
.
.
.
]
Removing StopWords:(Filter)
stop_words = ['a','all','the','as','is','am','an','and','be','been','from','had','I','I’d','why','with']
rdd2 = rdd1.filter(lambda z: z not in stop_words)
rdd2.take(10)
Output:
[u'deforestation',
 u'arising',
 u'main',
 u'environmental',
 u'social',
 u'issue',
 u'which',
 u'has',
 u'now',
 u'taken']
Sum of Numbers from 1 to 500: (Reduce)
sum_rdd = sc.parallelize(range(1,500))
sum_rdd.reduce(lambda x,y: x+y)
124750
Machine Learning with PySpark
Continuing our PySpark Tutorial Blog, let’s analyze some BasketBall Data and do some future Prediction. So, here we are going to use the Basketball Data of all the players of NBA since 1980 [year of introduction of 3 Pointers].

Data Loading:
df = spark.read.option('header','true')
.option('inferSchema','true')
.csv("file:///home/edureka/Downloads/season_totals.csv")
Printing Columns:
print(df.columns)
Output:
['_c0', 'player', 'pos', 'age', 'team_id', 'g', 'gs', 'mp', 'fg', 'fga', 'fg_pct', 'fg3', 'fg3a', 'fg3_pct', 'fg2', 'fg2a', 'fg2_pct', 'efg_pct', 'ft', 'fta', 'ft_pct', 'orb', 'drb', 'trb', 'ast', 'stl', 'blk', 'tov', 'pf', 'pts', 'yr']
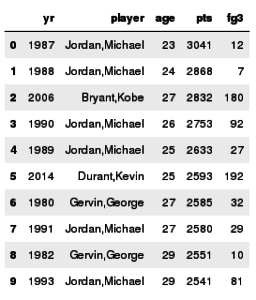
Sorting Players(OrderBy) and toPandas:
Here we are sorting players based on point scored in a season.
df.orderBy('pts',ascending = False).limit(10).toPandas()[['yr','player','age','pts','fg3']]
Output:
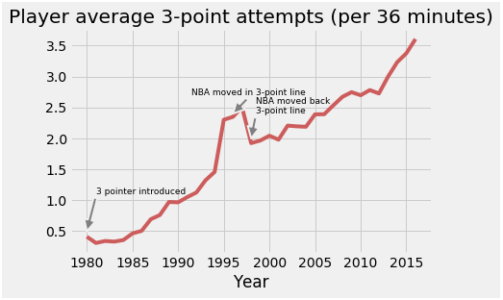
Using DSL and matplotlib:
Here we are analysing the average number of 3 point attempts for each season in a time limit of 36 min[an interval corresponding to an approximate full NBA game with adequate rest]. We compute this metric using the number of 3-point field goal attempts (fg3a) and minutes played (mp) and then plot the result using matlplotlib.
from pyspark.sql.functions import col
fga_py = df.groupBy('yr')
.agg({'mp' : 'sum', 'fg3a' : 'sum'})
.select(col('yr'), (36*col('sum(fg3a)')/col('sum(mp)')).alias('fg3a_p36m'))
.orderBy('yr')

from matplotlib import pyplot as plt
import seaborn as sns
plt.style.use('fivethirtyeight')


_df = fga_py.toPandas()
plt.plot(_df.yr,_df.fg3a_p36m, color = '#CD5C5C')
plt.xlabel('Year')
_=plt.title('Player average 3-point attempts (per 36 minutes)')
plt.annotate('3 pointer introduced', xy=(1980, .5), xytext=(1981, 1.1), fontsize = 9,
arrowprops=dict(facecolor='grey', shrink=0, linewidth = 2))
plt.annotate('NBA moved in 3-point line', xy=(1996, 2.4), xytext=(1991.5, 2.7), fontsize = 9,
arrowprops=dict(facecolor='grey', shrink=0, linewidth = 2))
plt.annotate('NBA moved back
3-point line', xy=(1998, 2.), xytext=(1998.5, 2.4), fontsize = 9, arrowprops=dict(facecolor='grey', shrink=0, linewidth = 2))
Output:
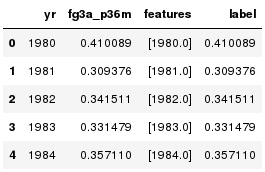
Linear Regression and VectorAssembler:
We can fit a linear regression model to this curve to model the number of shot attempts for the next 5 years. We have to transform our data using the VectorAssembler function to a single column. This is a requirement for the linear regression API in MLlib.
from pyspark.ml.feature import VectorAssembler
t = VectorAssembler(inputCols=['yr'], outputCol = 'features')
training = t.transform(fga_py)
.withColumn('yr',fga_py.yr)
.withColumn('label',fga_py.fg3a_p36m)
training.toPandas().head()
Output:
Building Model:
We then build our linear regression model object using our transformed data.
from pyspark.ml.regression import LinearRegression
lr = LinearRegression(maxIter=10)
model = lr.fit(training)
Applying Trained Model to Dataset:
We apply our trained model object model to our original training set along with 5 years of future data
from pyspark.sql.types import Row

# apply model for the 1979-80 season thru 2020-21 season
training_yrs = training.select('yr').rdd.map(lambda x: x[0]).collect()
training_y = training.select('fg3a_p36m').rdd.map(lambda x: x[0]).collect()
prediction_yrs = [2017, 2018, 2019, 2020, 2021]
all_yrs = training_yrs + prediction_yrs

# built testing DataFrame
test_rdd = sc.parallelize(all_yrs)
row = Row('yr')&lt
all_years_features = t.transform(test_rdd.map(row).toDF())

# apply linear regression model
df_results = model.transform(all_years_features).toPandas()
Plotting the final Prediction:
We can then plot our results and save the graph in a specified location.
plt.plot(df_results.yr,df_results.prediction, linewidth = 2, linestyle = '--',color = '#224df7', label = 'L2 Fit')
plt.plot(training_yrs, training_y, color = '#f08080', label = None)
plt.xlabel('Year')
plt.ylabel('Number of attempts')
plt.legend(loc = 4)
_=plt.title('Player average 3-point attempts (per 36 minutes)')
plt.tight_layout()
plt.savefig("/home/edureka/Downloads/Images/REGRESSION.png")
Output:
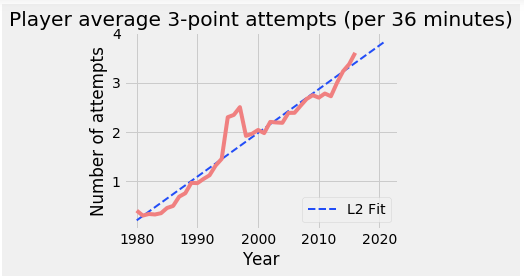
And with this graph, we come to the end of this PySpark Tutorial Blog.
So This is it, Guys!
I hope you guys got an idea of what PySpark is, why Python is best suited for Spark, the RDDs and a glimpse of Machine Learning with Pyspark in this PySpark Tutorial Blog. Congratulations, you are no longer a Newbie to PySpark. If you want to learn more about PySpark and Understand the different Industry Use Cases, have a look at our Spark with Python Blog.
Now that you have understood What is Pyspark, check out the PySpark Course by Edureka, a trusted online learning company with a network of more than 250,000 satisfied learners spread across the globe. Edureka’s Python Spark Certification Training using PySpark is designed to provide you with the knowledge and skills that are required to become a successful Spark Developer using Python and prepare you for the Cloudera Hadoop and Spark Developer Certification Exam (CCA175).