_1668670867.jpg)
Product management is the method of strategically overseeing every phase of the product lifecycle— the lifecycle that begins at research and development and ultimately leads to testing and positioning—to create technically viable products that satisfy both the needs of a user and the objectives of a business. Product management is an interdisciplinary function: efficient product management involves multi-disciplinary communication with corporate stakeholders, C-level executives and sales and marketing departments. But the product managers must track the health and standing of their product in the market. And the managers can achieve this tracking with the help of product management metrics.
What are Product Management Metrics?
Metrics is a quantitative measurement that allows companies to determine and track the success of a business activity or a product. Product Management Metrics are employed by marketers, stakeholders, and the product management team to set objectives, detect problems and make calculated decisions. Today, the major problem with metrics is not how to measure them – Google Analytics alone is a helpful tool for estimating and envisioning your success. It is deciding upon a few crucial metrics to keep a tab on and act upon the data discovered rather than wasting time tracking it.
Depending on the company’s objective – drawing in a new consumer segment, improving popularity with users, obtaining ideas for new elements – the product management team needs to determine the right metrics. KPIs are among the key points in constructing a product roadmap – they entitle product managers to assess engagement, consumer experience, feature usage, and commercial success. But before we delve into what crucial product management metrics should be used by product managers, let us first understand what KPIs are and what their importance is.
KPIs and their Importance in the Product Management Team
In product management teams, like in other companies’ teams, Key Performance Indicators (KPIs) are employed to guide decisions, form clear targets, celebrate success, and determine issues and risks. An absence of KPIs in a product management team can result in a flawed understanding of progress, difficulty in assessing and learning from present and past work, and incapacity to prioritise between various streams of activity when progress is off track.
It is generally upon the product manager to determine these KPIs, counting on what they decide to be the most crucial metrics to track and report on. Eventually, product KPIs are the basis for measuring (and upgrading) the success of the product and the product management operation. The KPIs of product managers can cover a wide set of subjects, which will vastly depend on the essence of the product and the methods employed by the company.
For instance, suppose their priority is more on product development. In that case, the KPIs could heavily rely upon the structure and production of the product. Still, if the team also desires to determine the consumer impact, the KPIs could be more inclusive of usage and consumer behaviours. Eventually, as leaders of the product team, they have to make a judgment call on the KPIs that are significant, but this should be heavily driven by the top-level goals of the company.
Do you have what it takes to work as a product manager for the best management companies? But feel like you are lacking some skills? Check out our Advanced Executive Certificate in Product Management and upskill yourself to enter this enormous and glorious field of product management.
We have compiled a list of the most crucial product management metrics and KPIs to help understand what area of product management each metric caters to and helps the product management team.
Metrics and KPIs in Product Management
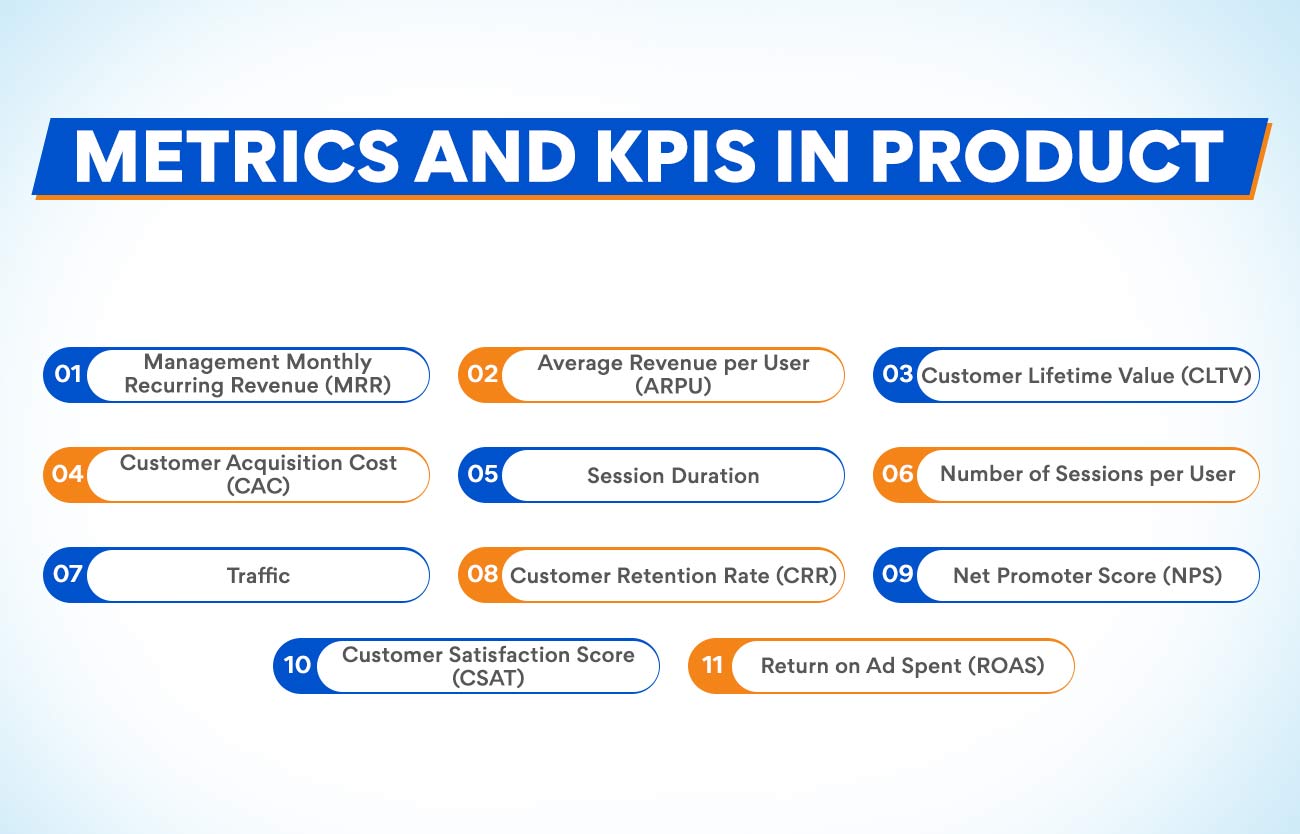
- Monthly Recurring Revenue (MRR)
Monthly recurring revenue measures a firm’s expected revenue stream every month. The major objective of this metric is to track performance across various subscription packages or terms with different prices and benefits. This type of tool is most suitable for software as a service (SaaS) companies or those companies that yield income by providing subscription services. These sales activities vary from one-time transactions, as they are stable and easier to predict.
MRR enables product managers to evaluate the growth or decline of monthly revenue and assess the business’s financial health. The formula for MRR is:
MRR = revenue at the beginning of the month + revenue from new consumers + revenue change from upgrading consumers – revenue change from downgrading consumers – revenue from lost consumers
One can also multiply the MRR by 12 to calculate the Annual Recurring Revenue (ARR). This may assist the company in preparing ahead even further. It also may provide the company with details about the future of the firm that the members can deliver to the stakeholders.
- Average Revenue per User (ARPU)
The Average Revenue per User is the amount of money an organisation can predict from an individual consumer. This is a great method for a SaaS firm to measure the result of a new strategy, pricing adjustment or a new subscription program. If the product management team performs the analysis for various sub-groups, they can analyse which segments of consumers carry the most value. This can indicate to the investors the profitability levels, guide the investment decisions and guarantee the financial stability of the company.
The product managers can calculate the company’s ARPU using the average or total revenue from a given duration, just like the MRR, and the total number of user accounts. Here is the formula for ARPU:
ARPU = MRR / total number of user accounts
- Customer Lifetime Value (CLTV)
Customer Lifetime Value is a favoured metric that checks the revenue a business can anticipate from a consumer in the longer term. Customer “lifetime” alludes to the average period a consumer spends supporting a business. “Value” refers to the monetary value or profit that the consumer illustrates. CLTV is an excellent method to achieve financial forecasting and prepare the economic stability of a company. It can also aid in acquiring funding from investors.
What is more, CLTV reports to the product managers on what amount of money they can spend to draw and retain consumers. This includes the expenses related to lead generation, retention and marketing techniques. They want to ensure that the amount they are spending is proportionate to the return on investment they obtain. To calculate CLTV, figure out the average consumer lifetime for the company and the average revenue per user. This is the formula for CLTV:
CLTV = average revenue per user x average customer lifetime
- Customer Acquisition Cost (CAC)
Customer Acquisition Cost is the cost of drawing and acquiring a new consumer. This includes the resources, time, effort and money it takes to generate leads and convert candidates into paying consumers. Customer Acquisition Costs may possess:
- Costs of materials for marketing
- Sponsorship fees
- Costs of software for marketing
- Salaries of marketing and sales personnel
Companies often measure CLTV along with CAC to calculate the total probable value of a new consumer. CAC enables managers to confirm that they are spending reasonable amounts on obtaining consumers and that consumers are bringing in sufficient revenue to justify expenses. If not, the business might need to rethink marketing or pricing techniques. Here is the formula for CAC:
CAC = marketing and sales expenses over some time / total consumers acquired over the time
Join our Advanced Executive Certificate in Product Management to learn and upskill yourself in the tools and techniques of product marketing analysis and become a glorified product manager.
- Session Duration
Session Duration is the period in which a user is engaging in various interactions on a website. This sort of metric is a component of techniques to track digital product usage. While it does not estimate revenue, it measures consumer engagement, which affects revenue significantly. The more consumers interact with a firm’s website and digital content, the more likely they will purchase a product. Online tools can provide potential consumers with helpful details about a business’s products, values and missions.
More extended session durations are useful, as they represent consumer interest in a website. User interactions reflect the effectiveness of marketing efforts and can lead to brand loyalty. Consumer-focused metrics like this are great methods to improve and upgrade financial success. Here is the formula for measuring session duration for a company:
Average Session Duration = total time users spend on product/number of users
- Number of Sessions per User
Like Session Duration, the Number of Sessions per User metric estimates how frequently users come back to engage with a website. If users land on a website quite frequently, this can indicate their interest in the product or the company. Leaders calculate this by tracking the number of logins by users. They can also compare sessions per user between various groups to locate their target audiences.
- Traffic
Traffic is the number of people who discover and visit websites. It can arise naturally, organic, or paid, occurring because a business paid for the advertisement slot or sponsored content. Traffic is generally people who desire to know more about a company, and they may purchase a product or service. This is a fantastic metric to calculate how influential your website marketing is.
- Customer Retention Rate (CRR)
The customer Retention Rate is the percentage at which consumers continue to support a company. It is usually a more profitable investment for firms to concentrate on current consumers, as they have already invested money, time and effort in achieving them. Moreover, current customers are naturally more likely to try a new feature, provide feedback or upgrade a plan. Concentrating on keeping these customers may make more practical financial sense for a company. Here is the CRR formula:
CRR = [(customers at end of period – new customers) / customers at start of period] x 100
- Net Promoter Score (NPS)
Net Promoter Score concerns the number of consumers who are possible to suggest a product, supporters, and those who do not like it, detractors. An increased NPS leads to development, and understanding how many people are detracting can forewarn a company of a problem in the consumer experience. This metric reflects the popularity of product characteristics. It may encourage product teams to develop creative ideas for new features or better UX design. Here is the formula:
NPS = percentage of promoters – percentage of detractors
- Customer Satisfaction Score (CSAT)
A Customer Satisfaction Score is the capacity to which consumers like a product or service characteristic. It is usually 1-5 or 1-10, and businesses can discover it by conducting consumer satisfaction surveys. This can assist employees and leaders in understanding if they could upgrade their measures to make a more promising consumer experience. It also enables a leader to decide if they want to conduct a more detailed, qualitative investigation into consumer satisfaction. Here is the Avergae CSAT formula
CSAT = total score / total number of respondents
- Return on Ad Spent (ROAS)
Return on Ad Spent is a metric that traces the business’s income from promotional campaigns. It is a sort of Return on Investment (ROI) that calculates the amount of profit you attain from the effort, time and money you spent on activities relating to sales and marketing. This measurement is a fantastic way of deciding whether the company is allocating resources and money efficiently to the advertisement department. Here is the formula:
ROAS = conversion value / advertising cost
Conclusion
Maximum product managers focus only on product characteristics while neglecting many other metrics that need as much care, if not more. Recognising that your consumers desired something else in the beta phase is not a favourable situation to be in. The more you concentrate on your product, the higher any company’s success rate will be. Utilising the above-mentioned product management metrics and KPIs, any product management team can be on top of product quality, business performance, consumer satisfaction, consumer usage, and so on. This is the basis of a well-oiled business machine.
Our Advanced Executive Certificate in Product Management helps you learn about various product management aspects. If you are looking for a prosperous career in this field, you must opt for this course. Even working professionals can enrol with a flexible class schedule and online classes.