
Advanced Power BI Certification Course with G ...
- 12k Enrolled Learners
- Weekend
- Live Class
(4230)


 Copy Link!
We live in times of ever-expanding data. And where there’s data, there’s analytics on top of it. Anyone who has ever worked with data or aspires to needs to have hands-on experience with a few tools. One such tool is the Microsoft Power BI Desktop.
I guess that is why you all are here. Because you’ve either heard or read about this new end in-analytics tool by Microsoft. Well, you’ve come to the right place. This blog, specifically, will help you with all you need to get started with Power BI. Hope you enjoy learning this new piece of technology.
So, let’s begin by understanding a little bit about Power BI.
It is a cloud-based, Business Intelligence Service by Microsoft which provides non-technical Business users with tools for Reporting, Analytics and Visualisation.
All the concepts in the blog are also explained in ample detail in the video given here.
Power BI Full Course – Learn Power BI in 4 Hours | Power BI Tutorial for Beginners | Edureka
This Edureka video on the “Power BI Full Course” will help you understand and learn Power BI in detail
Power BI Desktop allows you to ingest, transform, integrate and enrich your data. Power BI Desktop connects to all your data sources and simplifies data evaluation and sharing with scalable dashboards, interactive reports, embedded visuals, and more.

The most common uses for Power BI Desktop are as follows:
Connect to data
Transform and clean that data, to create a data model
Create visuals, such as charts or graphs, that provide visual representations of the data
Create reports that are collections of visuals, on one or more report pages
Share reports with others by using the Power BI service
People most often responsible for such tasks are often considered data analysts (sometimes referred to as analysts) or business intelligence professionals (often referred to as report creators).
However, many people who don’t consider themselves an analyst or report creators use Power BI Desktop to create compelling reports, or to pull data from various sources and build data models, which they can share with their coworkers and organizations.
Creating a Report on the Power BI Desktop basically consists of 3 steps:
Power BI Desktop enables rich data visualization, but why does a Power BI report look different in Power BI Service compared to Power BI Desktop? Variations in rendering, browser settings, and data refresh can impact how visuals appear across platforms.
The more you use it, the better you’ll get at it. So, let’s get started.
Power BI Desktop Installation
It’s a pretty simple process. All you have to do is:

You could just be a free user at first and then download a paid version later if you like. You can see the differences between being a free user and a paid user on the Pricing page. The basic difference only arises with data usage capacity.
You can open your Power BI Desktop directly from here. So, what you see when opening the Power BI Desktop are these tutorial videos on building reports, query concepts, etc.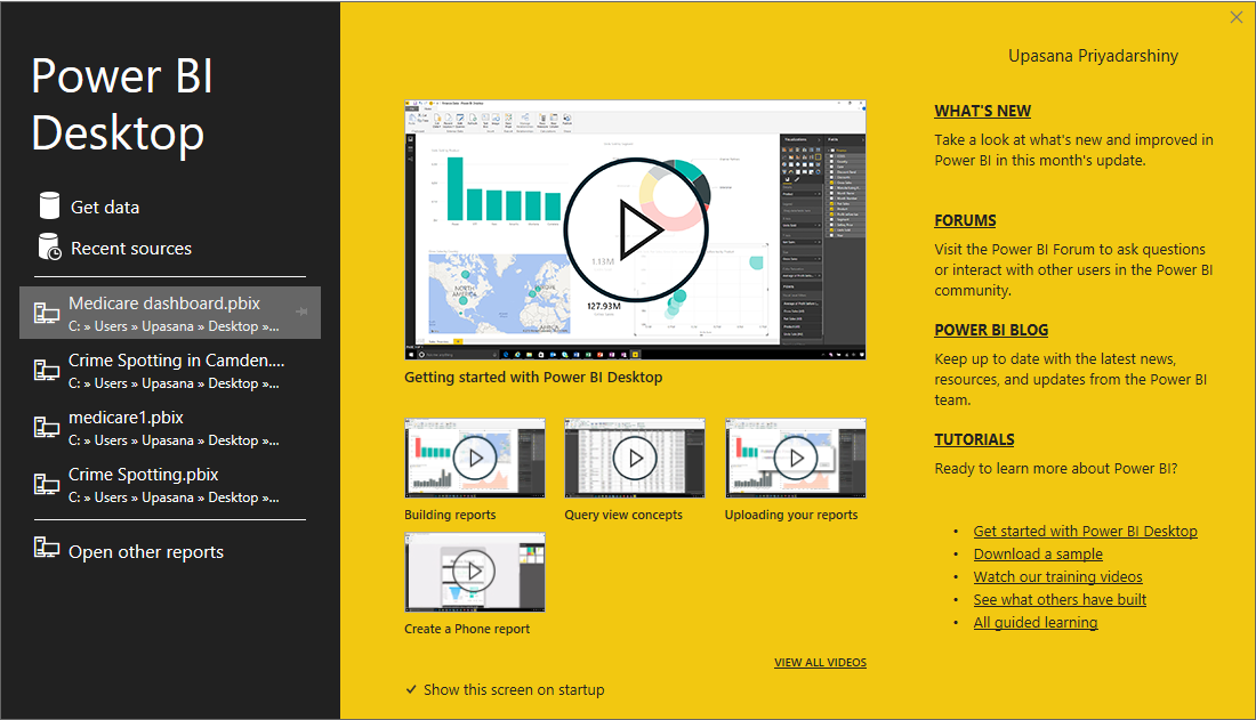
The first thing you do in order to build a dashboard is, connect to data sources. Following are the steps you need to follow to import the datasets.

So, when you first load your data you see a blank screen. On the left, you see these 3 basic views you have here.
Here you’ll create the dashboard.
Here you get a preview of your data and make changes if you want to. This is also where you can create a new calculated column.
Here you can see the relationship in the objects.
It’s always advisable, to begin with, the data view. You basically get a preview of what your data looks like. Here are a few things to take care of, before you actually start creating the Power BI dashboard.
We’re building the dashboard for the user. All the naming conventions and data types are going to appear at the surface and we want it to be as interactive as possible.
Anything that’s not absolutely necessary in the model – delete it. Because it’s going to contribute to the size of the model and take up more system resources whilst processing.
Hide the columns that you need later for calculation purposes, but the user doesn’t necessarily need to see. The hidden column will appear greyed out and won’t appear in the report view.

Once you’re done with all the transformations, you can directly go to the report view of your Power BI Desktop.
Ready to showcase your skills? Dive into hands-on Power BI projects that will help you build stunning dashboards and gain real-world experience.
Now, you’re ready to start the fun part and it’s creating the report.
It’s pretty easy to work with. So, if I want to create a chart, all I have to do is select your data fields, drag and drop them where it says drag data fields here.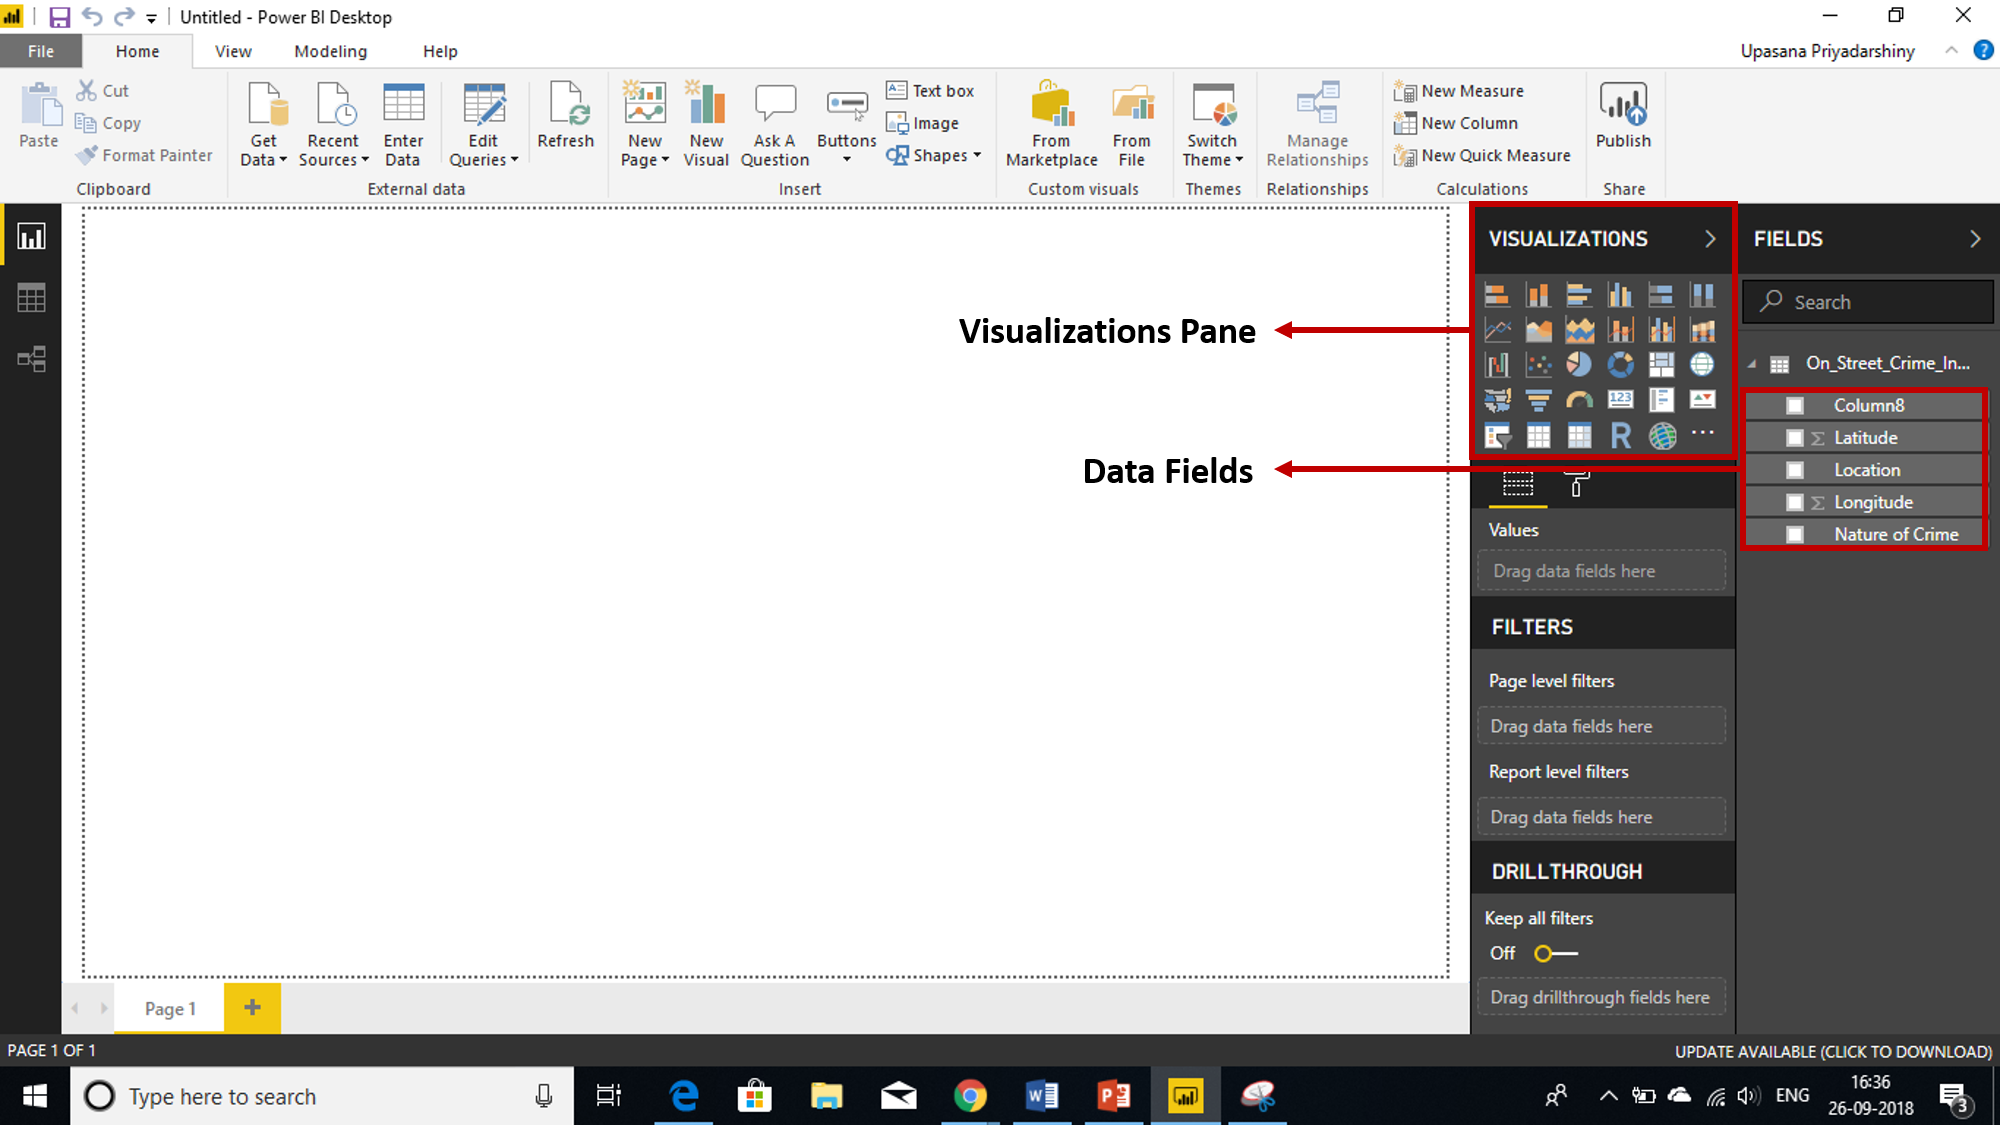
And now you’re ready to deploy this to the Power BI site. All you must do is click on the Publish Button on the right top corner of the screen. 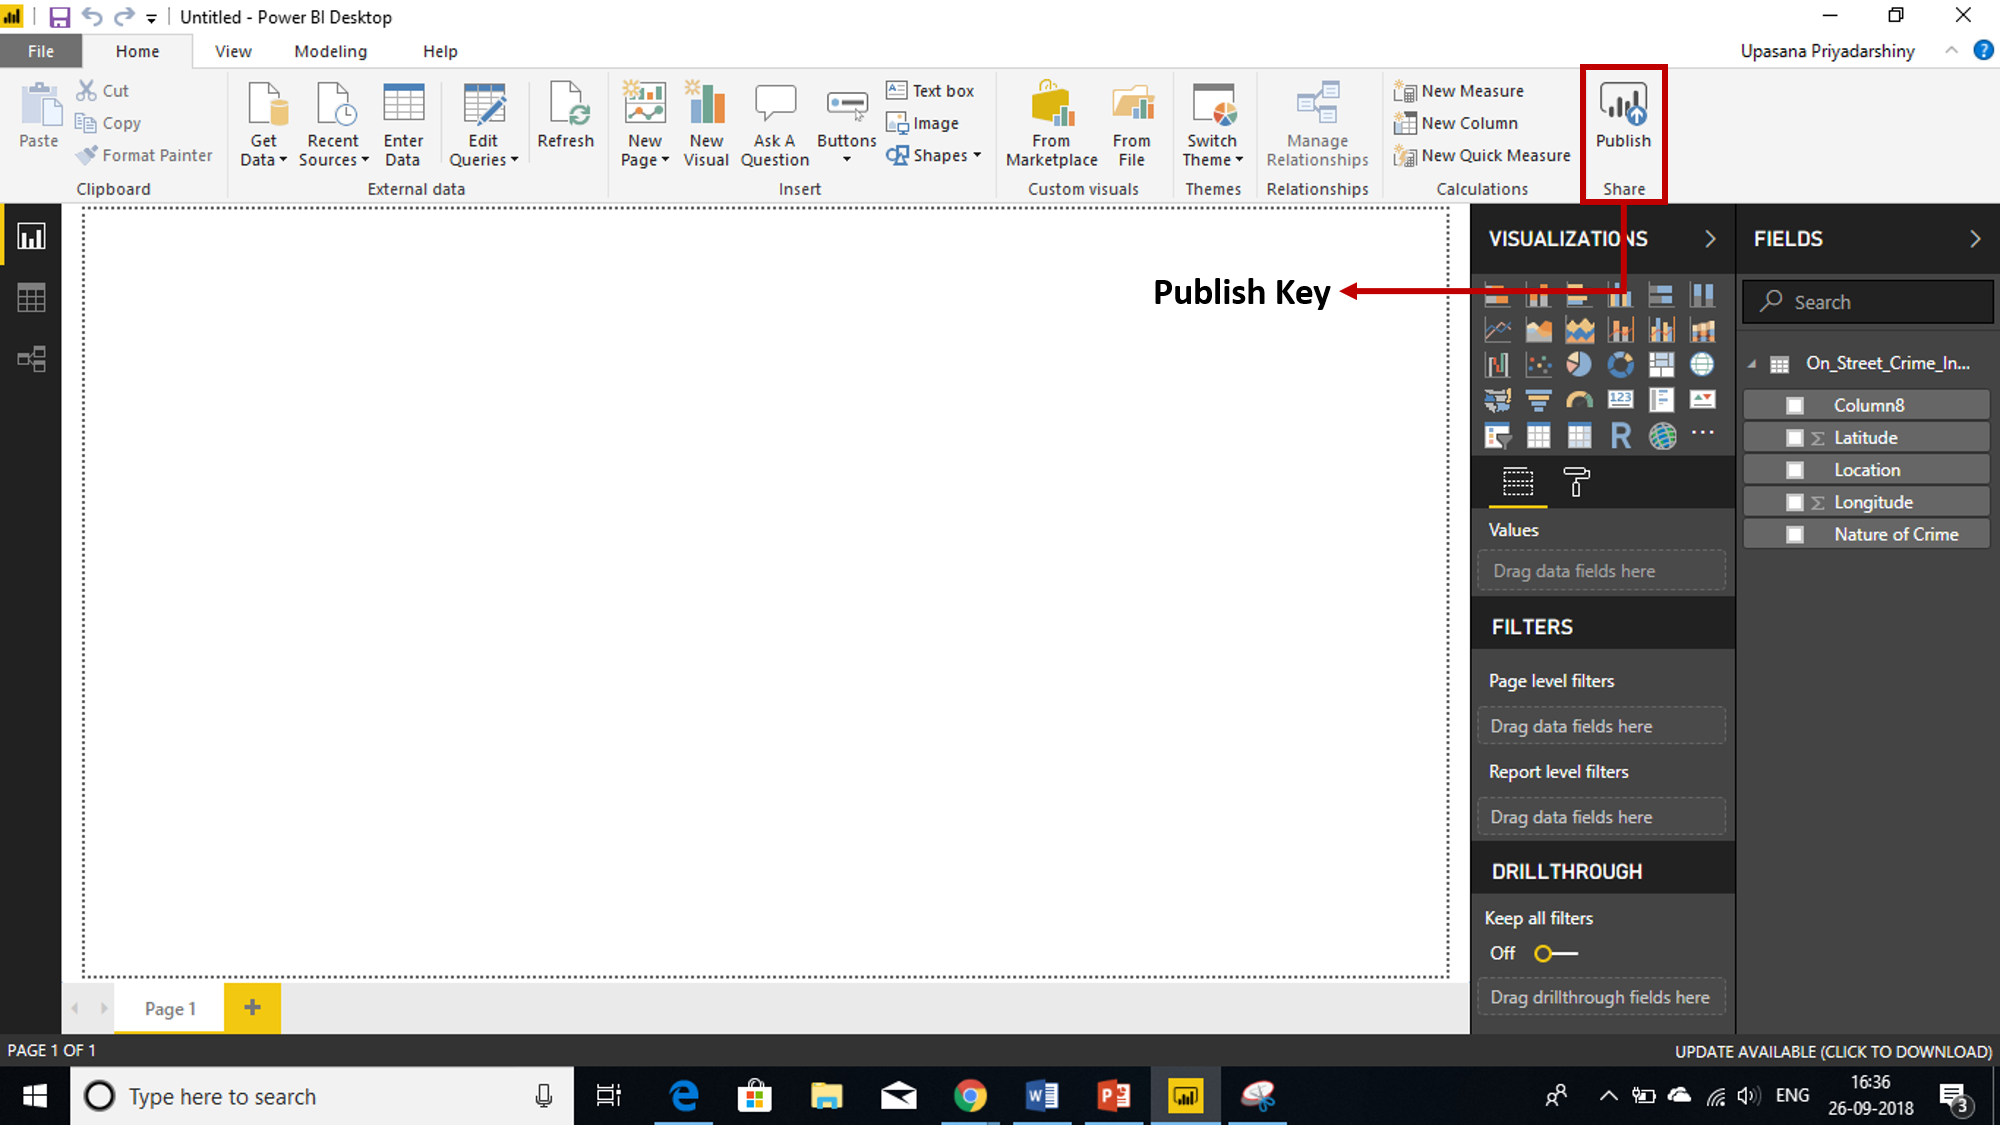
Now that you’ve learned all about the Power BI Desktop, go on and create comprehensive and powerful visualization reports with this technology. You can use these sample datasets to start experimenting with Power BI Desktop. If you’re wondering what does it actually take to learn Power BI Concepts? Well, you can check out the Power BI Certification Course curated by Industry Experts. This Power BI Course will help you master the concepts such as Power BI Desktop, Mobile Apps, Reports, Architecture, DAX, Service, and many more.
If you wish to build a career in business intelligence, our Business Intelligence Course will help you mine that data and enhance the decision-making processes throughout your organization. Also, Transform data into insights and advance your career with our comprehensive Business Analyst Course.


 Thank you for registering Join Edureka Meetup community for 100+ Free Webinars each month JOIN MEETUP GROUP