


Advanced Power BI Certification Course with G ...
- 13k Enrolled Learners
- Weekend/Weekday
- Live Class
(4230)


 Copy Link!
This blog is essentially designed for users new to the Power BI Desktop and is meant to give you a quick and easy walk-through on a formula language called Data Analysis Expressions (DAX). If you’re familiar with functions in MS Excel or SQL, many of the formulae in this Power BI DAX Basics article will appear similar to you.
Having said that, here are the concepts, which form an integral part of all Power BI Course Syllabus after learning which you should have a good understanding of the most fundamental concepts in DAX.
So, let’s start with the basics of Power BI DAX, okay?
It’s quite easy to create reports using the Power BI Desktop, that’ll show valuable insights straight off the bat.
But, what if you need to analyze growth percentage across all the product categories, for all the different date ranges? Or, you need to calculate the annual growth of your company compared to market giants?
Learning DAX will help you get the most out of your charts and visualization and solve real business problems.
DAX comprises of functions, operators, and constants that can be put into the form of formulae to calculate values with the help of data already present in your model.
The Power BI DAX includes a library of over 200 functions, operators, and constructs. Its library provides immense flexibility in creating measures to calculate results for just about any data analysis need.
Understanding DAX functions is essential for creating effective Power BI reports, but sometimes, users may encounter a situation where visuals appear blank after applying specific filters. This issue can arise due to incorrect filter context, missing data, or improperly defined DAX measures.
In this video on Power BI DAX Tutorial we will explore DAX Use Cases in Power BI, diving into why DAX is essential for advanced data modeling and analysis.
First of all, let me explain to you how this works. We shall, for the most part, be framing our understanding of Power BI DAX around three fundamental concepts: Syntax, Context, and Functions.
Of course, there are other important concepts here, but understanding these three will provide the best foundation on which you are going to build your skills.
The Syntax comprises of various components that make up a formula and how it’s written. Look at this simple DAX formula.
When trying to understand a DAX formula, it is often helpful to break down each of the elements into a language you think and speak every day. So, this formula includes the following syntax elements:
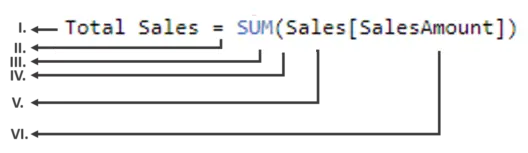 I. Total Sales is the measure name.
II. The equals sign operator (=) indicates the beginning of the formula.
III. SUM adds up all of the numbers in the column, Sales[SalesAmount].
IV. There are these parentheses () that surround an expression containing one or more arguments. All functions require at least one argument.
V. Sales is the table referenced.
VI. An argument passes a value to a function. The referenced column [SalesAmount] is an argument with which, the SUM function knows the column on which it has to aggregate a SUM.
Simply put, you can read it as, “For the measure named Total Sales, calculate (=) the SUM of values in the [SalesAmount ] column in the Sales table.“
♠ The Power BI DAX editor includes a suggestions feature, which helps you create syntactically correct formulas by suggesting you the right elements.
Context is one of the most important of the 3 DAX concepts. When one speaks of context, this may refer to one of the two types; Row context and Filter context.
Used predominantly whilst speaking of Measures, the Row-Context is most easily thought of as the current row. It applies whenever a formula has a function that applies filters to identify a single row in a table.
Filter-Context is a little more difficult to understand than the Row-Context. You can most easily think of the Filter-Context as one or more filters applied in a calculation. The Filter-Context doesn’t exist in the Row-context’s stead. Rather, it applies in addition to the former. Look at the following DAX formula.
This formula includes the following syntax elements:
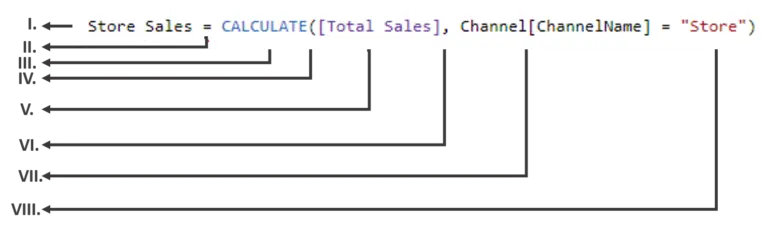
I. The measure name Store Sales.
II. The equals sign operator (=) indicates the beginning of the formula.
III. The CALCULATE function evaluates an expression, as an argument.
IV. Parenthesis () surround an expression containing one or more arguments.
V. A measure [Total Sales] in the same table as an expression.
VI. A comma (,) separates the first expression argument from the filter argument.
VII. The fully qualified referenced column, Channel[ChannelName] is our Row-Context. Each row in this column specifies a channel, Store, Online, etc.
VIII. The particular value, Store is used as a filter. This is our Filter-Context.
This formula ensures that the Total Sales Measure is calculated only for rows in the Channel[ChannelName] Column with the value “Store”, as a filter.
Functions are predefined, structured, and ordered formulae. They perform calculations using arguments passed on to them. These arguments can be numbers, text, logical values, or other functions.
When working with DAX in Power BI, one of the challenges analysts face is managing multi-level filters to ensure correct data aggregation. Filters in DAX operate within a context that can be altered by slicers, row-level filters, or complex hierarchical relationships in the data model
In this blog, we’re going to be focusing on the Power BI DAX formulae used in calculations, in Measures and Calculated Columns.
When you create a data modelling in the Power BI Desktop, you can extend a table by creating new columns. The content of the columns is defined by a DAX expression, evaluated row by row or in the context of the current row across that table.
In data models for DAX, however, all calculated columns occupy space in memory and are computed during table processing.
This behavior is helpful in resulting in better user experience but it uses precious RAM and hence, is a bad habit in production because each intermediate calculation is stored in RAM and wastes precious space.
There is another way of defining calculations in a DAX model, useful if you need to operate on aggregate values instead of on a row-by-row basis. These calculations are measures. One of the requirements of DAX is that a measure needs to be defined in a table. However, the measure does not really belong to the table. So, you can move a measure from one table to another one without losing its functionality.
Power BI Full Course – Learn Power BI in 4 Hours | Power BI Tutorial for Beginners | Edureka
You may go through this Microsoft Power BI recording where our expert has explained the topics in a detailed manner with examples that will help you to understand the concepts better.
Measures and calculated columns both use DAX expressions. The difference is the context of evaluation. A measure is evaluated in the context of the cell evaluated in a report or in a DAX query, whereas a calculated column is computed at the row level within the table it belongs to.
Even if they look similar, there is a big difference between calculated columns and measures. The value of a calculated column is computed during a data refresh and uses the current row as a context; it does not depend on user interaction in the report.
Hence, you have to define a calculated column whenever you want to do the following;
A measure operates on aggregations of data defined by the current context, which depends on the filter applied in the report – such as slicer, rows, and columns selection in a pivot table, or axes and filters applied to a chart.
So, you must define a measure whenever you want to display resulting calculation values that reflect user selections, such as;
Elevate your data analysis skills to expert levels with our in-depth Mastering Power BI Program. Gain the advanced expertise to analyze, visualize, and report data like a pro.
This DAX function returns the minimum numeric value in a column, or between two scalar expressions.
Syntax
MIN(<column>)
Example
=MIN([ResellerMargin])
This DAX function returns the minimum value in a column, including any logical values and numbers represented as text.
Syntax
MINA(<column>)
Example
=MINA(([PostalCode])
This DAX function returns the minimum numeric value that results from evaluating an expression for each row of a table.
Syntax
MINX(<table>, < expression evaluated for each row>)
Example
=MINX( FILTER(InternetSales, InternetSales[SalesTerritoryKey] = 5), InternetSales[Freight] + InternetSales[TaxAmt])
This DAX function returns the maximum value in a column, including any logical values and numbers represented as text.
Syntax
MAX(<column>)
Example
=MAX([ResellerMargin])
This DAX function returns the maximum value in a column, including any logical values and numbers represented as text.
Syntax
MAXA(<column>)
Example
=MAXA(([PostalCode])
This DAX function returns the maximum numeric value that results from evaluating an expression for each row of a table.
Syntax
MAXX(<table>, < expression evaluated for each row>)
Example
=MAXX( FILTER(InternetSales, InternetSales[SalesTerritoryKey] = 5), InternetSales[Freight] + InternetSales[TaxAmt]) This DAX function adds all the numbers in a column.
Syntax
SUM(<column>)
Example
=SUM(Sales[Amt])
This DAX function returns the arithmetic mean of the values in a column.
Syntax
AVERAGE(<column>)
Example
=AVERAGE(InternetSales[ExtendedSalesAmount])
This DAX function returns the sum of an expression evaluated for each row in a table.
Syntax
SUMX(<table>, <expression evaluated for each row>)
Example
=SUMX(FILTER(InternetSales, InternetSales[SalesTerritoryID]=5),[Freight])
This DAX function calculates the arithmetic mean of a set of expressions evaluated over a table.
Syntax
AVERAGEX(<table>, <expression evaluated for each row>)
Example
=AVERAGEX(InternetSales, InternetSales[Freight]+ InternetSales[TaxAmt])
This is a DAX function used to return the distinct count of items in a column. So, if there are multiple numbers of the same item, this function will count it as a single item.
Syntax
DISTINCTCOUNT(<column>)
Example
=DISTINCTCOUNT(ResellerSales_USD[SalesOrderNumber])
This is a DAX function used to return the count of items in a column. So, if there are multiple numbers of the same item, this function will count it as separate items and not a single item.
Syntax
COUNT(<column>)
Examples
=COUNT([ShipDate])
This is a DAX function used to return the count of items, in a column, that is not empty.
Syntax
COUNTA(<column>)
Example
=COUNTA('Reseller'[Phone])
This is a DAX function that counts the number of rows in the specified table, or in a table defined by an expression.
Syntax
COUNTROWS(<table>)
Example
=COUNTROWS('Orders')
This is a DAX function that counts the number of blank cells in a column.
Syntax
COUNTBLANK(<column>)
Example
=COUNTBLANK(Reseller[BankName])
This DAX function returns the specified date in Date-Time format.
Syntax
DATE(<year>, <month>, <day>)
Example
=DATE(2019,12,17)
This DAX function returns the specified hour as a number from 0 to 23 (12:00 A.M. to 11:00 P.M.).
Syntax
HOUR(<datetime>)
Example
=HOUR('Orders'[TransactionTime])
This DAX function returns the current date.
Syntax
TODAY()
This DAX function returns the current date and time in Date-Time format.
Syntax
NOW()
This DAX function returns the date in Date-Time format of the last day of the month, before or after a specified number of months.
Syntax
EOMONTH(<start_date>, <months>)
Example
=EOMONTH("March 3, 2008",1.5)
This DAX function returns the absolute value of the number given.
Syntax
ABS(<number>)
Example
=ABS([DealerPrice]-[ListPrice])
This DAX function returns the value of e raised to the power of the given number.
Syntax
EXP(<number>)
Example
=EXP([Power])
This DAX function returns the factorial of a number.
Syntax
FACT(<number>)
Example
=FACT([Values])
This DAX function returns the natural log of the given number.
Syntax
LN(<number>)
Example
=LN([Values])
This DAX function returns the log with the base of the given number.
Syntax
LOG(<number>,<base>)
Example
All the following return the same result, 2.
=LOG(100,10)
=LOG(100)
=LOG10(100)
This DAX function returns the value of Pi.
Syntax
PI()
This DAX function returns the value of the first argument raised to the power of the second argument.
Syntax
POWER(<number>, <power>)
Example
=POWER(5,2)
This DAX function performs division returns the integer part of the quotient.
Syntax
QUOTIENT(<dividend>, <divisor>)
Example
=QUOTIENT(5,2)
This DAX function returns the sign of a given number.
Syntax
SIGN(<number>)
Example
=SIGN( ([Sale Price] - [Cost Price]) )
This DAX function returns the square root of the given number.
Syntax
SQRT(<number>)
Example
=SQRT(25)
This DAX function performs logical AND(conjunction) on two expressions. For AND to return true, both conditions specified have to be fulfilled.
Syntax
AND(<logical argument1>,<logical argument2>)
Example
=IF(AND(10 > 9, -10 < -1), "All true", "One or more false"
Because both conditions, passed as arguments, to the AND function are true, the formula returns "All True".
This DAX function performs logical OR(disjunction) on two expressions. For OR to return true, either of the two conditions specified has to be fulfilled.
Syntax
OR(<logical argument1>,<logical argument2>)
Example
=IF(OR(10 > 9, -10 >-1), "True", "False"
Because one of the conditions, passed as arguments, to the OR function is true, the formula returns "True".
This DAX function performs logical NOT (negation) on given expression.
Syntax
NOT(<logical argument>)
Example
=NOT([CalculatedColumn1])
For each row in Calculated Column1, the NOT function returns the logical opposite of the given value.
This DAX function tests a series of inputs for the one that fulfills the condition specified in the argument.
Syntax
IF(logical_test>,<value_if_true>, value_if_false)
Example
=IF([Calls]<200,"low",IF([Calls]<300,"medium","high"))
This DAX function evaluates an expression and returns a specified value if the expression returns an error.
Syntax
IFERROR(value, value_if_error)
Example
=IFERROR(25/0,9999)
This DAX function returns TRUE or FALSE after checking whether a value is blank.
Syntax
ISBLANK(<value>)
Example
=IF( ISBLANK('CalculatedMeasures'[PreviousYearTotalSales]) , BLANK() , ( 'CalculatedMeasures'[Total Sales]-'CalculatedMeasures'[PreviousYearTotalSales] ) /'CalculatedMeasures'[PreviousYearTotalSales])
This DAX function returns TRUE or FALSE after checking whether a value is numeric.
Syntax
ISNUMBER(<value>)
Example
=IF(ISNUMBER(0), "Is number", "Is Not number")
This DAX function returns TRUE or FALSE after checking whether a value is a text.
Syntax
ISTEXT(<value>)
Example
=IF(ISTEXT("text"), "Is Text", "Is Non-Text")
This DAX function returns TRUE or FALSE after checking whether a value is non-text.
Syntax
ISNONTEXT(<value>)
Example
=IF(ISNONTEXT("text"), "Is Non-Text", "Is Text")
This DAX function returns TRUE or FALSE after checking whether a value is an error.
Syntax
ISERROE(<value>)
Example
=IF( ISERROR( SUM('ResellerSales_USD'[SalesAmount_USD]) /SUM('InternetSales_USD'[SalesAmount_USD]) ) , BLANK() , SUM('ResellerSales_USD'[SalesAmount_USD]) /SUM('InternetSales_USD'[SalesAmount_USD]) )
This DAX function joins two text strings into one.
Syntax
CONCATENATE(<text1>, <text2>)
Example
=CONCATENATE("Hello ", "World")
This DAX function the result of an expression evaluated for each row in a table.
Syntax
CONCATENATEX(<table>, <expression>, [delimiter])
Example
=CONCATENATEX(Employees, [FirstName] & “ “ & [LastName], “,”)
This DAX function rounds a number to the specified number of decimals and returns the result as text.
Syntax
FIXED(<number>, <decimals>, <no_commas>)
Example
=FIXED([PctCost],3,1)
This DAX function replaces part of a text string, based on the number of characters you specify, with a different text string.
Syntax
REPLACE(<old_text>, <start_num>, <num_chars>, <new_text>)
Example
=REPLACE('New Products'[Product Code],1,2,"OB")
This DAX function returns the number of the characters at which a specific text string is first found.
Syntax
SEARCH(<find_text>, <within_text>[, [<start_num>][, <NotFoundValue>]])
Example
=SEARCH("n","printer")
The formula returns 4 because "n" is the fourth character in the word "printer."
This DAX function returns a text string in all uppercase letters.
Syntax
UPPER (<text>)
Example
=UPPER(['New Products'[Product Code])
Prerequisite: You’ll need to open this given Power BI Desktop file.
Since I’m assuming this is going to be your first, I’ll be writing this bit in great detail for you to follow along.
In the field list of the Report View, right-click on the Sales table, followed by the New Measure.
Replace Measure by typing a new measure name Previous Quarter Sales, in the Formula Bar.
In this formula, you want to use the CALCULATE function. So, after the equals sign, type the first few letters CAL, and then double-click the function you want to use.
The CALCULATE function has at least two arguments. The first is the expression to be evaluated, and the second is a Filter.
After the opening parenthesis ( for the CALCULATE function, type SUM followed by another opening parenthesis ( to pass an argument to the SUM function.
Begin typing Sal, and then select Sales[SalesAmount], followed by a closing parenthesis ). This is the first expression argument for our CALCULATE function.
Type a comma (,) followed by a space to specify the first filter, and then type PREVIOUSQUARTER. This will be our filter.
You’ll use the PREVIOUSQUARTER time intelligence function to filter SUM results by the previous quarter.
After the opening parenthesis ( for the PREVIOUSQUARTER function, type Calendar[DateKey].
The PREVIOUSQUARTER function has one argument, a column containing a contiguous range of dates. In our case, that’s the DateKey column in the Calendar table.
Make sure both the arguments being passed to the PREVIOUSQUARTER and the CALCULATE function are closed by typing two closed parentheses )).
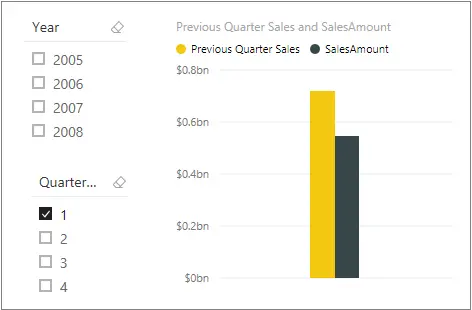
Your formula should now look something like the following;
Previous Quarter Sales = CALCULATE(SUM(Sales[SalesAmount]), PREVIOUSQUARTER(Calendar[DateKey]))
Click the checkmark in the formula bar or press Enter to validate the formula.
Once you’ve added that to your model, voila! You just created a measure using DAX, and not an easy one at that.
What this formula does is calculate the total sales for the previous quarter, depending on the filters applied in a report.
So, let’s if we had to put SalesAmount and our new Previous Quarter Sales measure in a chart, and then added Year and QuarterOfYear as Slicers, we’d get something in the likes of the following;
Now that you have a basic understanding of the concepts in Power BI DAX, you can begin creating DAX formulas for measures on your own. Indeed, it can be a little tricky to learn, but DAX has been around for several years and there are many resources available on the web. After reading through this blog and a little experimentation, you can learn to find business solutions through Power BI DAX. If you wish to build a career in business intelligence, our Business Intelligence Certification Course will help you mine that data and enhance the decision-making processes throughout your organization.
Also, Acquire the in-demand skills and knowledge needed to excel as a Business Analyst in today’s market. Enroll in our Business Analyst Certification Course today and take the first step towards a fulfilling and lucrative career.
Related FAQ
How to rename a column using DAX in Power BI?
How can I use R or Python scripts within Power BI for advanced data analysis?
How can I count the distinct values in a column using Power BI?


 Thank you for registering Join Edureka Meetup community for 100+ Free Webinars each month JOIN MEETUP GROUP