


Advanced Power BI Certification Course with G ...
- 12k Enrolled Learners
- Weekend/Weekday
- Live Class
(4230)


 Copy Link!
Business Intelligence is the process of transforming business data into Information/Knowledge, using computer-based techniques; thus, enabling the users to take effective fact-based decisions. It basically refers to technologies and applications for the collection of business information or data so that organizations can take effective decisions. Today, we have lots of data in different forms in an organization, and the volume is also huge. The information is taken so that organizations can take decisions for growth and the data is transformed for analysis.
Business Intelligence has consistently played an important role in the last few decades. Its primary job is around structured data, which used to be an integrated data warehouse. Datawarehouse is a repository of an organization’s data for query and analysis purposes.
With time and evolving technology, Business Intelligence has evolved to cater to disruptive data growth as the volume of data has increased. Business Intelligence can crunch enormous structured and unstructured data to help identify or create strategic business opportunities.
Business Intelligence essentially is intended for the following 3 things:
The Business Intelligence stack comprises of elements, such as:
ETL: ETL stands for Extract, Transform and Load. It basically involves transferring structures of data from source to data warehouse.
Metadata Management: It is a logical layer between data and involved bus logic.
Analytics and Operational Reporting: It involves the analysis of data through operational reporting.
Dashboard: It gives a snapshot of the organization.
Governance/Monitoring: It involves user role mapping.
Need for Business Intelligence
In today’s growing global competition, the business market poses the following questions to business leaders:
Q: What would be my insightful decision based on the ocean of data? How quickly can I take decisions based on that huge data?
With regard to the volume of data it can handle, one needs a complete end-to-end Business Intelligence solution to address these issues.
Q: How can I integrate heterogeneous data feeds to a common platform to analyze it further?
Basically, an organization can have any kind of source data that can be analyzed. To transform it into a form that can be understandable, we use ETL.
Q: How to interpret raw data in the best possible manner?
In order to interpret raw data or any kind of data, we need analytics and data discovery.
Q: Can I predict the future of my business trajectory?
Yes, through predictive analysis and machine learning.
Q: What is the best way to share the data?
If we want to share information and data with members in the organization, it can be done through visualization and reporting
Q: How can I monitor the dynamics of changing trends?
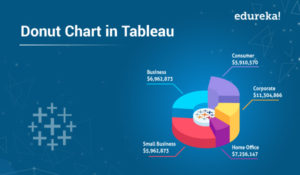
Monitoring trends can be achieved through dashboards, which show graphs and pie-charts.
It can be classified as large BI vendors and new breed.
Large BI Vendors – SAP, IBM, SAS big vendors, which have high processing systems
New Breed – They are basically known for being cost effective and open source with players, like Pentaho, Actuate, Jaspersoft, etc.
Existing Challenges:
Integration Time– time taken in running any module in organization and integrating it through existing BI solution on top of it
Infrastructure and Maintenance Costs– also matter in addressing existing challenges
Licensing Cost- Some of the Big BI vendors charge a lot in terms of licensing, which should also be kept in mind
Single Platform– The necessity of a single platform arises in order to cater to an organization’s BI needs.
Apart from challenges with the existing system, an organization also has issues like volume of data, performance, limited types of reports and dependency on IT for making the reports.
Pentaho is seen as an ideal solution to address these challenges.
![]() It has a low integration time and infrastructural cost as compared to other BI tools in the market, like SAP, BIA, SAS BIA, and IBA. Pentaho takes lesser time on that. There is a huge community support which is available 24/7 along with various support forums. It is easily scalable and can cater to huge volumes of data scaling to billions of terabytes of data.
It has a low integration time and infrastructural cost as compared to other BI tools in the market, like SAP, BIA, SAS BIA, and IBA. Pentaho takes lesser time on that. There is a huge community support which is available 24/7 along with various support forums. It is easily scalable and can cater to huge volumes of data scaling to billions of terabytes of data.
Virtually, it has unlimited visualizations and data sources and can handle any kind of data. The organisations can have any amount of existing or big data and they can be taken care of with Pentaho. All core engines are open and stand-alone projects with their own community and development plan. It also has a very good tool set which has wide applicability beyond just the base product.
There are different versions of Pentaho server, like open source, professional standard, professional premium and enterprise. There are three layers: the presentation layer, which has reporting, analysis, dashboards and process management. Then comes the Business Intelligence platform, which has security, administration, business logic and repository under it. Data and Application Integration has ETL, Metadata and EII under it. This can be built on a third party application like CRM, legacy data, OLAP, other applications and local data.
Pentaho has its presence in all three layers with the respective products- Data layer, server layer and client layer. A server layer has recently regained from BI (Business Intelligence) to BA (Business Analytics). It is now known as Pentaho Business Analytics. It can be extended by commercials as well as open source plug-ins; hence, the data can be published on the server. The user can also run any kind of reports on it. The dashboard can also be displayed and designed. The Pentaho Analyzer is for the Ad-hoc reporting. It runs by default on Apache Tomcat but can be embedded in any java-based application server. Pentaho analyzer is meant for reporting. Scheduling and monitoring is meant for the purpose of scheduling reports, monitoring them and sending them to business users. It comes in two flavours namely Community Edition(CE) and Enterprise Edition(EE).
It shows the transformed data in the form understandable to business users.
Its features involve:
A Pentaho Report Designer (PRD) is a pixel level accurate reporting tool. It is open source and contains rich source of features like having a rich GUI. It is user-friendly and doesn’t consume a beginner’s time . It allows to create relational and analytic reports from a wide range of data sources. One can connect it to any kind of data sources. It supports sub-reports, charts, graphs and API based reporting which can be embedded in any java applications.
The Pentaho reporting engine executes the report designed by PRD. When you design a report in Pentaho, there is a Pentaho reporting engine which runs those reports. Giving a practical feel of it, the toolbar will enable you to develop the report. On the right hand side of the application the properties will enable to set the data. It also has the layout of reporting.
What is ETL?
It is the Extraction of any data source. Here we can transform and load data in datawarehouse. This is Pentaho Data Integration tool. It consists of the following elements:
Data integration server executes jobs and transformations using PDI engine. It has default user and role-based security and can also be integrated with existing LDAP/ Active Directory security provider. Here, we can store the transformations and jobs stored at one common place.
Design Tool (standalone) – It is for designing jobs and transformations
Spoon – GUI Tool to develop all jobs & transformations
Kitchen – Tool to run any job & transformations
Pan – Tool to run just the transformations
Carte – Remote ETL Server
It is a ROLAP server (Relational Online Analytical Processing). It is a based on java and is in the domain of reporting and data warehousing. It is useful when we use for analysis that involves drilling down data. It’s an Open source OLAP(Online Analytical Processing) server and supports MDX(Multi-Dimensional Expression) query language. The Mondrian schema is universal metadata descriptor supported by almost any OLAP client tool.
Here one can create charts containing KPI’s and publish them in a dashboard on BA server to share with broader audience. There are two editions to it namely Community and Enterprise Edition. The Pentaho Dashboard Designer is available only in Enterprise Edition. The Community Dashboard Editor(CDE) is community edition and comes under ctools plugin.The CDE has come to Pentaho after its acquisition of Webdetails. The CDE can be integrated with Pentaho BA server(CE/EE) from the market place. This is based on common framework CDF and it simplifies creation, edition and rendering of CTools dashboards. We can also use custom CSS to get the look and feel as per our discretion.
Pentaho has seen wide usage across industries with some of the big organizations, like Lufthansa.
The Global Aviation company wanted to build a solution to make their core process of InterAirline Through Check-In (IATCI) measurable, accessible and available real-time for operational monitoring through dashboard.
Here, Pentaho is implemented in a stand-alone machine and Pentaho data integration tools are used for transformation. In order to conduct real-time data analysis and report generation, Business Analytics is used, which has a Pentaho BI server also.
It was able to aggregate and feed data into a management cockpit to analyze collected data for key decision-making purposes. By implementing this solution, they have data for analysis in a concise form. Management now receives instant notification of transmission errors, enabling the company to detect patterns on large amounts of data in real-time. The reports are scheduled and sent to business users and the benefit was seen in real-time as being intimated immediately. Partner Airlines also receives alerts in case of transmission errors between different IT systems for passenger data. Lufthansa is able to comprehensively monitor one of its most important core processes in real-time for quality management: the transfer of passenger data between different airlines.
If you’re looking to improve your abilities and learn more about Business Intelligence tools to become certified as a Business Intelligence Professional. Explore the Tableau training or Pentaho BI Training as well as the certification program. Expertly designed by experts and taught by experts This program might be the one you’re hoping to learn.


 Thank you for registering Join Edureka Meetup community for 100+ Free Webinars each month JOIN MEETUP GROUP
is this tutorial still relevant for the latest version of pentaho?