
Advanced Power BI Certification Course with G ...
- 12k Enrolled Learners
- Weekend
- Live Class
(4230)


 Copy Link!
Think about it like this, what if you need a component for your visualization that is not exactly in your dataset? Parameters in Tableau will allow you to provide that value to pass into Tableau.
Tableau is emerging as one of the hottest trends in business intelligence in 2019. Looking at google trends, it seems there can be no better time than “now” to get certified in Tableau.
Parameters in Tableau allow you to use aggregated values that aren’t available in your data and incorporate these values into your dashboard reports. After creation, end users can control the input to see the results of the effect of the parameter.
So, what exactly is a Parameter in Tableau?
Any value passed to a program in order to customize the program for a particular purpose is called a Parameter. It could be anything: A string of text, a range of values, or an amount just to name a few.
Parameters help you experiment with some what-if scenarios. Suppose you are unsure which fields to include in your view or which layout would work best for your viewers. You can incorporate parameters into your view, your charts and graphs to let viewers choose how they want to look at the data.
When you use parameters, you need to tie them to the view in some way:
In calculations and calculated fields that are used in the view.
To display the parameter control in the view for users to select parameters.
To reference parameters in parameter actions.
Just theoretically knowing about this concept wouldn’t do you any good. So, in the next few segments, I shall guide you through the process of creating and using Parameters in Tableau.
You can start out by opening Tableau and connecting to the Superstore Sample DataSet.
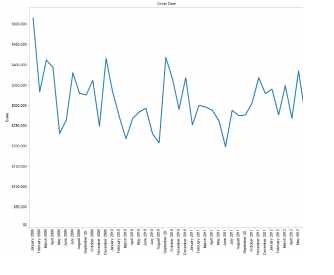
1. Drag Order Date to the Columns Shelf and Sales to the Rows Shelf.
2. Right-Click the Year Pill on the Column Shelf.
3. Go to More > Custom.
4. When the Custom Date dialogue box appears, click on the Month/Year option from the dropdown menu.
You shall end up with a graph along the lines of the following:
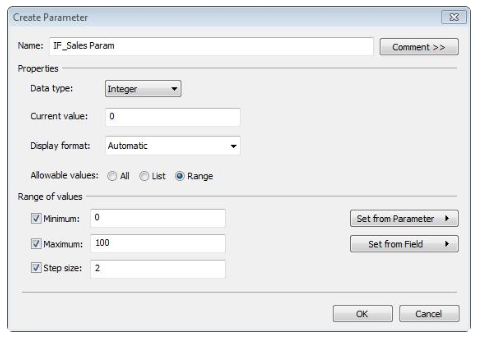
So, the scenario I’m trying to create is a what-if scenario. For example. what if Sales were 3% more.
To create a parameter, do the following;
Now, for this scenario, we now want to use our parameter and some Tableau functions to create a calculated field to add to our graph to see its effect on our data. While still in the Calculated Field dialogue window, create your calculated field:
1. Name your Calculated Field IF_Sales(Calc)
2. Formula: [Sales] * (([IF_Sales Param]/100)+1)
3. Click on OK.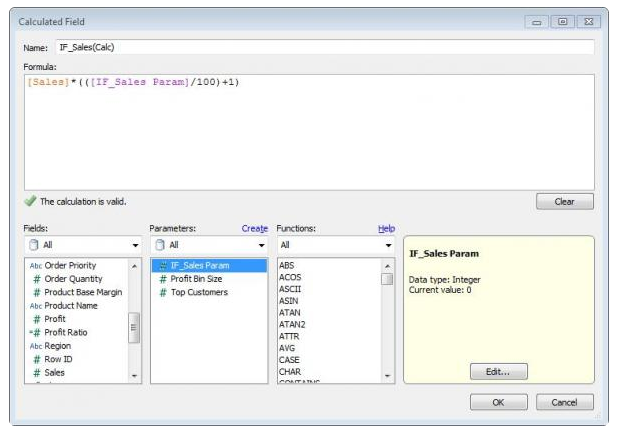 ♠ Notice that in the calculation the parameter we created is going to interact with the Sales Measure.
Coming back to the Tableau main view, you will see your Calculated field in the Measures pane, and the parameter in the Parameters pane of your Data Window.
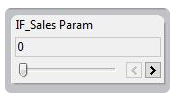
1. Click on the Parameter IF_Sales Param
2. Select Show Parameter Control
3. At the top right of your view, your Parameter Control Filter will be displayed.
1. Drag the Calculated Field IF_Sales(Calc) and drop it on top of your Sales Axis. As you hover over it, you will notice a transparent equal sign.
2. After dropping you will notice Measure Names has now been added to your Colour Shelf, and a Colour Legend is showing both Sales and IF_Sales.
3. Because your Parameter control is at 0, your lines are on top of each other.
4. Click on your Parameter control, and you will see the two lines appear.
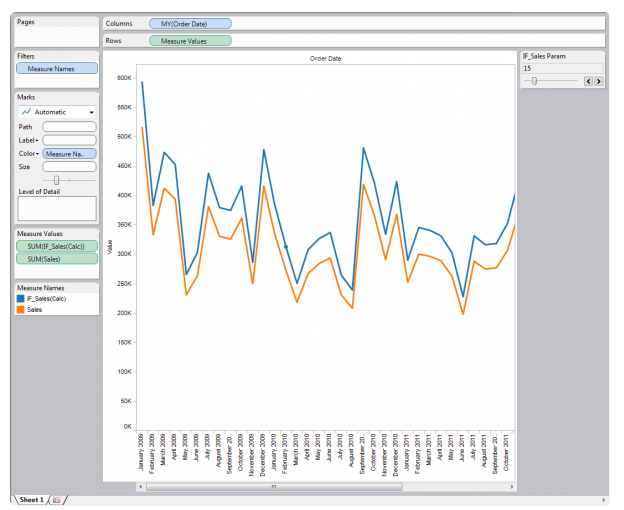
These lines represent the running values of Sales from your dataset and your Calculated Sales simultaneously. And you’ve successfully incorporated your parameter in your visualization!
Parameters are dynamic and useful elements for you to add interactivity and flexibility to a report. It is a versatile tool and can be used in calculations and sets, equally well!
Want to know more about Parameters in Tableau? Or maybe other concepts? Edureka’s Tableau Certification Training is the one for you. It aligned with the Tableau Qualified Associate Level Examination. It is specially curated to help analytics and data professionals create insightful visuals, dashboards, perform scripting, and create Network Diagrams on Tableau to present the data in a much better and insightful manner. The live and interactive course is co-created by industry practitioners and covers critical aspects of data visualization with Tableau, such as conditional formatting, scripting, linking charts, dashboard integration and Tableau integration with R.


 Thank you for registering Join Edureka Meetup community for 100+ Free Webinars each month JOIN MEETUP GROUP