
Advanced DevOps Certification Training with G ...
- 21k Enrolled Learners
- Weekend
- Live Class
(7990)


 Copy Link!
I believe there are very few posts on Nagios, and not much relevant information available over the internet. So, I think this post will give you a good clarity on this Monitoring tool. Nagios monitors your entire IT infrastructure to ensure systems, applications, services, and business processes are functioning properly. It is integral to the DevOps lifecycle and is a must for DevOps Certification. In this Nagios tutorial, I will be covering the below topics:
Let’s begin this Nagios tutorial, by understanding why we need Continuous Monitoring because everything exists for a reason. So, let’s try to find out that reason.
Continuous Monitoring Tools resolve any system errors ( low memory, unreachable server etc. ) before they have any negative impact on your business productivity.
Important reasons to use a monitoring tool are:
Yeah, it does a lot of cool work, but what is it?
Let me first tell you where Continuous Monitoring lies in the DevOps life-cycle, consider the diagram below:
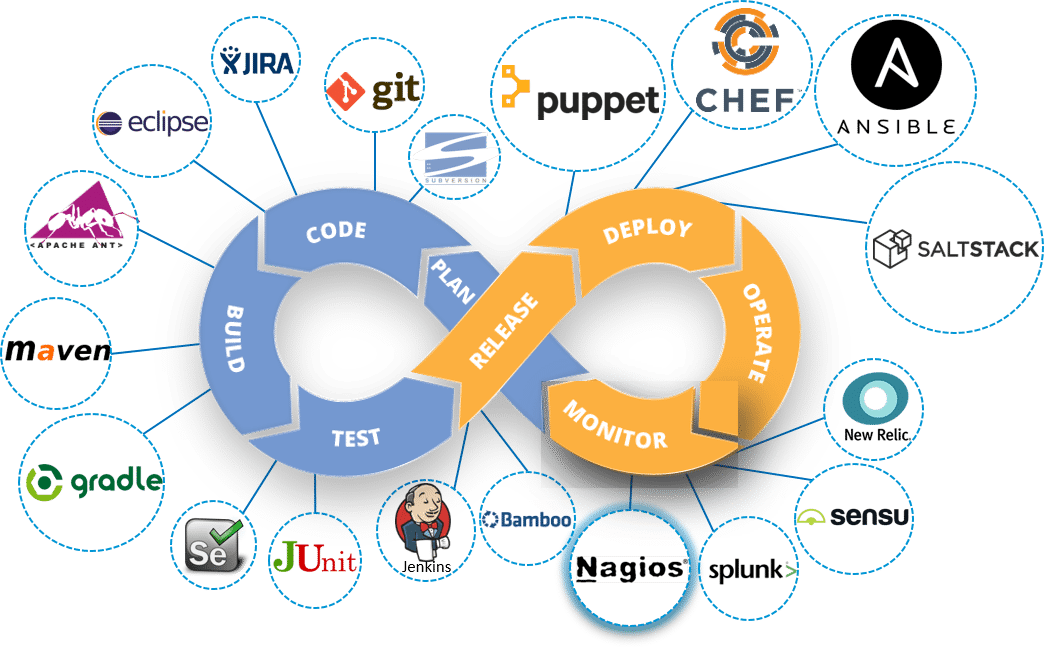
Looking at the diagram you must be thinking this is the last stage in the DevOps lifecycle, but this is not the case. There is no end to a DevOps life cycle, and that is the reason for the infinity symbol. Continuous Monitoring comes into the picture, once the application is deployed on the production servers.
Continuous Monitoring is all about the ability of an organization to detect, report, respond, contain and mitigate the attacks that occur, in its infrastructure.
Continuous Monitoring is actually not new, it’s been around for some time. For years our security professionals are performing static analysis from – system log, firewall logs, IDS logs, IPS logs etc. But, it did not provide proper analysis and response. Today’s Continuous Monitoring approache gives us the ability to aggregate all of the events that I discussed above, co-relate them, compare them and then estimate the organization’s risk posture.
If we take all these pieces and ensure the interlinking between them. This is the crux of Continuous Monitoring.
Let me explain this with a use-case. Consider the diagram below:
 Now, let me explain you the above diagram:
So here, we are Monitoring the events on the on going basis and determining what level of risk we are experiencing. With this, we can correlate the events at the SIEM. We can perform Network Behavior and Anomaly Detection at the ‘Analytics Engine’. This is what Continuous Monitoring is all about:
The integration of an organization security tools, the aggregation, normalization and correlation of the data that is produced by the security tools. The analysis of that data, based on the organization’s risk goals and threat knowledge, and near real-time response to the risks identified.
‘If you can’t measure it you can’t manage it’. I hope you know what I am talking about.
Next up in this Nagios tutorial, I will be introducing you to one of the most famous monitoring tool ‘Nagios’.
Nagios is used for Continuous monitoring of systems, applications, services, and business processes etc in a DevOps culture. In the event of a failure, Nagios can alert technical staff of the problem, allowing them to begin remediation processes before outages affect business processes, end-users, or customers. With Nagios, you don’t have to explain why an unseen infrastructure outage affect your organization’s bottom line.
Let me explain to you how Nagios works. Consider the diagram below:
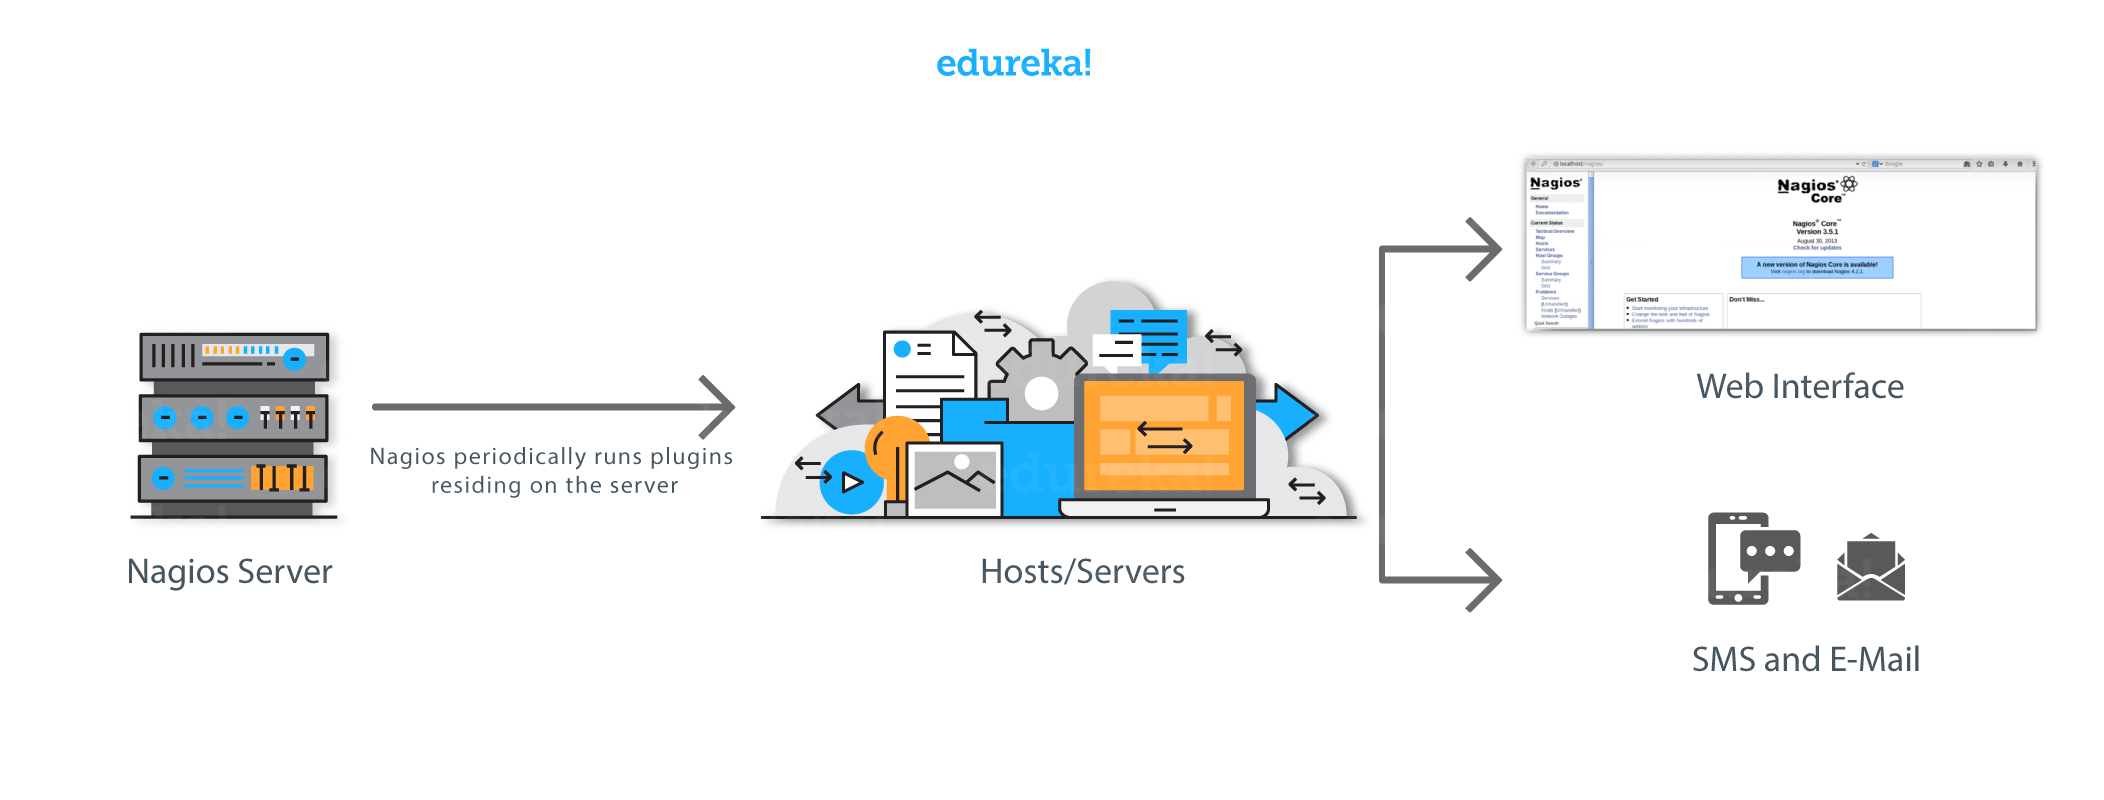 Nagios runs on a server, usually as a daemon or a service.
It periodically runs plugins residing on the same server, they contact hosts or servers on your network or on the internet. One can view the status information using the web interface. You can also receive email or SMS notifications if something happens.
The Nagios daemon behaves like a scheduler that runs certain scripts at certain moments. It stores the results of those scripts and will run other scripts if these results change.
Plugins: These are compiled executables or scripts (Perl scripts, shell scripts, etc.) that can be run from a command line to check the status or a host or service. Nagios uses the results from the plugins to determine the current status of the hosts and services on your network.
Let’s now discuss it’s architecture.

I also need to explain you NRPE (Nagios Remote Plugin Executor).
The NRPE addon is designed to allow you to execute Nagios plugins on remote Linux/Unix machines. The main reason for doing this is to allow Nagios to monitor “local” resources (like CPU load, memory usage, etc.) on remote machines. Since these public resources are not usually exposed to external machines, an agent like NRPE must be installed on the remote Linux/Unix machines.
Consider the diagram below:

Now in this Nagios tutorial, it is time for some Hands-on.
Let’s start by installing Nagios Core
The complete process to install Nagios can be summarized in four steps:
Visit the website: http://dl.fedoraproject.org/pub/epel/6/

Click on i386, and then you will be redirected to a page.

Since I am using CentOS 6, so I will right click and copy the link location of ‘epel-release-6-8.noarch.rpm‘, as shown in the above screenshot.
Open the terminal and use rpm -Uvh command and paste the link.

We need to download one more repository, for that visit the website ‘http://rpms.famillecollet.com/enterprise/‘

Right-click and copy the link location for ‘remi-release-6.rpm‘
Again open the terminal and use rpm -Uvh command and paste the link.

Fine, so we are done with the pre-requisites. Let’s proceed to the next step.
Execute the below command in the terminal:
yum -y install nagios nagios-plugins-all nagios-plugins-nrpe nrpe httpd php
This will install Nagios, Nagios Plugins, Plugins for NRPE, NRPE, Apache and PHP
Apache web server is required to monitor the current web server status.
Php is used to process dynamic content of the site date.

Next, we need to enable Apache and Nagios service:
chkconfig httpd on && chkconfig nagios on

Our next step is to start Nagios and Apache:
service httpd start && service nagios start

Now, I will enable swap memory of at least 1GB. It’s time to create the swap file itself using the dd command:
dd if=/dev/zero of=/swap bs=1024 count=2097152
 Swap is basically used to free some, not so frequently accessed information from RAM, and move it to a specific partition on our hard drive.
Now that you have created the swap partition, use the command mkswap to setup the swap partition. This is going to prepare the swap file by creating a linux swap area.
mkswap /swap
To prevent the file from being world-readable, you should set up the correct permissions on the swap file:
chown root. /swap
chmod 0600 /swap
If you see no errors, your swap space is ready to use. To activate it immediately, type:
swapon /swap

This file will last on the virtual private server until the machine reboots. You can ensure that the swap is permanent by adding it to the fstab file.
echo /swap swap swap defaults 0 0 >> /etc/fstab

The operating system kernel can adjust how often it relies on swap through a configuration parameter known as swappiness.
To find the current swappiness settings, type:
cat /proc/sys/vm/swappiness
Swapiness can be a value from 0 to 100. Swappiness near 100 means that the operating system will swap often and usually, too soon. Although swap provides extra resources, RAM is much faster than swap space. Anytime something is moved from RAM to swap, it slows down.
A swappiness value of 0 means that the operating will only rely on swap when it absolutely needs to. We can adjust the swappiness with the sysctl command. To make your VPS automatically apply this setting every time it boots up, you can add the setting to the /etc/sysctl.conf file:
echo vm.swappiness = 0 >> /etc/sysctl.conf && sysctl -p

Finally, we are done with the second step.
Let’s proceed further and set Nagios password to access the web interface.
Set the password to access the web interface, use the below command:
htpasswd -c /etc/nagios/passwd nagiosadmin
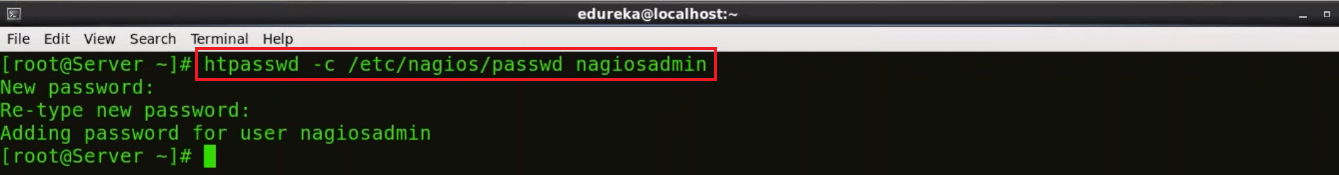
Type the password and confirm it by retyping it.
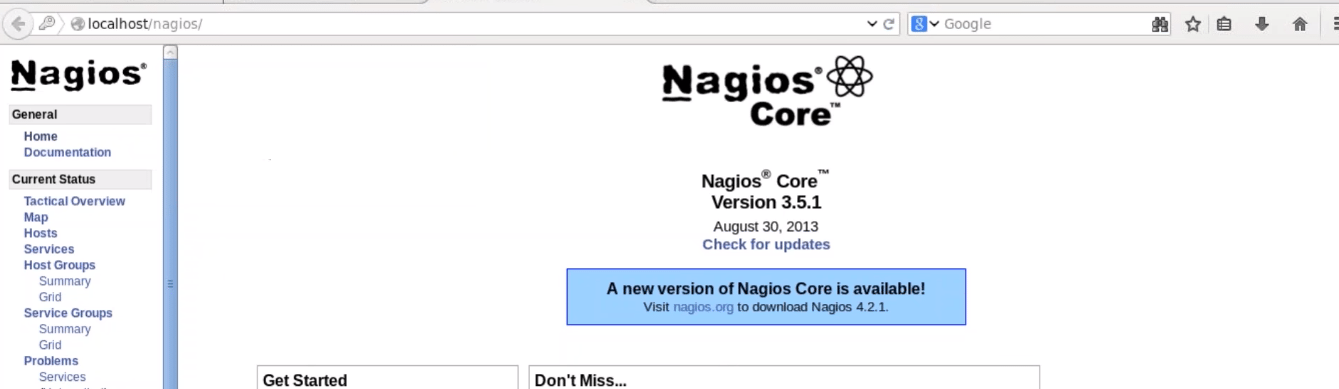
Now, open the browser. Here, type your public IP or hostname/nagios. Consider the example below:

Here, give the user name and password. By default, the user name is nagiosadmin, and password is what you have set in the previous step. Finally, press OK.
After this, you will directed to Nagios Core dashboard.
You can click on hosts and see the what all hosts your Nagios Core is currently monitoring.

You can notice it is only monitoring one host, i.e. localhost. If I want my Nagios Core to monitor a remote host, I need to install NRPE in that remote host. This brings us to the next step, install NRPE In client/machine that you want Nagios to monitor.
Alrighty then, let’s install NRPE in the client machine.
Firstly, you need to install the required packages like I did on my Nagios server machine. So, just execute the same commands, consider the below screenshots:


Now install Nagios, Nagios Plugins and NRPE in client:
yum -y install nagios nagios-plugins-all nrpe

Once it is installed, enable the NRPE service:
chkconfig nrpe on

Our next step is to edit the, nrpe.cfg file. I will be using the vi editor, you can choose any other editor also:

You need to add the IP address of your monitoring server, in the allowed host line, consider the below screenshot:

Here, the IP address of my monitoring server is 192.168.56.101.
Now, we need to setup firewall rules to allow connection between monitoring server and client.
iptables -N NRPE
-A option is used to append the new rule to the end of a chain. If you want to put it somewhere else in the chain, you can use the -I option which allows you to specify the position of the new rule.
The below command accepts tcp requests on ports 5666.
iptables -I INPUT -s 0/0 -p tcp --dport 5666 -j NRPE
iptables -I NRPE -s 192.168.56.101 -j ACCEPT
iptables -A NRPE -s 0/0 -j DROP
This will basically configure iptables to accept packets from a particular host, in my case – 192.168.56.101, and drops the packets from other hosts.
Now, I will save these configurations:
/etc/init.d/iptables save

Start NRPE service now.
service nrpe start

Now go back to the Monitoring server.
Here, I need to edit nagios.cfg file.
vi /etc/nagios/nagios.cfg

Uncomment the the line – cfg_dir = etc/nagios/servers

Make ‘server’ directory, for that use mkdir command.
mkdir /etc/nagios/servers/

Change your working directory to servers.
cd /etc/nagios/servers

Create a new file in this directory with .cfg extension and edit it. I will name it as client.cfg, and I will be using vi editor.
vi /etc/nagios/servers/client.cfg

Here add the below lines:
 This basically includes the kind of services I want to monitor. Give the hostname of the machine and its ip address which you want Nagios to monitor.
Similarly, you can add number of services that you want to monitor. The same configurations can be used to add ‘n’ number of clients.
Last step guys, set the folder permissions correctly and restart Nagios.
chown -R nagios. /etc/nagios/

Now, restart Nagios
service nagios restart

Open the browser and again type the host name or public ip/nagios/. In my case it is localhost/nagios/.

Click on hosts to see all the machines Nagios is currently monitoring.

Here you can notice, it is currently monitoring the client machine (hostname of the machine that I want Nagios to monitor). Basically, we have added a remote host using NRPE.
I hope you have enjoyed reading this Nagios tutorial, I will be coming up with more blogs on Nagios soon.
If you found this Nagios tutorial relevant, check out the DevOps training by Edureka, a trusted online learning company with a network of more than 250,000 satisfied learners spread across the globe. The Edureka DevOps Certification Training course helps learners gain expertise in various DevOps processes and tools such as Puppet, Jenkins, Nagios, Ansible, Chef, Saltstack and GIT for automating multiple steps in SDLC.
Got a question for me? Please mention it in the comments section and I will get back to you.


 Thank you for registering Join Edureka Meetup community for 100+ Free Webinars each month JOIN MEETUP GROUP
If anyone is not from development environment from past then what are the suggestions to proceed further with DEV Ops.