Agentic AI Certification Training Course
- 132k Enrolled Learners
- Weekend/Weekday
- Live Class
(63442)


 Copy Link!
In the world of data analytics, Microsoft Fabric and Tableau stand out as powerful tools, but they have very different strengths. While Microsoft Fabric offers an all-in-one data platform for enterprises deeply integrated with Azure, Tableau focuses on intuitive, high-quality data visualization for users at all levels. This guide compares their features, architecture, pricing, and use cases to help you decide which is the best fit for your data strategy.
Microsoft Fabric is a various data integration, engineering, warehousing, real-time analytics, and business intelligence capabilities into a single software-as-a-service (SaaS) offering by Microsoft Fabric, a unified data platform that the company introduced. Combining services like Power BI, Azure Synapse Analytics, and Azure Data Factory into a unified, collaborative environment aims to streamline the data ecosystem. From scientists and data engineers to business analysts and decision-makers, Fabric serves a wide range of users.
Salesforce created Tableau, a popular tool for business intelligence and data visualization. It lets users create interactive, shareable dashboards and reports from raw data. Tableau is renowned for its user-friendly drag-and-drop interface, support for a wide variety of data sources, and potent visualization features that enable users to gain insights without requiring extensive technical knowledge.
Now that you understand what Tableau and Microsoft Fabric are, let’s move on to Tableau vs. Microsoft Fabric: Features.
| Feature | Microsoft Fabric | Tableau |
| Platform Type | Unified data analytics platform | Specialized data visualization platform |
| Visualization | Integrated Power BI | Advanced, customizable dashboards |
| Data Integration | Built-in with Data Factory and Azure Synapse | Extensive connectors and third-party APIs |
| Storage | OneLake (centralized data lake, Delta format) | External data sources and Tableau Extracts |
| Real-Time Analytics | Yes (via Synapse Real-Time Analytics, Data Activator) | Limited |
| Machine Learning Support | Yes, via Azure Machine Learning integration | Limited, with Python/R integration |
| Collaboration Tools | Deep integration with Microsoft 365 (Teams, Excel) | Shared dashboards and comments in Tableau Server/Online |
| Governance & Security | End-to-end governance with Microsoft Purview integration | Row-level security and permissions controls |
| Deployment Options | SaaS (Microsoft-hosted) | On-premises (Server) and Cloud (Tableau Online) |
| Custom Development Support | Yes (Notebooks, Spark, APIs) | Yes (Extensions, Web Data Connectors, APIs) |
| Best For | Organizations seeking full-stack analytics in the Microsoft ecosystem | Teams needing rich, interactive visualizations |
Microsoft Fabric is designed with a Lake House architecture. This brings together the storage capabilities of data lakes with the management features of data warehouses. It features both physical and logical layers. The logical layers are a storage layer and a compute layer, which form the foundation for the services built on top of them.
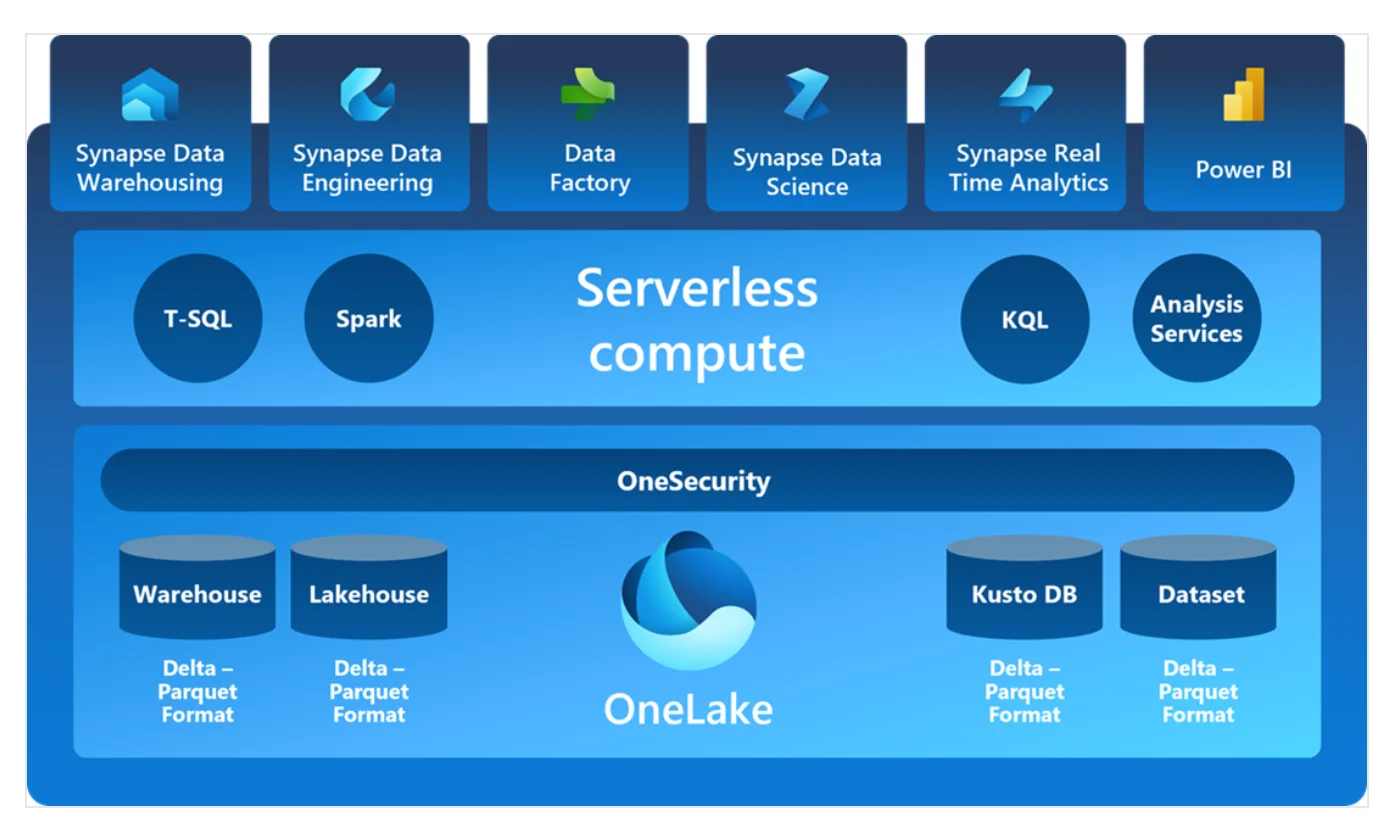
Business intelligence and real-time analytics are backed by a common platform that guarantees strong data security, governance, and compliance.
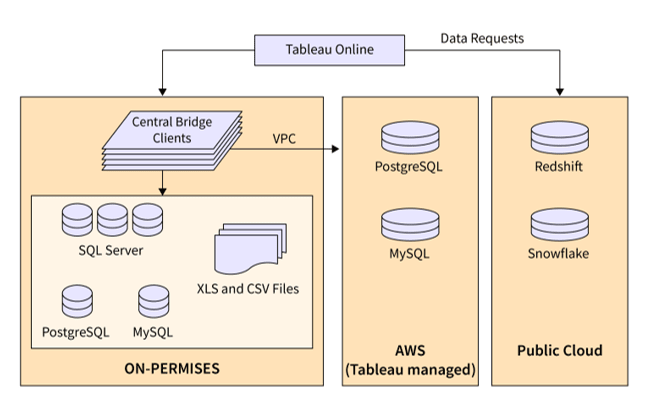
The architecture of Tableau consists of:
Tableau can be used in a variety of settings. Tableau Server can be installed on-site, in a data center or private cloud, or on cloud computing platforms such as Microsoft Azure, Google Cloud Platform, and Amazon EC2.
The following section compares Tableau and Microsoft Fabric and explains their main use cases.
Next, we’ll discuss a thorough pricing comparison between Tableau and Microsoft Fabric.
In line with Azure pricing models, Microsoft Fabric provides capacity-based pricing through Microsoft Fabric SKUs. It consists of:
Three main roles are involved in Tableau pricing, which is user-based:
For enterprise deployment, Tableau also provides Tableau Cloud or Tableau Server.
We’ll talk about Microsoft Fabric vs. Tableau later. Which is better for you? and Conclusion
Your company’s data requirements will determine whether to use Tableau or Microsoft Fabric. Microsoft Fabric is a better option if you need a single, scalable platform for the whole data lifecycle, particularly inside the Microsoft ecosystem. It manages everything from ingestion to visualization, enforces governance, and optimizes workflows.
However, Tableau is a strong stand-alone tool if your goal is to easily create engaging, interactive dashboards and your current infrastructure supports it. For teams concentrating on ad hoc analysis and data storytelling without requiring extensive integration, Tableau is perfect.
Tableau and Microsoft Fabric have distinct but occasionally related purposes. For Azure users, in particular, Microsoft Fabric is excellent at offering a complete data analytics platform. Tableau excels at both user-friendliness and visualization. The best option ultimately depends on your unique use cases, technical specifications, and current toolchains.
Better is a relative term; Tableau is better for deep visualization, while Microsoft Fabric (through Power BI) is better for end-to-end analytics.
Microsoft Fabric is a comprehensive data analytics platform that integrates data ingestion, processing, and visualization; Salesforce is a CRM platform with analytics tools like Tableau.
Tableau is a stand-alone BI tool, while SAP is an integrated enterprise resource planning system with analytics. Decide if you require focused analytics or ERP.
This blog examines the essential elements of Microsoft Fabric. This unified platform helps businesses quickly and accurately transform raw data into actionable insights by integrating data integration, engineering, storage, real-time analytics, and visualization into a single environment.
To boost your data career, Edureka offers two top certifications: Microsoft Fabric Data Engineer Associate (DP-700), covering OneLake, data pipelines, and performance tuning, and Tableau Certification Training, focused on data visualization and dashboarding using tools like Prep Builder and Desktop. Both programs feature hands-on projects and real-world scenarios to prepare you for high-demand roles in data engineering and BI.
Do you have any questions or need further information? Feel free to leave a comment below, and we’ll respond as soon as possible!