
Artificial Intelligence Certification Course
- 23k Enrolled Learners
- Weekend
- Live Class
(6100)


 Copy Link!
Machine learning is the present and the future! From Netflix’s recommendation engine to Google’s self-driving car, it’s all machine learning. This blog on Machine Learning with R helps you understand the core concepts of machine learning followed by different machine learning algorithms and implementing those machine learning algorithms with R.
This blog on “Machine Learning with R” comprises of these sections:


How do you know all of those are fish?
As a kid, you might have come across a picture of a fish and you would have been told by your kindergarten teachers or parents that this is a fish and it has some specific features associated with it like it has fins, gills, a pair of eyes, a tail and so on. Now, whenever your brain comes across an image with those set of features, it automatically registers it as a fish because your brain has learned that it is a fish. You can even check out the details of successful Spark developer with the Pyspark certification course.
That’s how our brain functions but what about a machine? If the same image is fed to a machine, how will the machine identify it to be a fish?

This is where Machine Learning comes in. We’ll keep on feeding images of a fish to a computer with the tag “fish” until the machine learns all the features associated with a fish.

Once the machine learns all the features associated with a fish, we will feed it new data to determine how much has it learned.

In other words, Raw Data/Training Data is given to the machine, so that it learns all the features associated with the Training Data. Once, the learning is done, it is given New Data/Test Data to determine how well the machine has learned.
Let us move ahead in this Machine Learning with R blog and understand about types of Machine Learning.
Supervised Learning algorithm learns from a known data-set(Training Data) which has labels to make predictions.

Regression and Classification are some examples of Supervised Learning.
Classification determines to which set of categories does a new observation belongs i.e. a classification algorithm learns all the features and labels of the training data and when new data is given to it, it has to assign labels to the new observations depending on what it has learned from the training data.

For this example, if the first observation is given the label “Man” then it is rightly classified but if it is given the label “Woman”, the classification is wrong. Similarly for the second observation, if the label given is “Woman”, it is rightly classified, else the classification is wrong.
Regression is a supervised learning algorithm which helps in determining how does one variable influence another variable.

Over here, “living_area” is the independent variable and “price” is the dependent variable i.e. we are determining how does “price” vary with respect to “living_area”.
Unsupervised learning algorithm draws inferences from data which does not have labels.

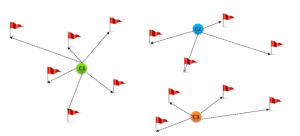
Clustering is an example of unsupervised learning. “K-means”, “Hierarchical”, “Fuzzy C-Means” are some examples of clustering algorithms.

In this example, the set of observations is divided into two clusters. Clustering is done on the basis of similarity between the observations. There is a high intra-cluster similarity and low inter-cluster similarity i.e. there is a very high similarity between all the buses but low similarity between the buses and cars.
Reinforcement Learning is a type of machine learning algorithm where the machine/agent in an environment learns ideal behavior in order to maximize its performance. Simple reward feedback is required for the agent to learn its behavior, this is known as the reinforcement signal.

Let’s take pacman for example. As long as pacman keeps eating food, it earns points but when it crashes against a monster it loses it’s life. Thus pacman learns that it needs to eat more food and avoid monsters so as to improve it’s performance.
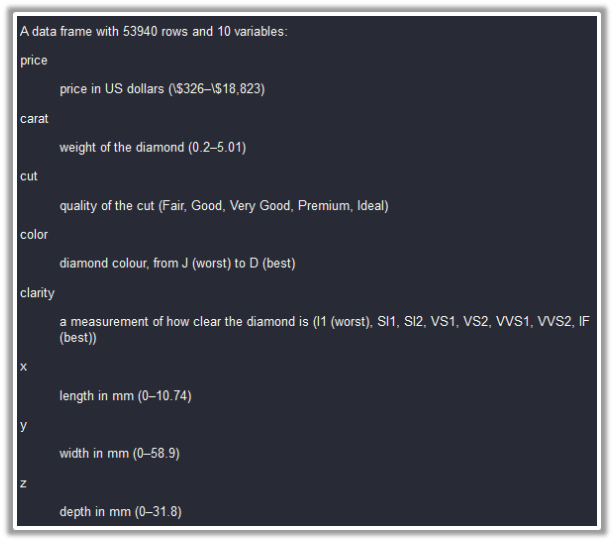
We’ll be working with the diamonds data-set to implement linear regression algorithm:

Description of the data-set:
Prior to building any model on the data, we are supposed to split the data into “train” and “test” sets. The model will be built on the “train” set and it’s accuracy will be checked on the “test” set.
We need to load the “caTools” package to split the data into two sets.
library(caTools)“caTools” package provides a function “sample.split()” which helps in splitting the data.
sample.split(diamonds$price,SplitRatio = 0.65)->split_index65% of the observations from price column have been assigned the “true” label and the rest 35% have been assigned “false” label.
subset(diamonds,split_index==T)->train
subset(diamonds,split_index==F)->test
All the observations which have “true” label have been stored in the “train” object and those observations having “false” label have been assigned to the “test” set.
Now that the splitting is done and we have our “train” and “test” sets, it’s time to build the linear regression model on the training set.
We’ll be using the “lm()” function to build the linear regression model on the “train” data. We are determining the price of the diamonds with respect to all other variables of the data-set. The built model is stored in the object “mod_regress”.
lm(price~.,data = train)->mod_regress Now, that we have built the model, we need to make predictions on the “test” set. “predict()” function is used to get predictions. It takes two arguments: the built model and the test set. The predicted results are stored in the “result_regress” object.
predict(mod_regress,test)->result_regressLet’s bind the actual price values from the “test” data-set and the predicted values into a single data-set using the “cbind()” function. The new data-frame is stored in “Final_Data”
cbind(Actual=test$price,Predicted=result_regress)->Final_Data as.data.frame(Final_Data)->Final_DataA glance at the “Final_Data” which comprises of actual values and predicted values:

Let’s find the error by subtracting the predicted values from the actual values and add this error as a new column to the “Final_Data”:
(Final_Data$Actual- Final_Data$Predicted)->errorcbind(Final_Data,error)->Final_DataA glance at the “Final_Data” which also comprises of the error in prediction:

Now, we’ll go ahead and calculate “Root Mean Square Error” which gives an aggregate error for all the predictions
rmse1<-sqrt(mean(Final_Data$error^2)) rmse1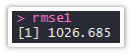
Going ahead, let’s build another model, so that we can compare the accuracy of both these models and determine which is a better one.
We’ll build a new linear regression model on the “train” set but this time, we’ll be dropping the ‘x’ and ‘y’ columns from the independent variables i.e. the “price” of the diamonds is determined by all the columns except ‘x’ and ‘y’.
The model built is stored in “mod_regress2”:
lm(price~.-y-z,data = train)->mod_regress2The predicted results are stored in “result_regress2”
predict(mod_regress2,test)->result_regress2Actual and Predicted values are combined and stored in “Final_Data2”:
cbind(Actual=test$price,Predicted=result_regress2)->Final_Data2 as.data.frame(Final_Data2)->Final_Data2Let’s also add the error in prediction to “Final_Data2”
(Final_Data2$Actual- Final_Data2$Predicted)->error2cbind(Final_Data2,error2)->Final_Data2A glance at “Final_Data2”:
Finding Root Mean Square Error to get the aggregate error:
rmse2<-sqrt(mean(Final_Data2$error^2))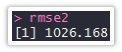
We see that “rmse2” is marginally less than “rmse1” and hence the second model is marginally better than the first model.
We’ll be working with the “car_purchase” data-set to implement recursive partitioning which is a classification algorithm.

Let’s split the data into “train” and “test” sets using “sample.split()” function from “caTools” package.
library(caTools)65% of the observations from ‘Purchased’ column will be assigned “TRUE” labels and the rest will be assigned “FALSE” labels.
sample.split(car_purchase$Purchased,SplitRatio = 0.65)->split_valuesAll those observations which have “TRUE” label will be stored into ‘train’ data and those observations having “FALSE” label will be assigned to ‘test’ data.
subset(car_purchase,split_values==T)->train_datasubset(car_purchase,split_values==F)->test_dataTime to build the Recursive Partitioning algorithm:
We’ll start off by loading the ‘rpart’ package:
library(rpart)“Purchased” column will be the dependent variable and all other columns are the independent variables i.e. we are determining whether the person has bought the car or not with respect to all other columns. The model is built on the “train_data” and the result is stored in “mod1”.
rpart(Purchased~.,data = train_data)->mod1Let’s plot the result:
plot(mod1,margin = 0.1)text(mod1,pretty = T,cex=0.8)

Now, let’s go ahead and predict the results on “test_data”. We are giving the built rpart model “mod1” as the first argument, the test set “test_data” as the second argument and prediction type as “class” for the third argument. The result is stored in ‘result1’ object.
predict(mod1,test_data,type = "class")->result1Let’s evaluate the accuracy of the model using “confusionMatrix()” function from caret package.
library(caret)confusionMatrix(table(test_data$Purchased,result1))

The confusion matrix tells us that out of the 90 observations where the person did not buy the car, 79 observations have been rightly classified as “No” and 11 have been wrongly classified as “YES”. Similarly, out of the 50 observations where the person actually bought the car, 47 have been rightly classified as “YES” and 3 have been wrongly classified as “NO”.
We can find the accuracy of the model by dividing the correct predictions with total predictions i.e. (79+47)/(79+47+11+3).
We’ll work with “iris” data-set to implement k-means clustering:

Let’s remove the “Species” column and create a new data-set which comprises only the first four columns from the ‘iris’ data-set.
iris[1:4]->iris_kLet us take the number of clusters to be 3. “Kmeans()” function takes the input data and the number of clusters in which the data is to be clustered. The syntax is : kmeans( data, k) where k is the number of cluster centers.
kmeans(iris_k,3)->k1Analyzing the clustering:
str(k1)
The str() function gives the structure of the kmeans which includes various parameters like withinss, betweenss, etc, analyzing which you can find out the performance of kmeans.
betweenss : Between sum of squares i.e. Intracluster similarity
withinss : Within sum of square i.e. Intercluster similarity
totwithinss : Sum of all the withinss of all the clusters i.e.Total intra-cluster similarity
A good clustering will have a lower value of “tot.withinss” and higher value of “betweenss” which depends on the number of clusters ‘k’ chosen initially.
The time is ripe to become an expert in Machine Learning to take advantage of new opportunities that come your way. This brings us to the end of this “Machine Learning with R” blog. I hope this blog was informative fruitful. If you’re interested in gaining expertise, Machine Learning Training program can help you acquire the necessary skills and knowledge.
Edureka has a specially curated Data Science with R Course which helps you gain expertise in Machine Learning Algorithms like K-Means Clustering, Decision Trees, Random Forest, Naive Bayes. You’ll learn the concepts of Statistics, Time Series, Text Mining and an introduction to Deep Learning as well. New batches for this course are starting soon!!


 Thank you for registering Join Edureka Meetup community for 100+ Free Webinars each month JOIN MEETUP GROUP


hey can i get the dataset?
Hey, Where or how I can install the dataset of car_purchase?
Hi ,
your blog is very good and easy to understand.
can u please send me or give me the link of above classification data set (car_purchase).
Thanks
Purushottam
Hey Purushottam, mention your email address and we will send it over. Cheers :)
purushottam.login@gmail.com