
Data Science with Python Certification Course
- 132k Enrolled Learners
- Weekend
- Live Class
(49300)


 Copy Link!
Logistic regression in Python is a predictive analysis technique. It is also used in Machine Learning for binary classification problems. In this blog we will go through the following topics to understand logistic regression in Python:
🐍 Ready to Unleash the Power of Python? Sign Up for Edureka’s Comprehensive Python Certification Course Online with access to hundreds of Python learning Modules and 24/7 technical support.
You may also refer this detailed tutorial on logistic regression in python with a demonstration for a better understanding or go through the certified python training to master logistic regression.
Regression analysis is a powerful statistical analysis technique. A dependent variable of our interest is used to predict the values of other independent variables in a data-set.
We come across regression in an intuitive way all the time. Like predicting the weather using the data-set of the weather conditions in the past.
It uses many techniques to analyse and predict the outcome, but the emphasis is mainly on relationship between dependent variable and one or more independent variable.
Logistic regression analysis predicts the outcome in a binary variable which has only two possible outcomes.
It is a technique to analyse a data-set which has a dependent variable and one or more independent variables to predict the outcome in a binary variable, meaning it will have only two outcomes.
The dependent variable is categorical in nature. Dependent variable is also referred as target variable and the independent variables are called the predictors.
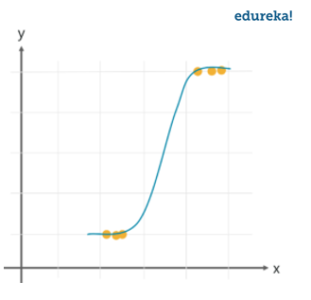
Logistic regression is a special case of linear regression where we only predict the outcome in a categorical variable. It predicts the probability of the event using the log function.
We use the Sigmoid function/curve to predict the categorical value. The threshold value decides the outcome(win/lose).
Linear regression equation: y = β0 + β1X1 + β2X2 …. + βnXn
Sigmoid function: p = 1 / 1 + e-y
Apply sigmoid function on the linear regression equation.
Logistic Regression equation: p = 1 / 1 + e-(β0 + β1X1 + β2X2 …. + βnXn)
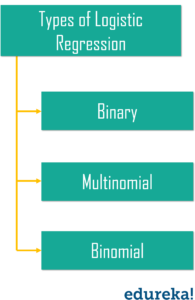
Lets take a look at different types of logistic regression.

While linear regression can have infinite possible values, logistic regression has definite outcomes.
Linear regression is used when the response variable is continuous in nature, but logistic regression is used when the response variable is categorical in nature.
Predicting a defaulter in a bank using the transaction details in the past is an example of logistic regression, while a continuous output like a stock market score is an example of linear regression.
Following are the use cases where we can use logistic regression.
Weather predictions are the result of logical regression. Here, we analyse the data of the previous weather reports and predict the possible outcome for a specific day. But logical regression would only predict categorical data, like if its going to rain or not.
We can use logical regression with the help of the medical history of the patient to predict if the illness is positive or negative in any case.
Lets take a sample data-set to build a prediction model using logistic regression.
We are going to build a prediction model using logical regression in Python with the help of a dataset, in this we are going to cover the following steps to achieve logical regression.
Collecting Data
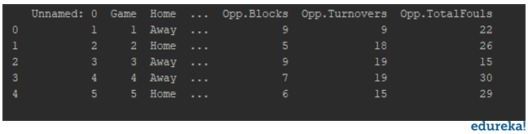
The very first step for implementing the logistic regression is to collect the data. We will load the csv file containing the data-set into the programs using the pandas. We are using the NBA data for building the prediction model to predict the possibility of a home game or away game, by analyzing the relationship between the relevant data.
import pandas as pd
import numpy as np
import seaborn as sns
import matplotlib.pyplot as plt

df = pd.read_csv(r'C:UsersMohammadWaseemDocumentsdata.csv')
print(df.head(5))
You will get all the data into a readable format for easier analysis. And then you can determine the dependent and independent variables for your model.
Analyzing Data
The data-set is analyzed to determine the relationship between the variables. By creating different plots to check the relationship between the variables.
sns.countplot('Home', hue='WINorLOSS', data=df)
plt.show()
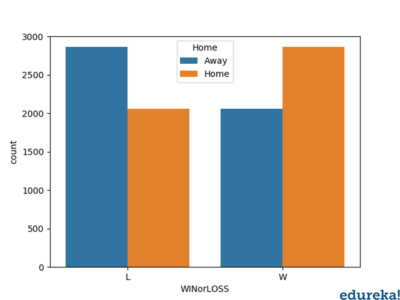
Above is the relationship between the win/lose percentage in respect to the home/away game. Similarly we can plot the graph of relationship between other relevant entries in the data.
Data Wrangling
The data-set is modified according to the target variable. We will eliminate all the null values and the string values as well from the DataFrame.
print(df.isnull().sum())
We will check for all the irrelevant data like null values and the values which will not be required while building the prediction model. If there are no null values in the NBA dataset that we are using, we will proceed with splitting the data.
Test and Train Data
For the performance of the model the data is split into the test data and train data. The data is split using the train_test_split. The data here is split in the ratio 70:30.
Now, for the model prediction the logistic regression function is implemented by importing the logistic regression model in the sklearn module.
The model is then fit on the train set using the fit function. After this the prediction is performed using the prediction function.
from sklearn.model_selection import train_test_split
from sklearn.linear_model import LogisticRegression
from sklearn.metrics import classification_report
from sklearn.metrics import confusion_matrix,accuracy_score

x = df.drop('Home', axis=1)
y = df['Home']
x_train, x_test, y_train, y_test = train_test_split(x, y, test_size=0.33, random_state=1)
logmodel = LogisticRegression()
logmodel.fit(x_train, y_train)

predictions = logmodel.predict(x_test)
print(classification_report(y_test, predictions))
print(confusion_matrix(y_test, predictions))
print(accuracy_score(y_test, predictions))
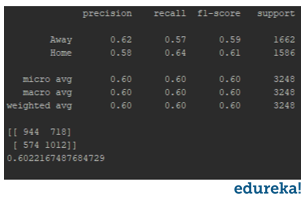
Classification Report:
The classification report displays the Precision, Recall , F1 and Support scores for the model.
Precision score means the the level up-to which the prediction made by the model is precise. The precision for a home game is 0.62 and for the away game is 0.58.
Recall is the amount up-to which the model can predict the outcome. Recall for a home game is 0.57 and for a away game is 0.64. F1 and Support scores are the amount of data tested for the predictions. In the NBA data-set the data tested for home game is 1662 and for the away game is 1586.
Confusion matrix:
Confusion matrix is a table which describes the performance of a prediction model. A confusion matrix contains the actual values and predicted values. we can use these values to calculate the accuracy score of the model.
Confusion matrix heatmap:
Lets plot a heat-map of the confusion matrix using seaborn and matplotlib to visualize the prediction model that we have built. To plot a heatmap, the following syntax is necessary.
sns.heatmap(pd.DataFrame(confusion_matrix(y_test,predictions)))
plt.show()

By looking at the heatmap, we can conclude the following:
With this analysis of the confusion matrix we can conclude the accuracy score for our prediction model.
Accuracy score:
Accuracy score is the percentage of accuracy of the predictions made by the model. For our model the accuracy score is 0.60, which is considerably quite accurate. But the more the accuracy score the efficient is you prediction model. You must always aim for a higher accuracy score for a better prediction model.
By following the steps discussed above, we have predicted the possibility of a home/away game using the NBA dataset. After analyzing the classification report we can assume the possibility of a home/away game.
In this blog we have discussed the logistic regression in python concepts, how it is different from the linear approach. Also, we have covered a demonstration using the NBA Dataset. For more insight and practice, you can use a dataset of your choice and follow the steps discussed to implement logistic regression in Python.
Also, checkout the various Data-Science blogs on edureka platform to master the data scientist in you.


 Thank you for registering Join Edureka Meetup community for 100+ Free Webinars each month JOIN MEETUP GROUP