
Advanced DevOps Certification Training with G ...
- 25k Enrolled Learners
- Weekend
- Live Class
(7990)


 Copy Link!
In this article, you will learn how to publish Kubernetes cluster events data to Amazon Elastic Search using Fluentd logging agent. The data will then be viewed using Kibana, an open-source visualization tool for Elasticsearch. Amazon ES consists of integrated Kibana integration.
We will walk you through with the following process:
Kubernetes is an open source platform created by Google to manage containerized applications. it enables you to manage, scale and deploy your containerized apps in a clustered environment. We can orchestrate our containers across various hosts with Kubernetes, scale the containerized apps with all resources on the fly, and have a centralized container management environment.
We will start with creating Kubernetes cluster and I’ll demonstrate you step by step, on how to install and configure Kubernetes on CentOS 7.
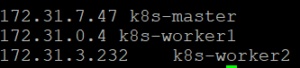
1.Configure Hosts
2. Disable SELinux by executing below commands
3. Enable br_netfilter Kernel Module
4. Disable SWAP by running below commands.
![]()
5. Install the latest version of Docker CE. Install the package dependencies for docker-ce by running below commands.
6. Install Kubernetes
[kubernetes]

name=Kubernetes
baseurl=https://packages.cloud.google.com/yum/repos/kubernetes-el7-x86_64
enabled=1
gpgcheck=1
repo_gpgcheck=1
gpgkey=https://packages.cloud.google.com/yum/doc/yum-key.gpg
       https://packages.cloud.google.com/yum/doc/rpm-package-key.gpg
EOF
After the installation is complete, restart all those servers. After restart start the services docker and kubelet

https://raw.githubusercontent.com/coreos/flannel/master/Documentation/kube-flannel.yml

9. Adding Nodes to the clusterConnect to the node01 server and run the kubeadm join command
Connect to the node02 server and run the kubeadm join command
Wait for some time and Validate the ‘k8s-master’ master cluster server, check the nodes and pods using the following command.

Now you will get worker1 and worker2 has been added to the cluster with status ‘ready’.

Kubernetes cluster master initialization and configuration has been completed.
Elasticsearch is an open source search and analytics engine which is used for log analysis and real-time monitoring of applications. Amazon Elasticsearch Service (Amazon ES) is an AWS service that allows the deployment, operation, and scale of Elasticsearch in the AWS cloud. You can use Amazon ES to analyze email sending events from your Amazon SES
We will create an Amazon ES cluster and then Deploy Fluentd logging agent to Kubernetes cluster which will collect logs and send to Amazon ES cluster
This section shows how to use the Amazon ES console to create an Amazon ES cluster.
To create an Amazon ES cluster

 Under Kibana authentication: – Do not enable this option.
Note: The cluster will take up to ten minutes to deploy. Take note of your Kibana URL once you click the elastic search domain created.
Fluentd is an open source data collector, which lets you unify the data collection and consumption for better use and understanding of data. In this case, we will deploy Fluentd logging on Kubernetes cluster, which will collect the log files and send to the Amazon Elastic Search.
We will create a ClusterRole which provides permissions on pods and namespace objects to make get, list and watch request to cluster.
First, we need to configure RBAC (role-based access control) permissions so that Fluentd can access the appropriate components.
1.fluentd-rbac.yaml:
apiVersion: v1
kind: ServiceAccount
metadata:
  name: fluentd
  namespace: kube-system

---

apiVersion: rbac.authorization.k8s.io/v1beta1
kind: ClusterRole
metadata:
  name: fluentd
  namespace: kube-system
rules:
- apiGroups:
  - ""
  resources:
  - pods
  - namespaces
  verbs:
  - get
  - list
  - watch

---

kind: ClusterRoleBinding
apiVersion: rbac.authorization.k8s.io/v1beta1
metadata:
  name: fluentd
roleRef:
  kind: ClusterRole
  name: fluentd
  apiGroup: rbac.authorization.k8s.io
subjects:
- kind: ServiceAccount
  name: fluentd
  namespace: kube-system
Create: $ kubectl create -f kubernetes/fluentd-rbac.yaml
Now, we can create the DaemonSet.
2. fluentd-daemonset.yaml
apiVersion: extensions/v1beta1
kind: DaemonSet
metadata:
  name: fluentd
  namespace: kube-system
  labels:
    k8s-app: fluentd-logging
    version: v1
    kubernetes.io/cluster-service: "true"
spec:
  template:
    metadata:
      labels:
        k8s-app: fluentd-logging
        version: v1
        kubernetes.io/cluster-service: "true"
    spec:
      serviceAccount: fluentd
      serviceAccountName: fluentd
      tolerations:
      - key: node-role.kubernetes.io/master
        effect: NoSchedule
      containers:
      - name: fluentd
        image: fluent/fluentd-kubernetes-daemonset:v1.3-debian-elasticsearch
        env:
          - name:  FLUENT_ELASTICSEARCH_HOST
            value: "elasticsearch.logging"
          - name:  FLUENT_ELASTICSEARCH_PORT
            value: "9200"
          - name: FLUENT_ELASTICSEARCH_SCHEME
            value: "http"
          - name: FLUENT_UID
            value: "0"
        resources:
          limits:
            memory: 200Mi
          requests:
            cpu: 100m
            memory: 200Mi
        volumeMounts:
        - name: varlog
          mountPath: /var/log
        - name: varlibdockercontainers
          mountPath: /var/lib/docker/containers
          readOnly: true
      terminationGracePeriodSeconds: 30
      volumes:
      - name: varlog
        hostPath:
          path: /var/log
      - name: varlibdockercontainers
        hostPath:
          path: /var/lib/docker/containers
Make sure to define FLUENT_ELASTICSEARCH_HOST & FLUENT_ELASTICSEARCH_PORT according to your elastic search environment
Deploy:
$ kubectl create -f kubernetes/fluentd-daemonset.yaml

$ kubectl logs fluentd-lwbt6 -n kube-system | grep Connection
You should see that Fluentd connect to Elasticsearch within the logs:


7. And Apply Changes
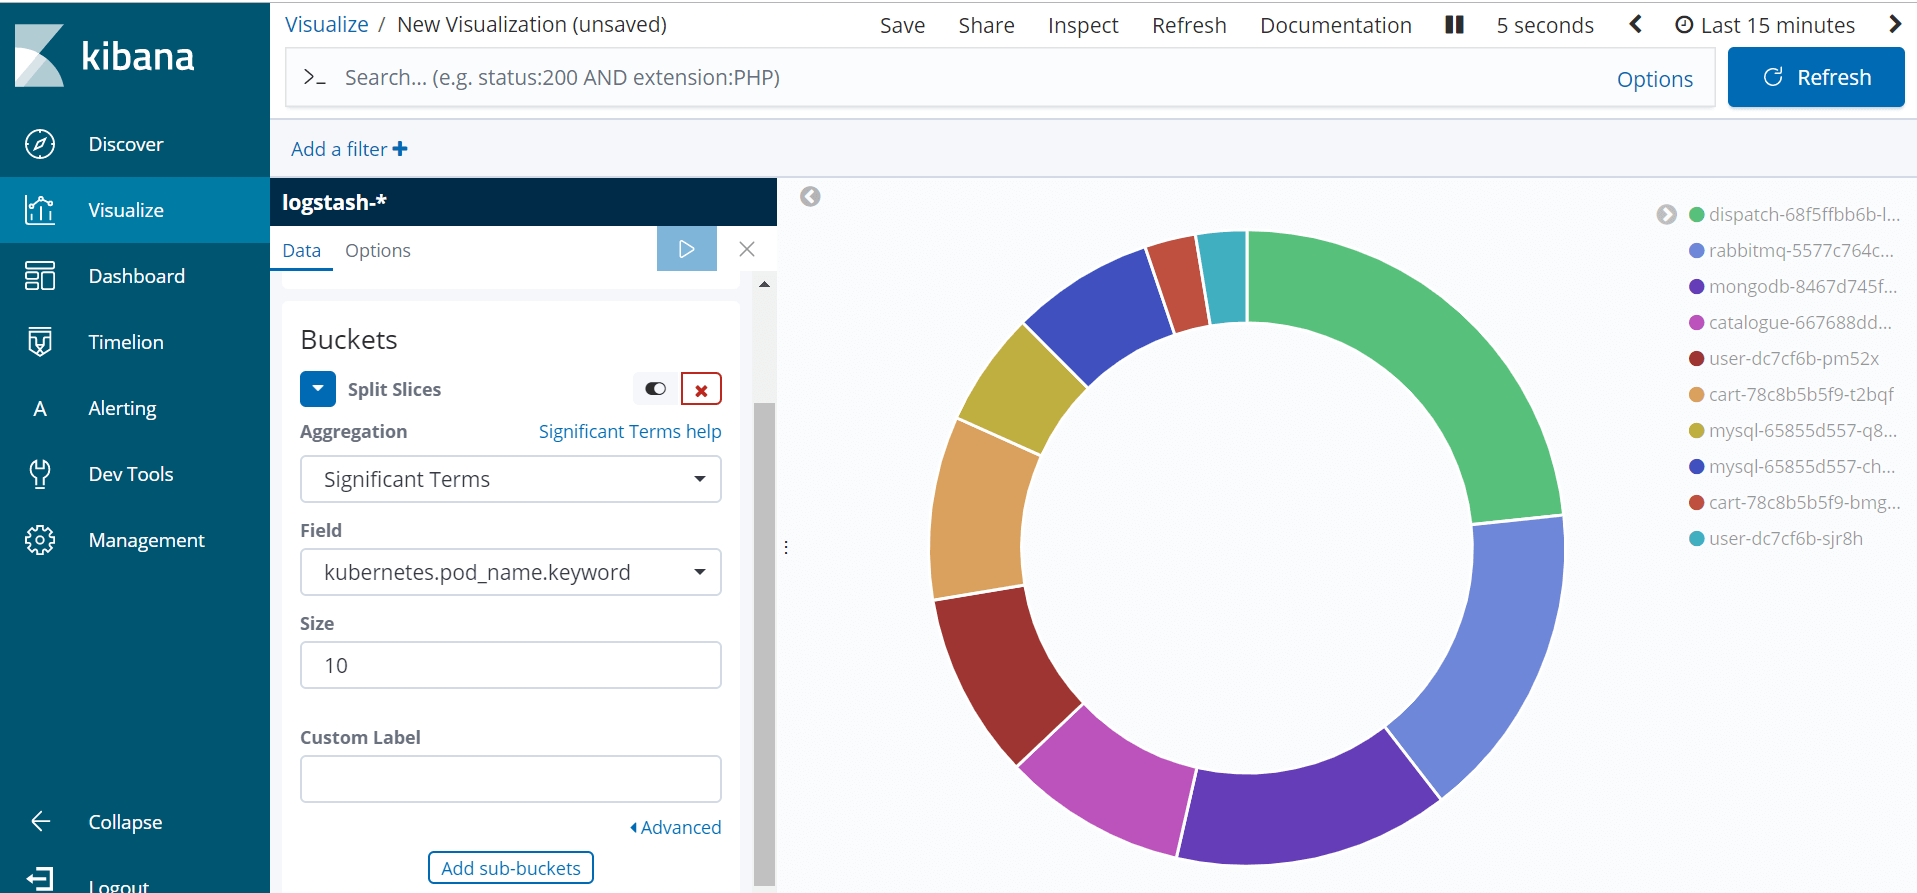
That’s it! This is how you can visualize the Kubernetes Pod created in Kibana.
Summary:
Monitoring by log analysis is a critical component of any application deployment. You can gather and consolidate logs across your cluster in Kubernetes to monitor the whole cluster from one single dashboard. In our example, we have seen fluentd act as a mediator between kubernetes cluster and Amazon ES. Fluentd combines log collection and aggregation and sends logs to Amazon ES for log analytics and data visualization with kibana.
The above example shows how to add AWS Elastic search logging and kibana monitoring to kubernetes cluster using fluentd.
If you found this Kubernetes blog relevant, check out the Kubernetes Certification Training by Edureka, a trusted online learning company with a network of more than 250,000 satisfied learners spread across the globe.
Got a question for us? Please mention it in the comments section and we will get back to you or join our Kubernetes Training in Australia today.


 Thank you for registering Join Edureka Meetup community for 100+ Free Webinars each month JOIN MEETUP GROUP