It is important to ensure delivery of a quality software product. Thus, the engineers involved in testing the product, adopt various testing approaches. It is required to ensure that the application runs without any failures. This article on “Load Testing using JMeter” will provide in-depth knowledge about a load testing tool for analyzing and measuring the performance in the following sequence:
- What is Load Testing?
- Tools used for Load Testing
- What is JMeter?
- Advantages of Jmeter
- Elements of JMeter
- Load Testing using JMeter (non-GUI mode)
- Report generation on Dashboard
What is Load Testing?
Load Testing is a type of Performance Testing that determines the performance of the system under real life conditions. It examines how the system behaves during normal and high loads and determines if a system, piece of software, or computing device can handle high loads given a high demand of end users.

Load Testing is used to identify the following :
- The maximum operating capacity of an application
- Determine whether the current infrastructure is sufficient to run the application
- Sustainability of application with respect to peak user load
- Number of concurrent users that an application can support, and scalability to allow more users to access it.
Tools used for Load Testing
Performance testing is significant in real time, particularly from a point of view of customer satisfaction. There are several performance testing tools available such as:
- Apache JMeter
- LoadRunner
- WebLOAD
- LoadUI
- LoadView
- NeoLoad
Apache JMeter is one of the most preferred tools for performing testing. Let’s move ahead with our “Load Testing using JMeter”article and have a look at all the advantages of JMeter.
What is JMeter?
Apache JMeter is a testing tool used for analyzing and measuring the performance of different software services and products. It is a pure Java open source software used for testing Web Application or FTP application.

It is used to execute performance testing, load testing and functional testing of web applications. JMeter can also simulate a heavy load on a server by creating tons of virtual concurrent users to web server.
Advantages of JMeter
Apache JMeter open source software fills a big void by making the testing process easy. Some of the advantages of JMeter include:

Open-source – JMeter is an open source software. This means that it can be downloaded free of cost. It is also a 100% pure Java application. The developer can use its source code, can modify and customize it as per their requirement.

User-friendly – JMeter has a comprehensive GUI, which helps to create test plan and configure the elements. Adding elements is also easy. You just have to right-click on the tree scenario and add what you need to do.

Support – Basically it is designed for performance testing, but also supports other non-functional tests such as Stress Testing, Distributed Testing, Web service testing, etc by creating test plans.

Comprehensive Documentation – This is one of the most important things to be highlighted. Because of its robust documentation, user can have a clear idea on each and every step, starting from scratch including installation and configuration of the test settings and generating final report.

Recording – JMeter allows user to record HTTP/HTTPS to create Test plan using Recording facility. We use Proxy Server that allows JMeter to watch and record your actions while you browse your web application with your normal browser.

Reporting – JMeter supports dashboard report generation. A host of reports are generated through JMeter which helps the user to understand Performance test execution results.
You can refer to the JMeter Tutorial to know about the steps involved in the installation process of the testing tool and have a look at the different elements that are used while performing any test.
Elements of JMeter
The different components of JMeter are called Elements. Each Element is designed for a specific purpose. Some of the main elements are :
- Thread Group – Thread Groups is a collection of Threads. Each thread represents one user using the application under test. It simulates one real user request to the server. The controls for a thread group also allow you to set the number of threads for each group.
- Samplers – JMeter supports testing HTTP, FTP, JDBC and many more protocols.Thread Groups simulate user request to the server. Samplers help the Thread Group to know which type of requests it needs to make.
- Listeners – Listeners show the results of the test execution. They can show results in a different format such as a tree, table, graph or log file.
- Configuration – Configuration Elements are used to set up defaults and variables for later use by samplers.
Now all the above elements are already explained in detail in the JMeter Tutorial. In this Load Testing using JMeter, there is another new element that is required for performing the test in non-GUI mode.
Assertion
Assertion in JMeter is used to validate response of the request, that you have sent to the server. Assertion is a process where you verify expected result with the actual result of the request at run time. If you need to apply assertion on a particular Sampler, then add it as a child of that Sampler.
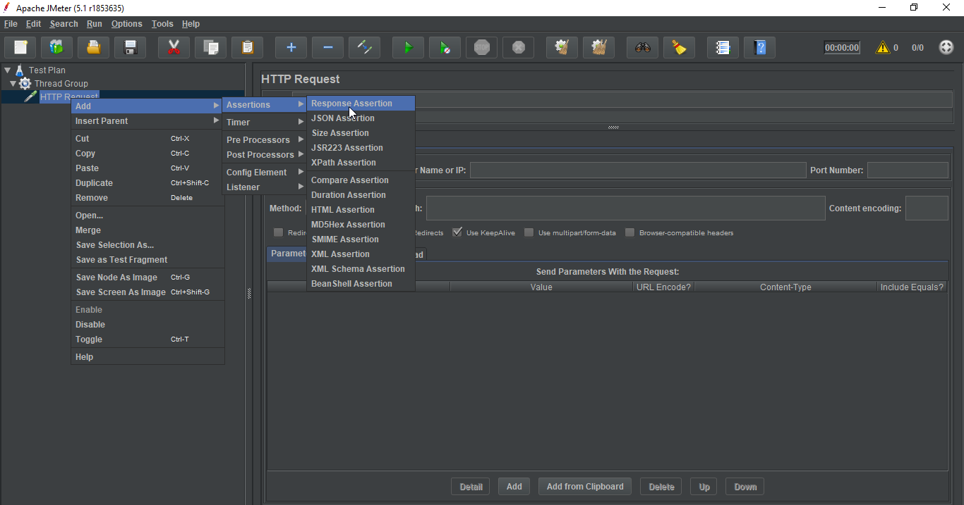
If you need to apply assertion on a particular Sampler, then add it as a child of that Sampler. You can view assertion results by adding “Assertion Listener” to the Thread Group.
- Response Assertion – Response Assertion can be used to add and compare pattern strings against one or many values of server response. For Example, when you send a request to the URL: https://www.google.com and get the server response, you can verify this by using Response Assertion.
Load Testing using JMeter (non-GUI mode)
Before knowing the steps of performing a test in non-GUI mode, let’s see why do we prefer the non-GUI mode :
- GUI consumes more resources or memory
- GUI is not recommended for heavy load testing
- Command line can be integrated with other systems
Now let’s have a look at the steps involved in load testing using JMeter with the command prompt.
- Step 1 – First you have to create a test plan in the user interface of JMeter.

- Step 2 – Next step is to add thread groups and specify the number of threads or users and loop count.

- Step 3 – Once the thread group is created, next step is to add the HTTP Request and specify the server name and path. Now save your Test Plan in any folder.

The command to run the Test Plan in the command prompt is as follows :
jmeter -n -t Userssundush_nDownloadspache-jmeter-5.1inLoadTestedureka.jmx -l Userssundush_nDownloadspache-jmeter-5.1inLoadTestloadtest.csv

Where,
-n -> non-GUI mode
-t -> Location for jmeter test script
-l -> Location of the result file
- Now once you have run the test from the command prompt, it will store the result in loadtest.csv file.
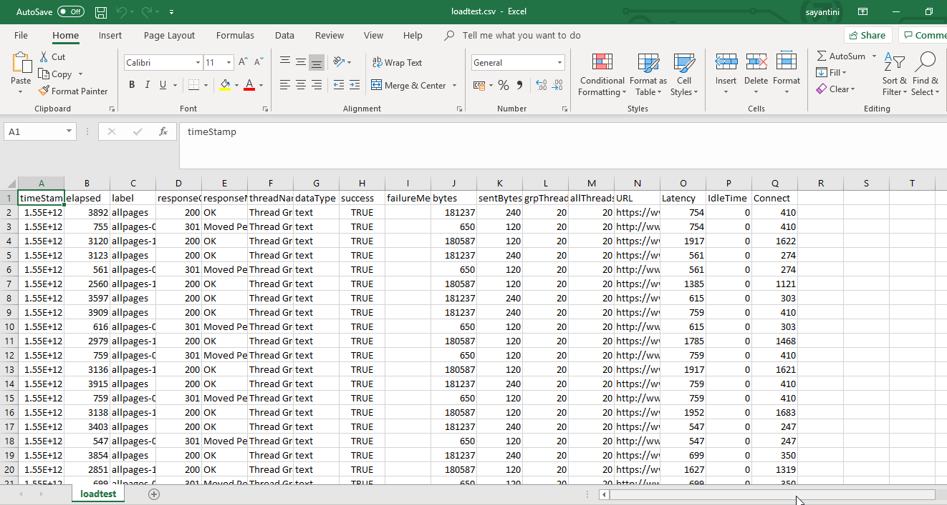
These were the steps involved in performing a test through command prompt. Now let’s move ahead with our “Load Testing using JMeter” article and see how to generate a report on dashboard.
Report Generation on Dashboard
JMeter supports dashboard report generation to get graphs and statistics from a test plan. The dashboard generator is a modular extension of JMeter. Its default behavior is to read and process samples from CSV files to generate HTML files containing graph views. It can generate the report at end of a load test or on demand.
The command to generate report on Dashboard is:
jmeter -n -t Userssundush_nDownloadspache-jmeter-5.1inLoadTest edureka.jmx -l Userssundush_nDownloadspache-jmeter-5.1inLoadTestloadtest.csv -e -o Userssundush_nDownloadspache-jmeter-5.1inLoadTestHTMLreport
Where,
-e -> To generate HTML Reports
-o -> Location of the Output folder

This Report provides the following metrics:
- APDEX (Application Performance Index) table computes for every transaction based on configurable values for tolerated and satisfied thresholds:

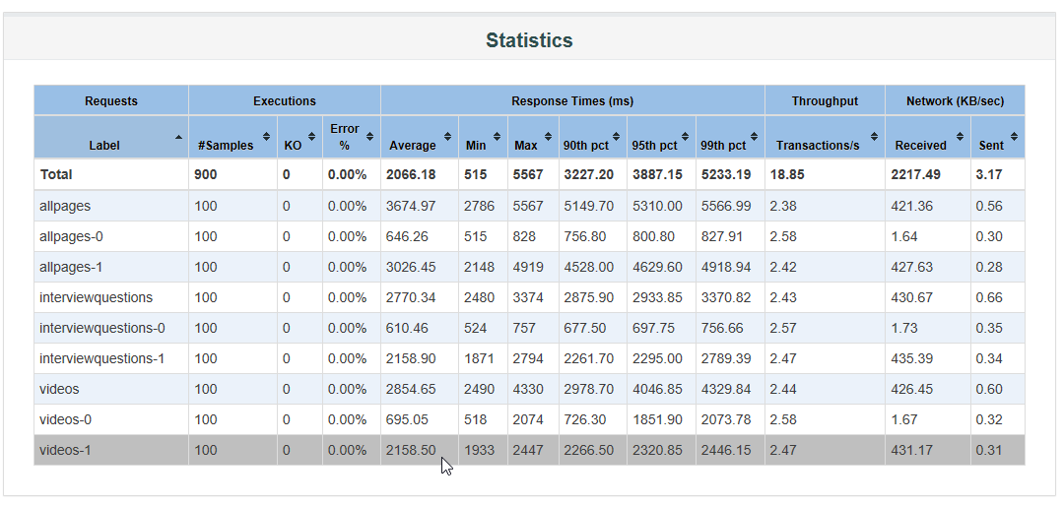
- A Statistics table providing in one table a summary of all metrics per transaction including 3 configurable percentiles:
- Response times Over Time which includes Transaction Controller Sample Results:

- Response times Percentiles Over Time which include successful responses only:

- Active Threads Over Time :

- Latencies Over Time:

- Response Time Percentiles which includes Transaction Controller Sample Results:

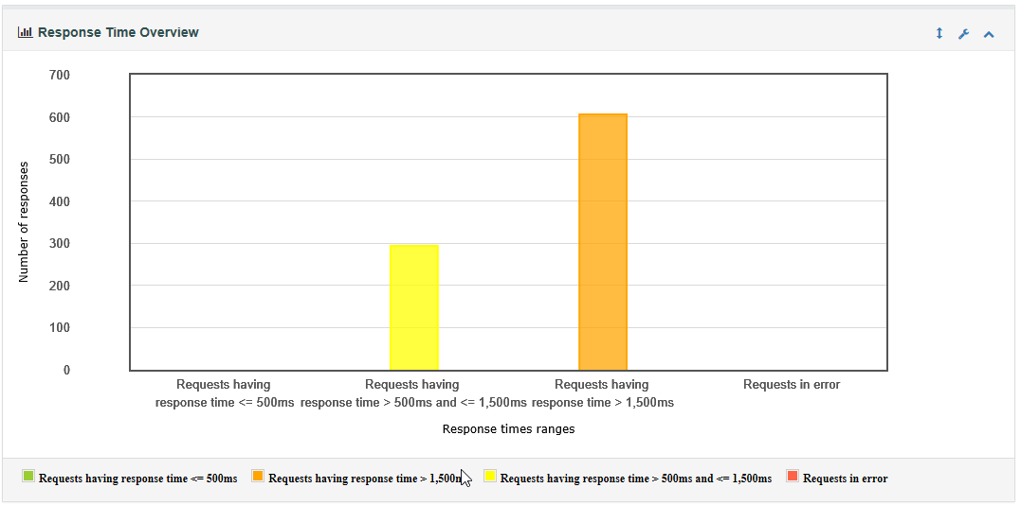
- Response Time Overview which excludes Transaction Controller Sample Results:
- Times vs Threads:

- Response Time Distribution:

Here is a video on Load Testing using JMeter that will provide you step-by-step guide on how to perform testing using the command prompt and generate a report on dashboard!
Load Testing Using JMeter | Edureka
This video on Load Testing using JMeter will provide you with in-depth knowledge about the load testing tool and how it performs in the non-GUI mode.
Now with this, we come to an end to this Load Testing using JMeter article. I Hope you guys enjoyed this article and understood how to perform testing in non-GUI mode and generate a report on the dashboard.
Now that you have understood how JMeter works, check out the Performance Testing Course by Edureka, a trusted online learning company with a network of more than 250,000 satisfied learners spread across the globe. This course provides you insights into software behavior during workload. In this course, you will learn how to check the response time and latency of software and test if a software package is efficient for scaling. The course will help you check the strength and analyze the overall performance of an application under different load types. Got a question for us? Please mention it in the comments section of “Load Testing using JMeter” and we will get back to you.