Data Science with Python Certification Course
- 132k Enrolled Learners
- Weekend
- Live Class
(49300)


 Copy Link!
What is Linear Regression?
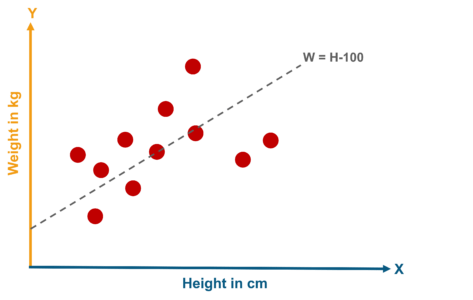
A linear regression is one of the easiest statistical models in machine learning. Understanding its algorithm is a crucial part of the Data Science Python Certification’s course curriculum. It is used to show the linear relationship between a dependent variable and one or more independent variables.
🐍 Ready to Unleash the Power of Python? Sign Up for Edureka’s Comprehensive Python Certification with access to hundreds of Python learning Modules and 24/7 technical support.
Before we drill down to linear regression in depth, let me just give you a quick overview of what is a regression as Linear Regression is one of a type of Regression algorithm
Linear Regression
Logistic Regression
Polynomial Regression
Stepwise Regression
| Basis | Linear Regression | Logistic Regression |
| Core Concept | The data is modelled using a straight line | The data is modelled using a sigmoid |
| Used with | Continuous Variable | Categorical Variable |
| Output/Prediction | Value of the variable | Probability of occurrence of an event |
| Accuracy and Goodness of Fit | Measured by loss, R squared, Adjusted R squared etc. | Measured by Accuracy, Precision, Recall, F1 score, ROC curve, Confusion Matrix, etc |

Linear regressions can be used in business to evaluate trends and make estimates or forecasts.
For example, if a company’s sales have increased steadily every month for the past few years, conducting a linear analysis on the sales data with monthly sales on the y-axis and time on the x-axis would produce a line that that depicts the upward trend in sales. After creating the trend line, the company could use the slope of the line to forecast sales in future months.

Linear regression can also be used to analyze the effect of pricing on consumer behaviour.
For example, if a company changes the price on a certain product several times, it can record the quantity it sells for each price level and then performs a linear regression with quantity sold as the dependent variable and price as the explanatory variable. The result would be a line that depicts the extent to which consumers reduce their consumption of the product as prices increase, which could help guide future pricing decisions.
3. Assessing Risk

Linear regression can be used to analyze risk.
For example
A health insurance company might conduct a linear regression plotting number of claims per customer against age and discover that older customers tend to make more health insurance claims. The results of such an analysis might guide important business decisions made to account for risk.
Linear Regression Algorithm | Linear Regression in Python | Edureka
This Linear Regression Algorithm video is designed in a way that you learn about the algorithm in depth.
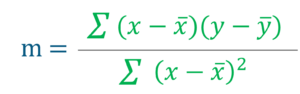
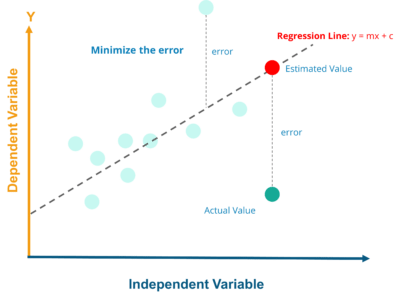
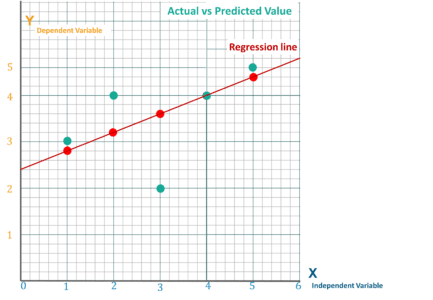
Regression Line, y = mx+c where,
y = Dependent Variable
x= Independent Variable ; c = y-Intercept
For the implementation part, I will be using a dataset consisting of head size and brain weight of different people.
# Importing Necessary Libraries

%matplotlib inline
import numpy as np
import pandas as pd
import matplotlib.pyplot as plt
plt.rcParams['figure.figsize'] = (20.0, 10.0)

# Reading Data
data = pd.read_csv('headbrain.csv')
print(data.shape)
data.head()


# Collecting X and Y
X = data['Head Size(cm^3)'].values
Y = data['Brain Weight(grams)'].values
In order to find the value of m and c, you first need to calculate the mean of X and Y
# Mean X and Y
mean_x = np.mean(X)
mean_y = np.mean(Y)

# Total number of values
n = len(X)

# Using the formula to calculate m and c
numer = 0
denom = 0
for i in range(n):
numer += (X[i] - mean_x) * (Y[i] - mean_y)
denom += (X[i] - mean_x) ** 2
m = numer / denom
c = mean_y - (m * mean_x)

# Print coefficients
print(m, c)
The value of m and c from above will be added to this equation
BrainWeight = c + m ∗ HeadSize
Now that we have the equation of the line. So for each actual value of x, we will find the predicted values of y. Once we get the points we can plot them over and create the Linear Regression Line,
# Plotting Values and Regression Line
max_x = np.max(X) + 100
min_x = np.min(X) - 100
# Calculating line values x and y
x = np.linspace(min_x, max_x, 1000)
y = c + m * x

# Ploting Line
plt.plot(x, y, color='#52b920', label='Regression Line')
# Ploting Scatter Points
plt.scatter(X, Y, c='#ef4423', label='Scatter Plot')

plt.xlabel('Head Size in cm3')
plt.ylabel('Brain Weight in grams')
plt.legend()
plt.show()
R–squared value is the statistical measure to show how close the data are to the fitted regression line
y = actual value
y ̅ = mean value of y
yp = predicted value of y
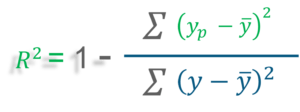
R-squared does not indicate whether a regression model is adequate. You can have a low R-squared value for a good model, or a high R-squared value for a model that does not fit the data!
#ss_t is the total sum of squares and ss_r is the total sum of squares of residuals(relate them to the formula).
ss_t = 0
ss_r = 0
for i in range(m):
y_pred = c + m * X[i]
ss_t += (Y[i] - mean_y) ** 2
ss_r += (Y[i] - y_pred) ** 2
r2 = 1 - (ss_r/ss_t)
print(r2)
If you have reached up here, I assume now you have a good understanding of Linear Regression Algorithm using Least Square Method. Now its time that I tell you about how you can simplify things and implement the same model using a Machine Learning Library called scikit-learn
from sklearn.linear_model import LinearRegression
from sklearn.metrics import mean_squared_error

# Cannot use Rank 1 matrix in scikit learn
X = X.reshape((m, 1))
# Creating Model
reg = LinearRegression()
# Fitting training data
reg = reg.fit(X, Y)
# Y Prediction
Y_pred = reg.predict(X)

# Calculating R2 Score
r2_score = reg.score(X, Y)

print(r2_score)
This was all about the Linear regression Algorithm using python. In case you are still left with a query, don’t hesitate in adding your doubt to the blog’s comment section.


 Thank you for registering Join Edureka Meetup community for 100+ Free Webinars each month JOIN MEETUP GROUP
Nice Article