Advanced Certification in Agentic AI Engineer ...
- 66k Enrolled Learners
- Weekend
- Live Class
(45931)


 Copy Link!
The focus of supervised learning revolves around the input and output variables using an algorithm to predict the outcome. If a new input variable comes into the picture. The linear regression algorithm in machine learning is a supervised learning technique to approximate the mapping function to get the best predictions. In this article, we will learn about linear regression for machine learning.
Machine Learning Course lets you master the application of AI with the expert guidance. It includes various algorithms with applications.
The following topics are discussed in this blog.
The main goal of regression is the construction of an efficient model to predict the dependent attributes from a bunch of attribute variables. A regression problem is when the output variable is either real or a continuous value i.e salary, weight, area, etc.
We can also define regression as a statistical means that is used in applications like housing, investing, etc. It is used to predict the relationship between a dependent variable and a bunch of independent variables. Let us take a look at various types of regression techniques.

The following are types of regression.
One of the most interesting and common regression technique is simple linear regression. In this, we predict the outcome of a dependent variable based on the independent variables, the relationship between the variables is linear. Hence, the word linear regression.
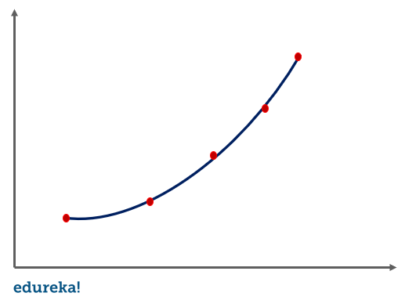
In this regression technique, we transform the original features into polynomial features of a given degree and then perform regression on it.
For support vector machine regression or SVR, we identify a hyperplane with maximum margin such that the maximum number of data points are within those margins. It is quite similar to the support vector machine classification algorithm.
A decision tree can be used for both regression and classification. In the case of regression, we use the ID3 algorithm(Iterative Dichotomiser 3) to identify the splitting node by reducing the standard deviation.
In random forest regression, we ensemble the predictions of several decision tree regressions. Now that we know about different types of regression let us take a look at simple linear regression in detail.
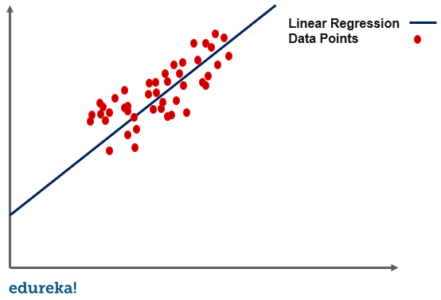
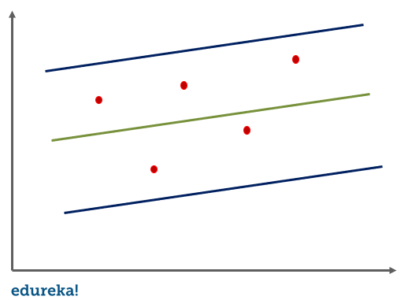
Simple linear regression is a regression technique in which the independent variable has a linear relationship with the dependent variable. The straight line in the diagram is the best fit line. The main goal of the simple linear regression is to consider the given data points and plot the best fit line to fit the model in the best way possible.
Before moving on to how the linear regression algorithm works, let us take a look at a few important terminologies in simple linear regression.
The following terminologies are important to be familiar with before moving on to the linear regression algorithm.
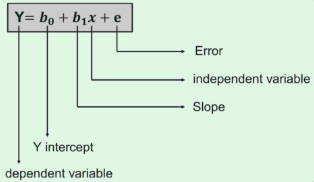
The best fit line can be based on the linear equation given below.
The cost function provides the best possible values for b0 and b1 to make the best fit line for the data points. We do it by converting this problem into a minimization problem to get the best values for b0 and b1. The error is minimized in this problem between the actual value and the predicted value.
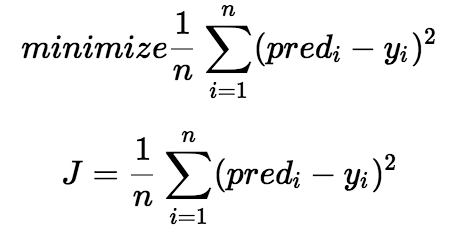
We choose the function above to minimize the error. We square the error difference and sum the error over all data points, the division between the total number of data points. Then, the produced value provides the averaged square error over all data points.
It is also known as MSE(Mean Squared Error), and we change the values of b0 and b1 so that the MSE value is settled at the minimum.
The next important terminology to understand linear regression is gradient descent. It is a method of updating b0 and b1 values to reduce the MSE. The idea behind this is to keep iterating the b0 and b1 values until we reduce the MSE to the minimum.
To update b0 and b1, we take gradients from the cost function. To find these gradients, we take partial derivatives with respect to b0 and b1. These partial derivatives are the gradients and are used to update the values of b0 and b1.
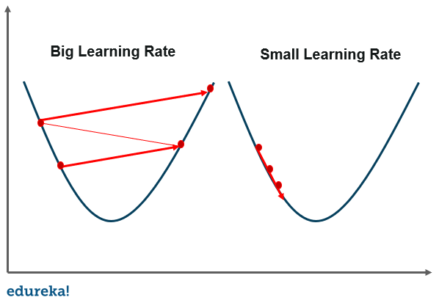 A smaller learning rate takes closer to the minimum, but it takes more time and in case of a larger learning rate. The time taken is sooner but there is a chance to overshoot the minimum value. Now that we are through with the terminologies in linear regression, let us take a look at a few advantages and disadvantages of linear regression for machine learning.
Transform yourself into a highly skilled professional and land a high-paying job with the Artificial Intelligence Course.
Sales Forecasting
Risk Analysis
Housing Applications To Predict the prices and other factors
Finance Applications To Predict Stock prices, investment evaluation, etc.
The basic idea behind linear regression is to find the relationship between the dependent and independent variables. It is used to get the best fitting line that would predict the outcome with the least error. We can use linear regression in simple real-life situations, like predicting the SAT scores with regard to the number of hours of study and other decisive factors.
With this in mind, let us take a look at a use case.
The process takes place in the following steps:
Let us get into the details of each of the steps to implement linear regression.
1. Loading The Data
We can start with the basic diabetes data set that is already present in the sklearn(scikit-learn) data sets module to begin our journey with linear regression.
from sklearn import datasets

disease = datasets.load_diabetes()
print(disease)
Output: 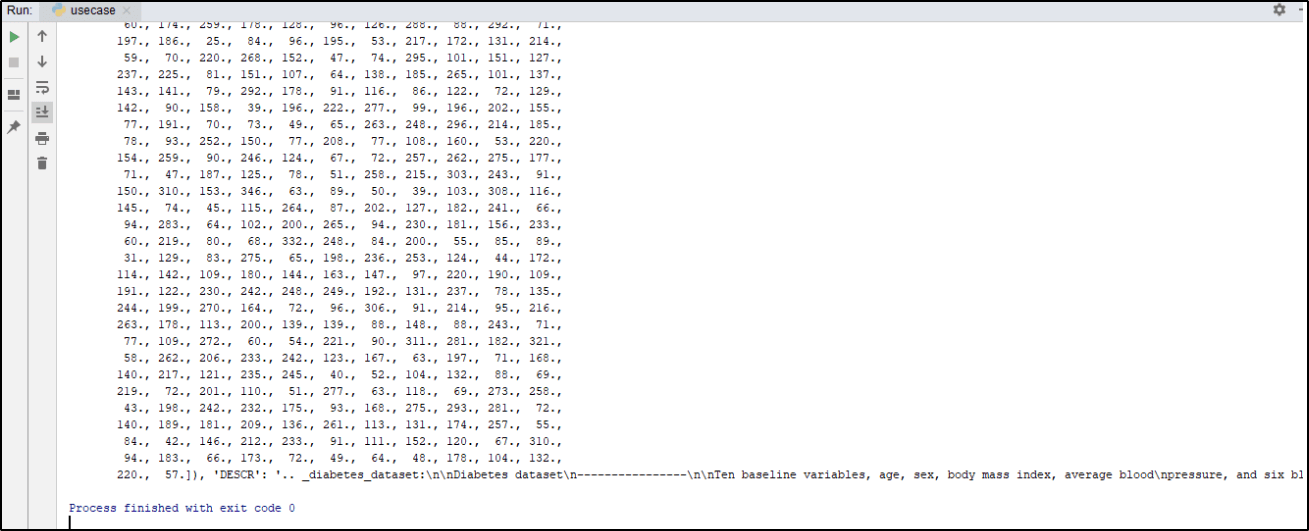
2. Exploring The Data
After we are done loading the data, we can start exploring by simply checking the labels by using the following code.
print(disease.keys())
Output: 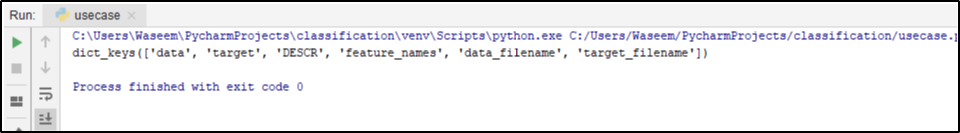
The above code gives all the labels from the data set, after this, we can slice the data so that we can plot the line in the end. We will also use all the data points, for now, we will slice column 2 from the data.
import numpy as np

disease_X = disease.data[:, np.newaxis,2]
print(disease_X)
Output: 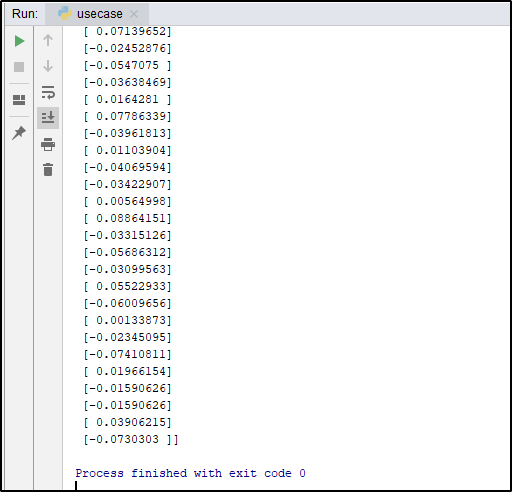
After this step, we will split the data into train and test set.
3. Splitting The Data
disease_X_train = disease_X[:-30]
disease_X_test = disease_X[-20:]

disease_Y_train = disease.target[:-30]
disease_Y_test = disease.target[-20:]
The next part involves generating the model, which will include importing linear_model from sklearn.
4. Generating the model
from sklearn import linear_model

reg = linear_model.LinearRegression()
reg.fit(disease_X_train,disease_Y_train)

y_predict = reg.predict(disease_X_test)
To evaluate the accuracy of the model, we will use the mean squared error from the scikit-learn.
5. Evaluation
accuracy = mean_squared_error(disease_Y_test,y_predict,)

print(accuracy)

weights = reg.coef_
intercept = reg.intercept_
print(weights,intercept)
Output: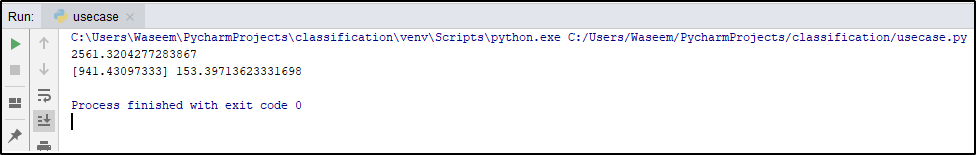
To be more clear on how the data points look like on the graph, let us plot the graphs as well.
import matplotlib.pyplot as plt

plt.scatter(disease_X_test, disease_Y_test)
plt.plot(disease_X_test,y_predict)
plt.show()
Output: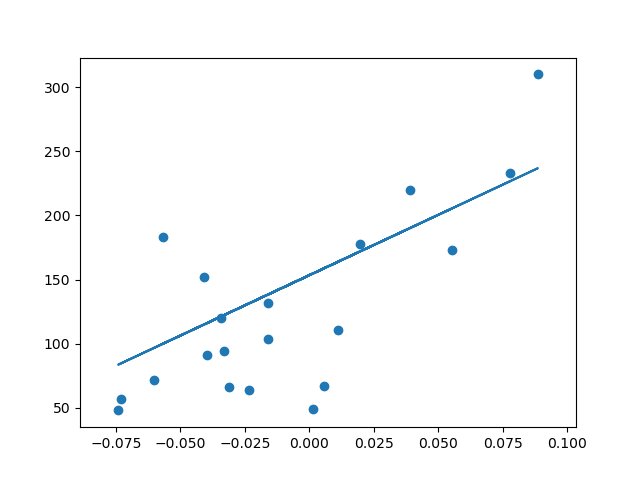
To get a more accurate model in this scenario, we can use the whole data instead of just the column 2. That would give an accuracy as shown below:
#make a little change in the code above, and remove the plotting code to avoid errors
disease_X = disease.data
Output: 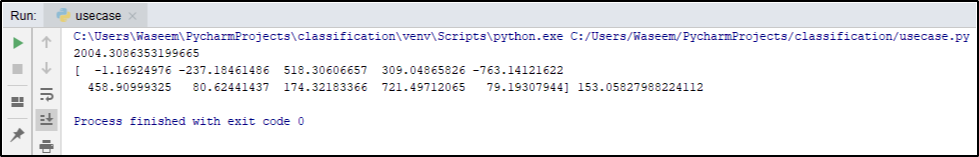
This brings us to the end of this article where we have learned about Linear Regression for Machine Learning. I hope you are clear with all that has been shared with you in this tutorial.
You can also take a Best Machine Learning Course. The program will provide you with the most in-depth and practical information on machine-learning applications in real-world situations. Additionally, you’ll learn the essentials needed to be successful in the field of machine learning, such as statistical analysis, Python, and data science.
With immense applications and easier implementations of Python with data science, there has been a significant increase in the number of jobs created for data science every year. Enroll for Edureka’s Data Science with Python Certification Course and get hands-on experience with real-time industry projects along with 24×7 support, which will set you on the path of becoming a successful Data Scientist.


 Thank you for registering Join Edureka Meetup community for 100+ Free Webinars each month JOIN MEETUP GROUP