Data Science with Python Certification Course
- 131k Enrolled Learners
- Weekend
- Live Class
(49300)


 Copy Link!
_1648290501.jpg)
Python is a must-learn skill for professionals in the Data Analytics domain. With the growth in the IT industry, there is a booming demand for skilled Data Scientists and Python has evolved as the most preferred programming language for data-driven development. Through this article, you will learn the basics, how to analyze data, and then create some beautiful visualizations using Python.
Before we begin, let me just list out the topics I’ll be covering through the course of this article.
You can go through this Python Libraries video lecture where our expert is discussing each & every nitty-gritty of the technology.
This Edureka session will focus on the top Python libraries that you should know to master Data Science and Machine Learning.
Data Science has emerged as a very promising career path for skilled professionals. The truest essence of Data Science lies in the problem-solving capabilities to provide insights and solutions driven by data. There is a lot of misconception when it comes to Data Science, the Data Science life cycle is one way to get a clearer perspective to understand what Data Science really is.
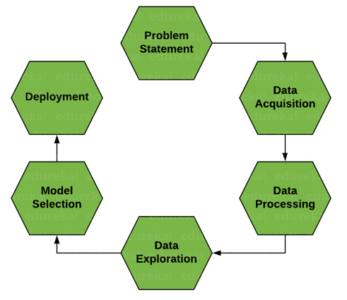
Data science takes into account the whole process starting from understanding the business requirements to preparing the data for model building and deploying the insights finally. The whole process is handled by different professionals including Data Analysts, Data Engineers, and Data Scientists. The role depends upon the size of the company, sometimes all the processes are done by just one professional. Let us try to understand why python is the right programming language for Data Science.
Python is no doubt the best-suited language for a Data Scientist. I have listed down a few points which will help you understand why people go with Python:
Data Scientist is the hottest job profile in the market right now, with more than 250,000 to 1.7 million expected job openings in the year 2020 alone is pretty promising for any professional to learn Data Science.
A Data Scientist job profile stays open for 5 more days on any portal compared to any other job opening.
The future looks pretty promising too, according to sources, there is going to be a massive surge in the Data Science job market with an expected growth of a further 500,000 to 11 million jobs by 2025.
With an increasing data flow, it is pretty evident that the market is thriving on Data. And it is going to make an impact almost everywhere, so the scope is not just related to a particular domain. Data Science is an integral part of any organization, business, etc.

Let us take a look at the fruits of hard work that a job profile related to Data Science gets in the market.
The Data Science job market is filled with job profiles, so to give you a clearer perspective here are the top 3 job profiles for Data Science-related jobs in the market with their average salaries in The United States and India.

Let us take a look at the company trends revolving around the Data Science Job market.
Data Science is an integral part of any organization, business, etc. Some of the major players in the market are listed down, but we have to be clear that these are only the tip of the much bigger iceberg. The amount of data flowing in the world has almost every organization buckle up for the kind of impact data-driven development makes on a business. So even the smaller businesses are thriving in the Data Science market and making their mark in the industry.

Let us take a look at the basics that must be mastered in order to master Data Science.
Now is the time when you get your hands dirty with Python programming. But for that, you should have a basic understanding of the following topics:
For more information and practical implementations, you can refer to this blog: Python Tutorial.
The very first step, to begin with, is loading the data into your program. We can do so by using the read_csv( ) from the Python panda’s library.
import pandas as pd
data = pd.read_csv("file_name.csv")
After loading the data in your program, you can explore the data.

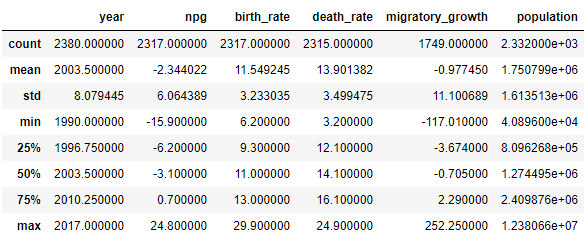
The next step is to look for irregularities in the data by doing some data exploration. Finding out the null values and replacing them with other values or dropping that row altogether is involved in this phase.
data.describe()
#to check for null values
data.isnull().sum()
#drop the null values
df = data.dropna()
#checking again to be double sure
df.isnull().sum()


After we are done cleaning, we can move ahead and make some visualizations to understand the relationship between various aspects of our dataset.
sns.scatterplot(x=df["npg"], y=df["birth_rate"])

Based on our analysis we can make conclusions and provide insights into the problems and insights driven by data.
This is the part where the actual power of Python comes into the picture. Python comes with numerous libraries for scientific computing, analysis, visualization, etc. Some of them are listed below:
NumPy is a core library of Python which stands for ‘Numerical Python’. It is used for scientific computing, which contains a powerful n-dimensional array object and provides tools for integrating C, C++, etc. It can also be used as a multi-dimensional container for generic data where you can perform various Numpy Operations and special functions.
Pandas is an important library in Python. It is used for data manipulation and analysis. It is well suited for different data such as tabular, ordered and unordered time series, matrix data, etc.
Matplotlib is a powerful library for visualization in Python. It can be used in Python scripts, shell, web application servers, and other GUI toolkits. You can use different types of plots and how multiple plots work using Matplotlib.
Seaborn is a statistical plotting library in Python. So whenever you’re using Python, you will be using matplotlib (for 2D visualizations) and Seaborn, which has its beautiful default styles and a high-level interface to draw statistical graphics.
Scikit learn is one of the main attractions, wherein you can implement machine learning using Python. It is a free library that contains simple and efficient tools for data analysis and mining purposes. You can implement the various algorithms, such as logistic regression, time series algorithm using scikit-learn. It is suggested that you should go through this tutorial video on Scikit-learn to understand machine learning and various techniques before proceeding ahead.
Let us go ahead and learn with the help of a few examples. These examples are driven by problem statements and we will derive our conclusions based on Data Science life cycle processes.
Problem Statement I
We have a data set consisting of various players including stats about their skills, nationality, clubs, etc. Our goal is to come up with a team that would be the best among all the players for a particular team formation.
So our approach will be to look for the best possible players in different team positions. The formation that we will build is 4-3-3. Therefore the positions that we will look for are – (‘LCB’, ‘CB’,’CB’,’RCB’,’LCM’,’RCM’,’CDM’,’LW’,’RW’,’ST’)
We will follow the following steps in order to make the best team.
Loading The Data Set
import pandas as pd
import numpy as np
import seaborn as sns
import matplotlib.pyplot as plt

data = pd.read_csv(r"C:UsersWaseemDesktopdatasetsfifa-20-complete-player-datasetplayers_20.csv")

fifa = pd.DataFrame(data, columns=['short_name', 'age', 'height_cm', 'nationality', 'club', 'weight_kg', 'overall', 'potential','team_position',
           'team_jersey_number'])

fifa.head()
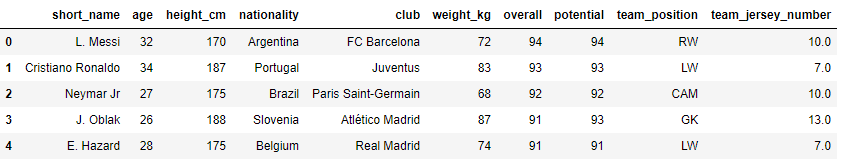
We have made a separate data frame with only the columns that we are going to need for our conclusion. The overall and potential are going to be a very important constraint in order to decide the best player for any position.
Cleaning the Data
We will clean the dataset, from the null values.
fifa.isnull().sum()
fifa = fifa.dropna()
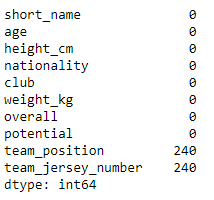
Most of the null values are in the team position and team jersey column, and for our problem statement, the team position is the driving factor so we will just drop those null values.
Explore the data
We can explore the data to get some insights about the data.
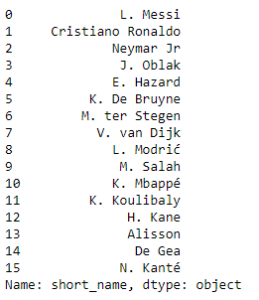
top = fifa.short_name[(fifa.overall > 88) & (fifa.potential >89 )]
print(top)
The above code gives us the names of the players who have an overall more than 88 and potential more than 89.
Now we will go ahead and make a few visualizations to understand the relationship between columns in our data set.
Visualizations
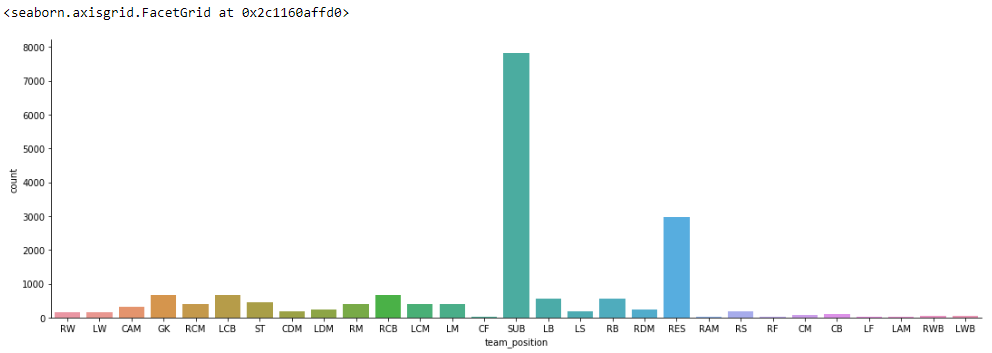
sns.catplot(x='team_position', kind='count', data=fifa, height=5, aspect=3)
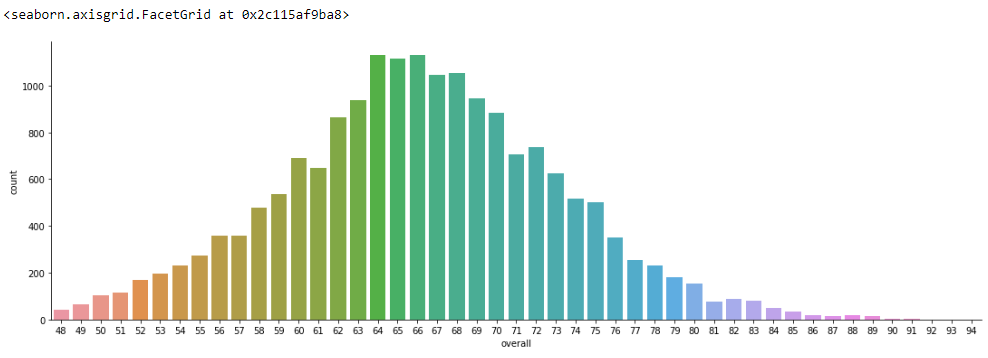
sns.catplot(x='overall', kind='count', data=fifa, height= 5, aspect= 3)
sns.catplot(x='club', y='overall',kind='box', data=fifa[0:20], height= 5, aspect= 3)
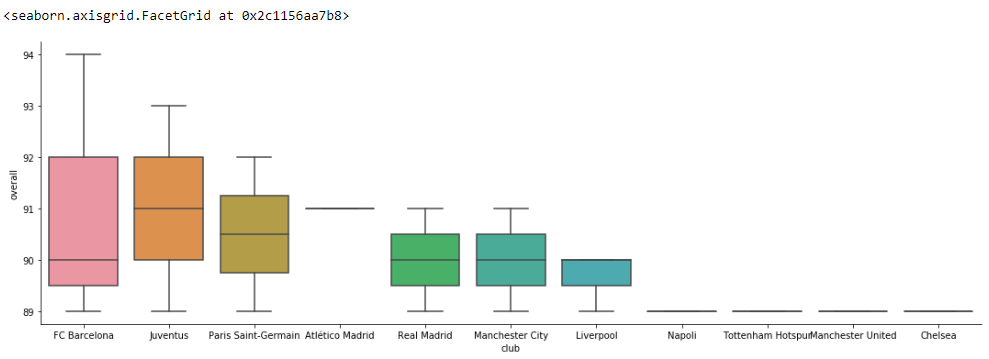
From the above visualizations, we are able to figure out the overall distribution among the players. The number of players in the clubs and the team position and their counts. So that will be enough for our problem statement.
Based on this, we will find the best player for various team positions.
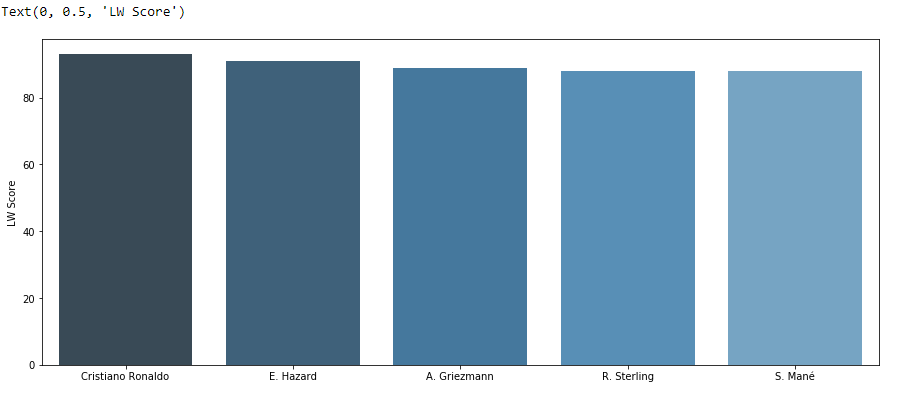
Best players for the LW position
plt.figure(figsize=(15,6))
sd = fifa[(fifa['team_position'] == 'LW')].sort_values('overall', ascending=False)[:5]
x2 = np.array(list(sd['short_name']))
y2 = np.array(list(sd['overall']))
sns.barplot(x2, y2, palette=sns.color_palette("Blues_d"))
plt.ylabel("LW Score")
Similarly, we can pick the best players for the other positions as well.
Conclusion
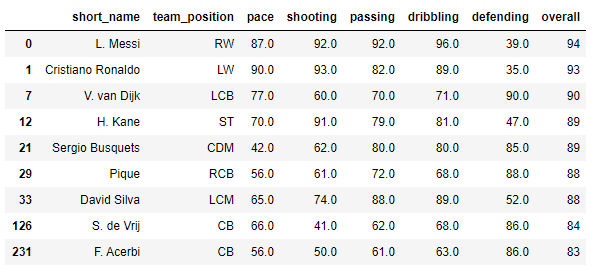
The best team for the formation 4-3-3 based on the fifa dataset is going to be:
fifa_skills = pd.DataFrame(data, columns= ['short_name','team_position','pace','shooting','passing','dribbling','defending','overall'
                                          ])


team = fifa_skills[(fifa_skills.short_name == 'L. Messi')|
                    (fifa_skills.short_name == 'H. Kane')|
                    (fifa_skills.short_name == 'Cristiano Ronaldo')|
                    (fifa_skills.short_name == 'K. de Bruyne')|
                    (fifa_skills.short_name == 'Sergio Busquets')|
                    (fifa_skills.short_name == 'David Silva')|
                    (fifa_skills.short_name == 'F. Acerbi')|
                   (fifa_skills.short_name == 'S. de Vrij')|
                   (fifa_skills.short_name == 'V. van Dijk')|
                   (fifa_skills.short_name == 'Pique')]

print(team)
In this problem statement, we have a clean data set with the single stock values. We will make a prediction model using python to predict the single stock price on a particular date.
import pandas as pd
import numpy as np
from sklearn.linear_model import LinearRegression
import matplotlib.pyplot as plt
import datetime
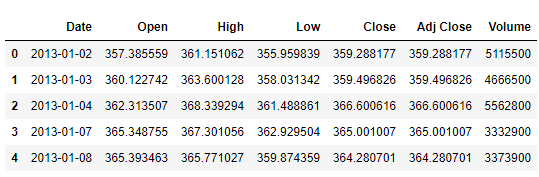
df = pd.read_csv("trainset.csv")
df.head()
df.isnull().sum()
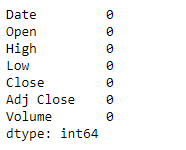
df['Date'] = df.Date.astype(str)
df['Date'] = df.Date.str.replace("-","").astype(float)

dates = df['Date']
x = dates.values.reshape(-1,1)
prices = df.Open
y = prices.values.reshape(-1,1)
reg = LinearRegression()
reg.fit(x,y)
pred = reg.predict(x[[0]])
print(pred)

plt.scatter(x,y,color='red')
plt.plot(x, reg.predict(x))
Output: array([[415.36098414]])
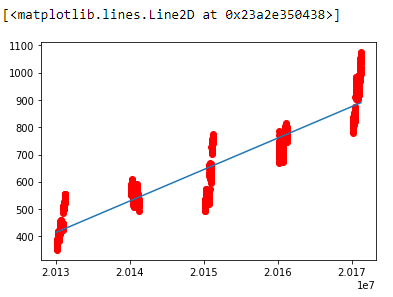
In the above example, we made a prediction model that predicts single stock prices using Linear Regression. Similarly, we can make prediction models for many complex problems with larger data sets.
This brings us to the end of this article where we have learned how we use Python. I hope you are clear with all that has been shared with you in this tutorial. If you found this article on “How to implement Python Libraries” relevant, check out Edureka’s Data Science with Python Course Online, a trusted online learning company with a network of more than 250,000 satisfied learners spread across the globe.
Related Post Methods for detecting and preventing clickjacking with JavaScript
Related post Network manipulation in ethical hacking with Python libraries
Also, If you are looking for online structured training in Data Science, edureka! has a specially curated Data Science Training course that helps you gain expertise in Statistics, Data Wrangling, Exploratory Data Analysis, Machine Learning Algorithms like K-Means Clustering, Decision Trees, Random Forest, Naive Bayes. You’ll learn the concepts of Time Series, Text Mining, and an introduction to Deep Learning as well. New batches for this course are starting soon!!
We are here to help you with every step on your journey and develop a curriculum designed for students and professionals who want to be a Python developer. The course is designed to give you a head start into Python programming and train you for core and advanced Python concepts and various Python frameworks like Django.
If you come across any questions, feel free to ask all your questions in the comments section of “How to implement Python Libraries”. Our team will be glad to answer.


 Thank you for registering Join Edureka Meetup community for 100+ Free Webinars each month JOIN MEETUP GROUP
The analysis in data science should be done very carefully. It is very important as for fair outputs, proper analysis is necessary. These explanations and tables were very interesting and made it easy to understand for us. Keep sharing!
Did you notice “total_benefited” is showing wrong values ? you should n’t add Year columns while computing “total_benefited”