
Advanced DevOps Certification Training with G ...
- 24k Enrolled Learners
- Weekend
- Live Class
(7990)


 Copy Link!
Kubernetes Dashboard is a general purpose, web-based UI for Kubernetes clusters. It allows users to manage applications running in the cluster and troubleshoot them, as well as manage the cluster itself.
A Kubernetes dashboard is a web-based Kubernetes user interface which is used to deploy containerized applications to a Kubernetes cluster, troubleshoot the applications, and manage the cluster itself along with its attendant resources.
If you want to get certified in Kubernetes, and master this tool, you can uplift your career as a DevOps Engineer with the Docker and Kubernetes training.
How to Deploy Kubernetes Dashboard?
Run the following command to deploy the dashboard:
kubectl create -f https://raw.githubusercontent.com/kubernetes/dashboard/master/src/deploy/recommended/kubernetes-dashboard.yaml
kubectl proxyIt will proxy server between your machine and Kubernetes API server.
Now, to view the dashboard in the browser, navigate to the following address in the browser of your Master VM:
http://localhost:8001/api/v1/namespaces/kube-system/services/https:kubernetes-dashboard:/proxy/
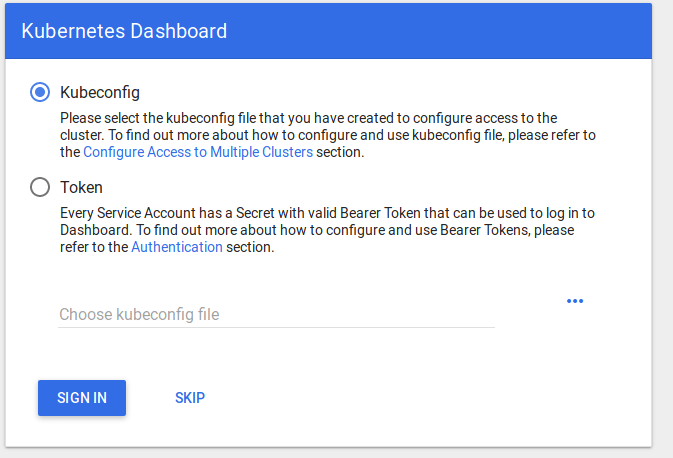
You will then be prompted with this page, to enter the credentials:
In this step, we will create the service account for the dashboard and get its credentials.
Note: Run all these commands in a new terminal, otherwise your kubectl proxy command will stop.
Run the following commands:
This command will create a service account for a dashboard in the default namespace
kubectl create serviceaccount dashboard -n defaultAdd the cluster binding rules to your dashboard account
kubectl create clusterrolebinding dashboard-admin -n default --clusterrole=cluster-admin --serviceaccount=default:dashboardCopy the secret token required for your dashboard login using the below command:
kubectl get secret $(kubectl get serviceaccount dashboard -o jsonpath="{.secrets[0].name}") -o jsonpath="{.data.token}" | base64 --decode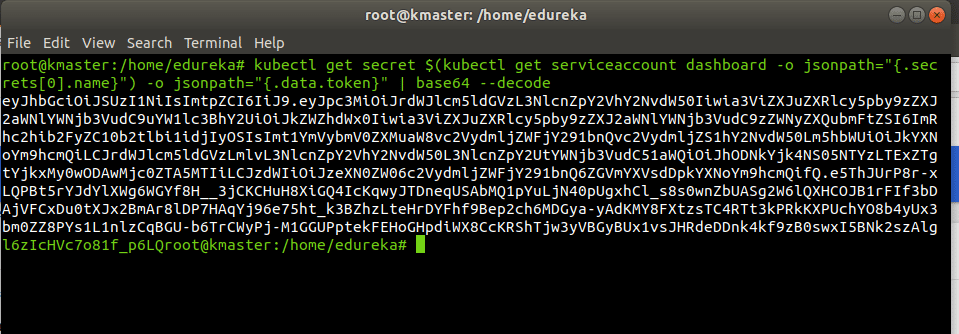
Copy the secret token and paste it in Dashboard Login Page, by selecting a token option
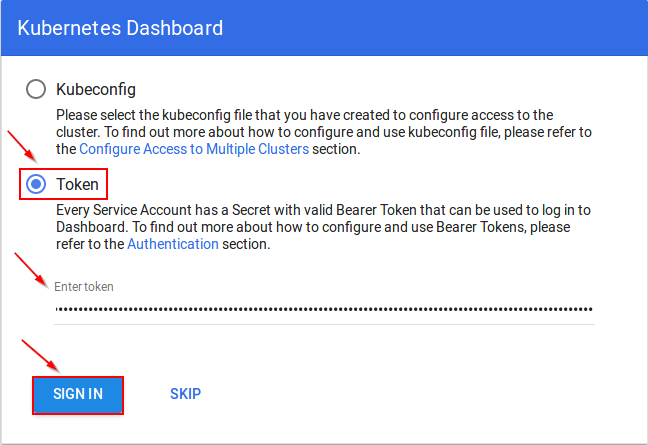
After Sign In you will land to Kubernetes Homepage.
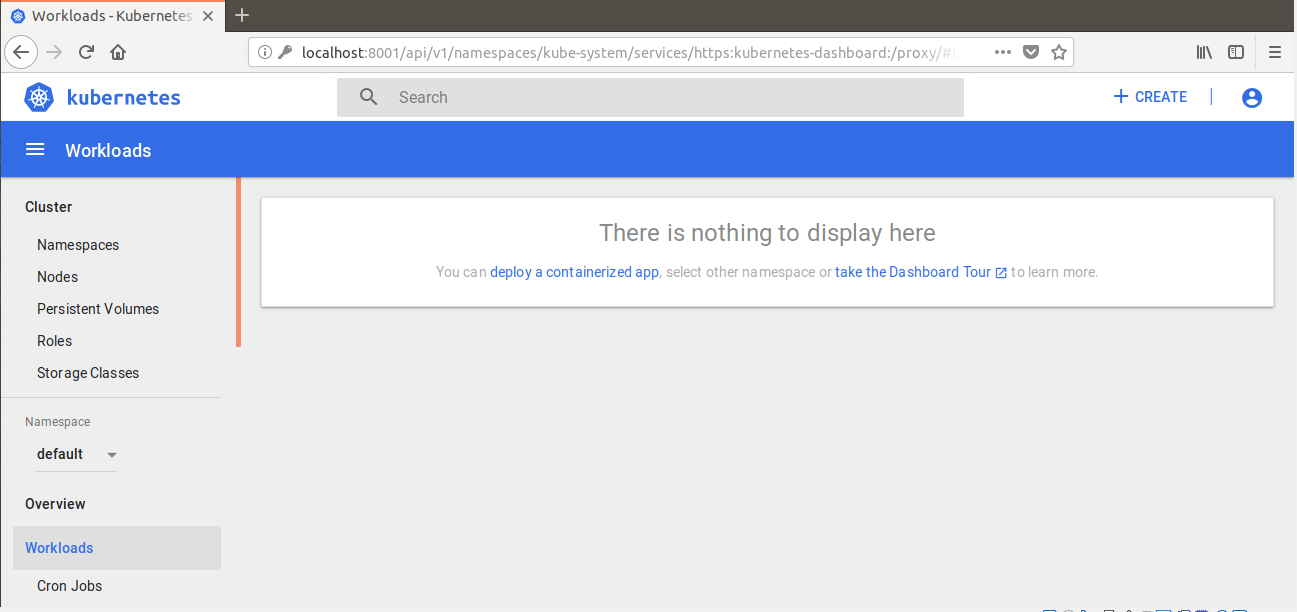
Home Page
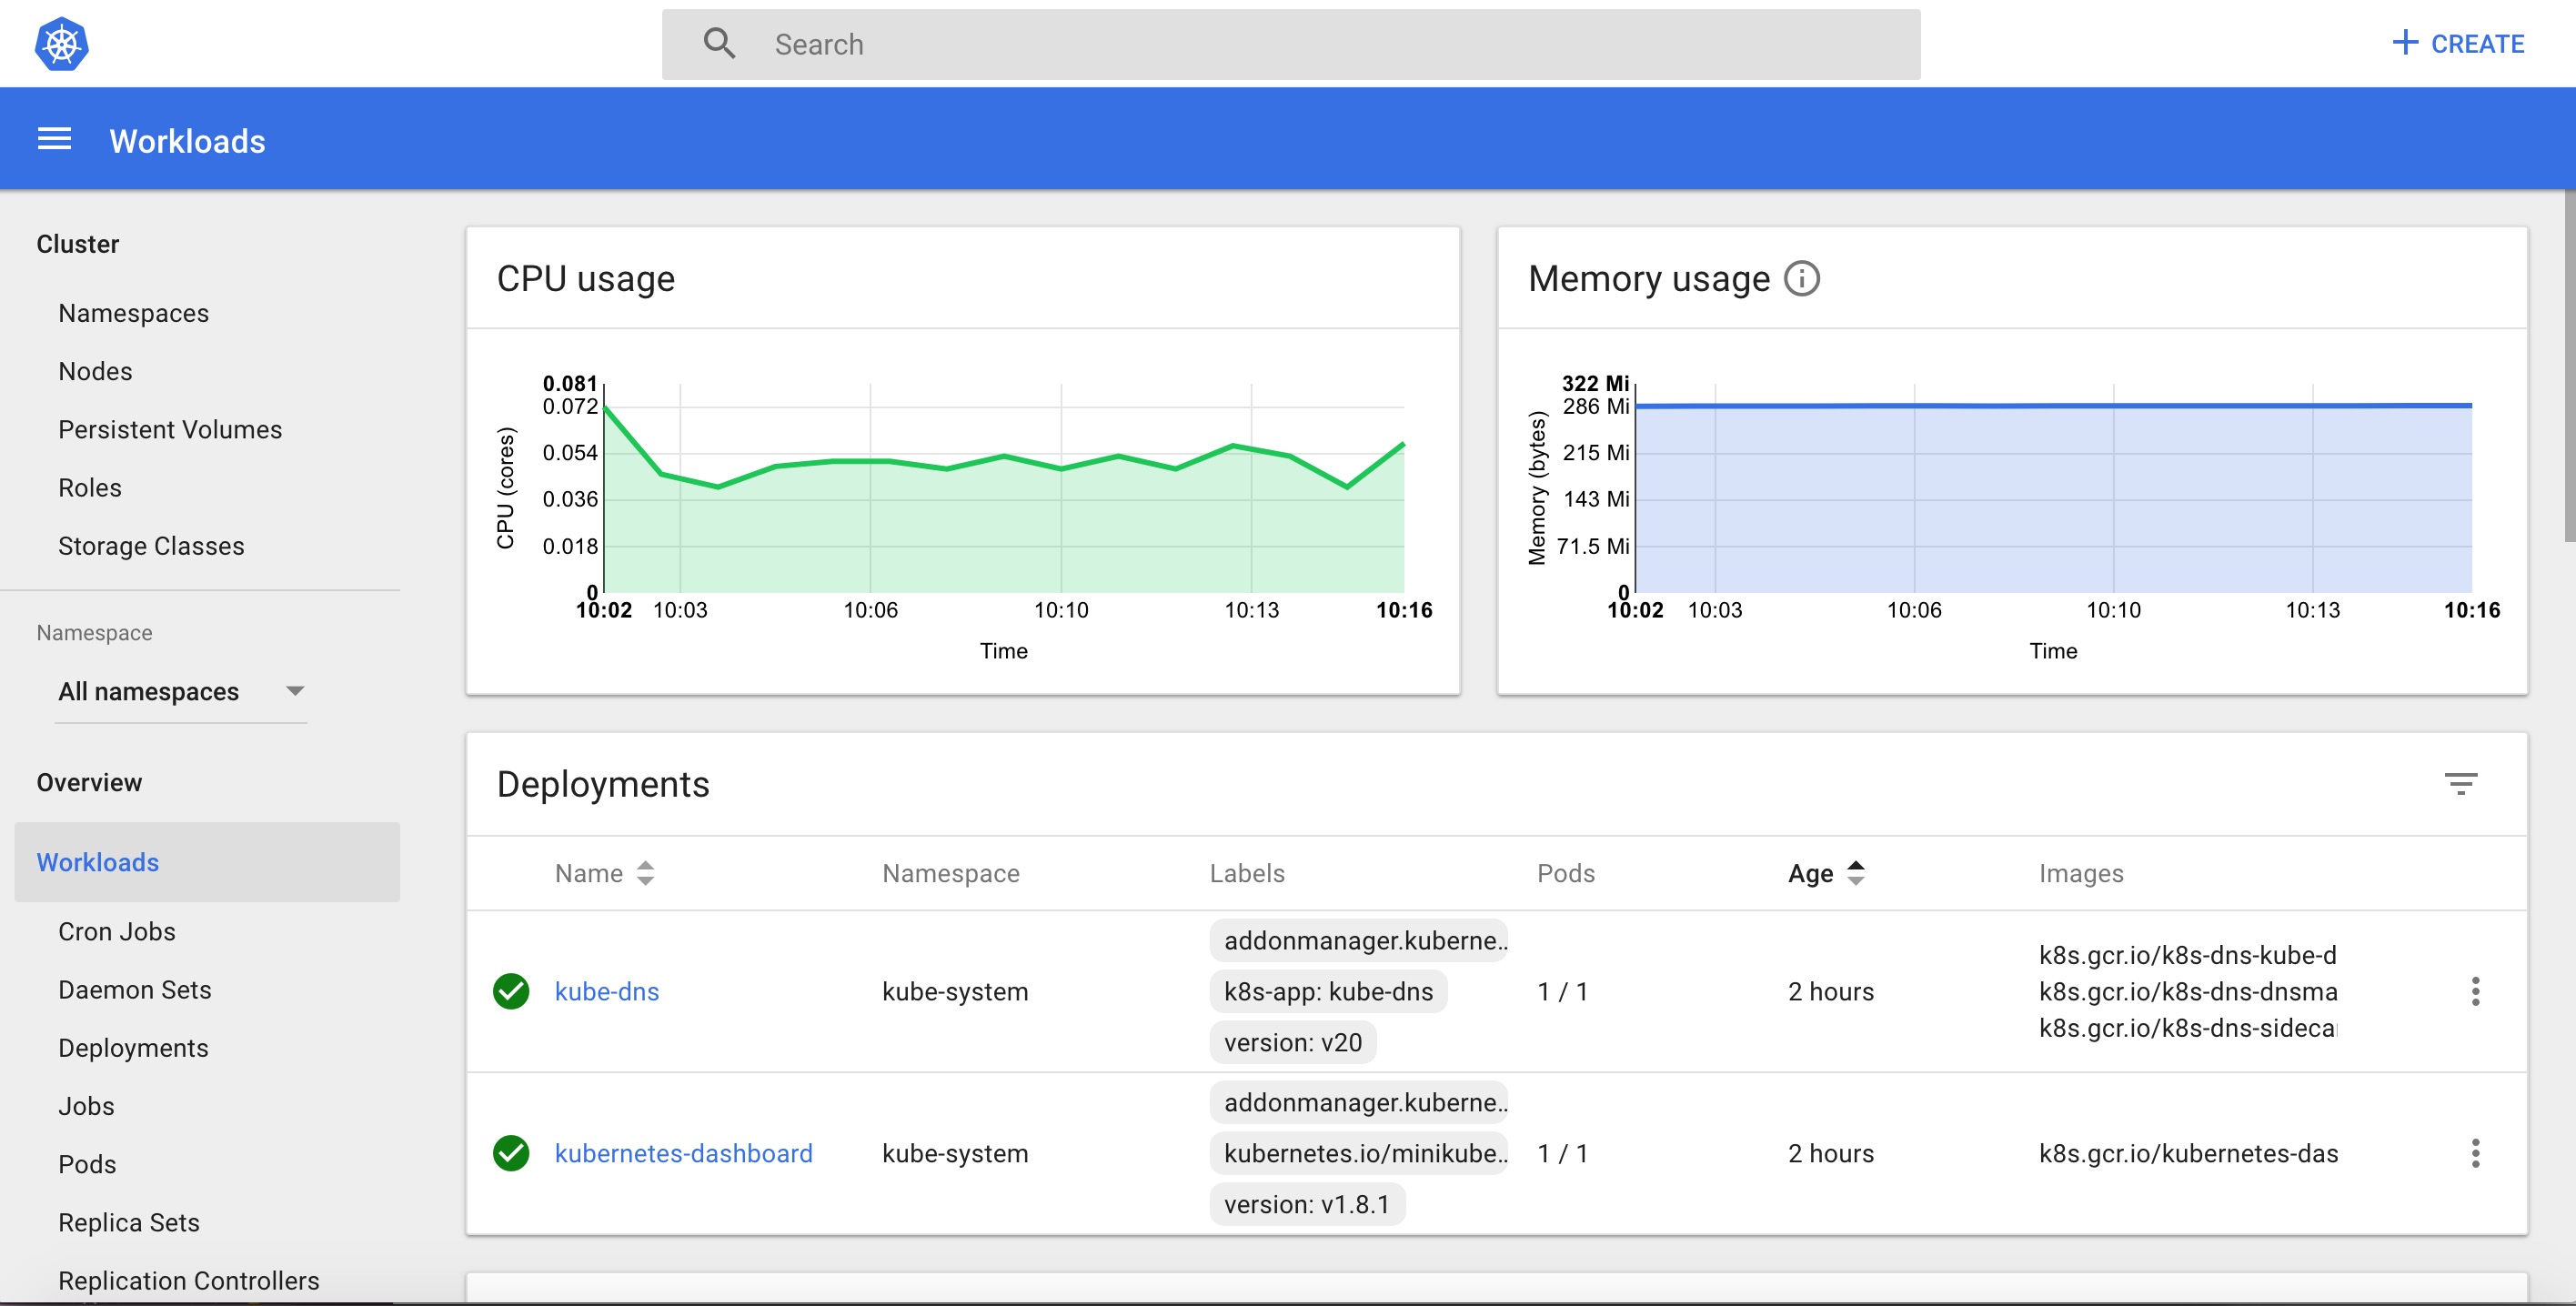
You’ll see the home/welcome page in which you can view which system applications are running by default in the kube-system namespace of your cluster, for example, the Dashboard itself.
Kubernetes Dashboard consists of following dashboard views:
Let’s start with the admin view.
It lists Nodes, Namespaces, and Persistent Volumes which has a detailed view of them, where node list view contains CPU and memory usage metrics aggregated across all Nodes and the details view shows the metrics for a Node, its specification, status, allocated resources, events, and pods running on the node.
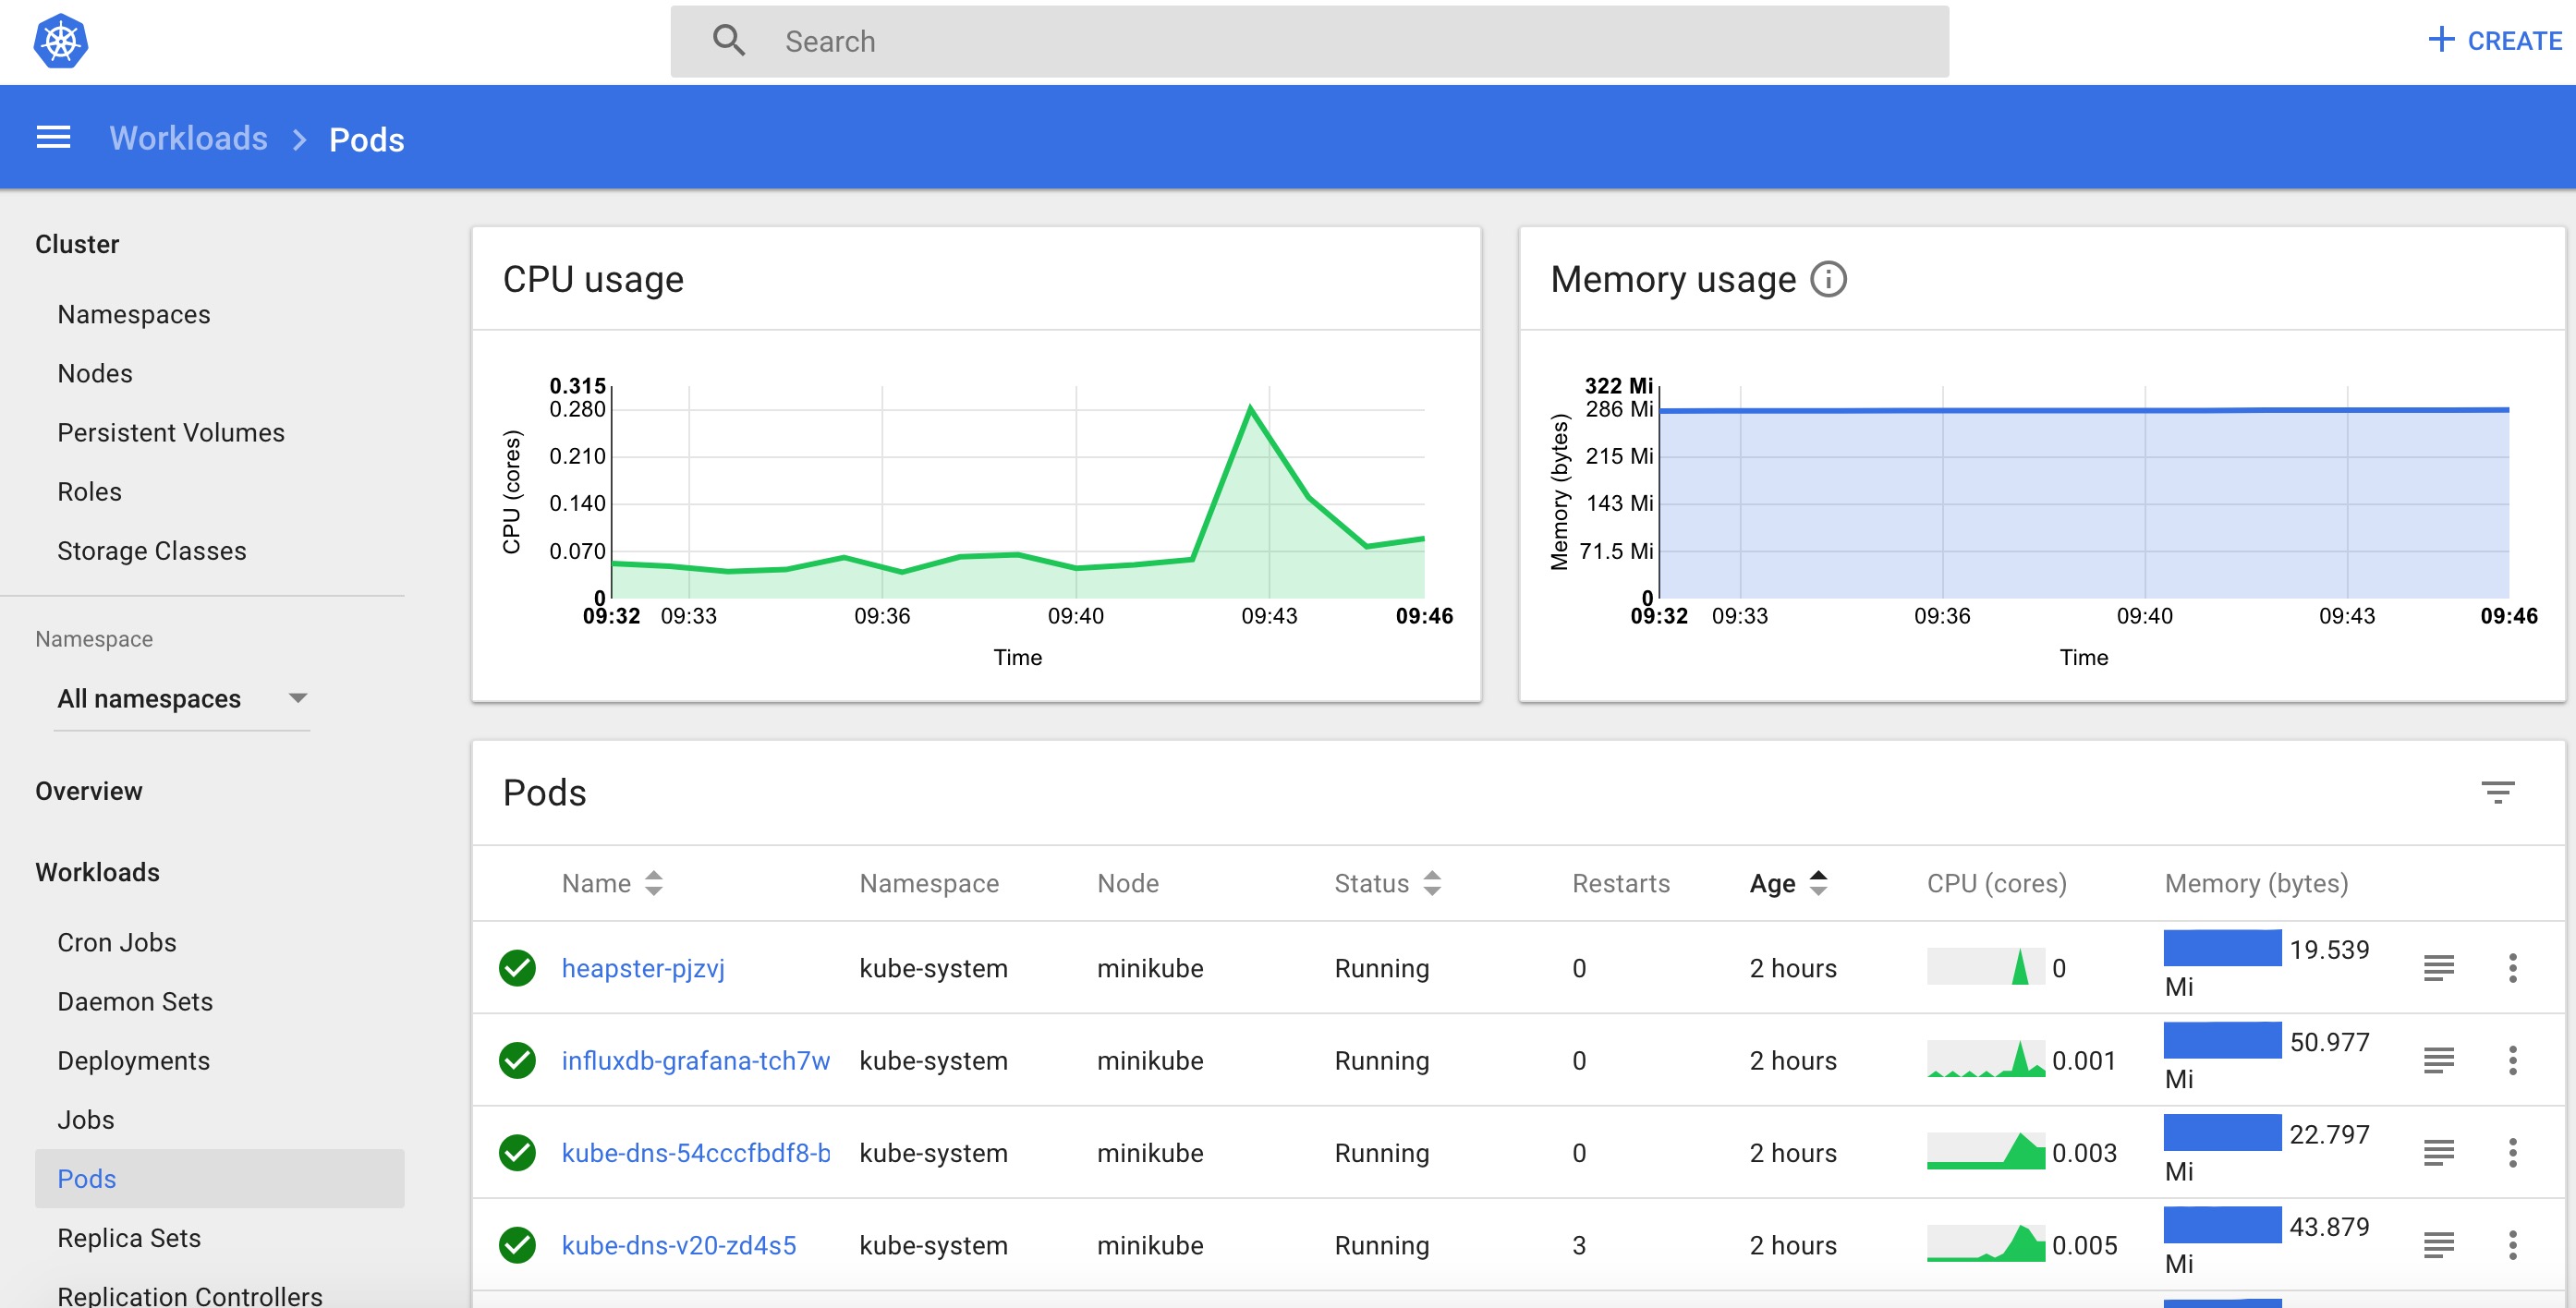
It is the entry point view that shows all applications running in the selected namespace. It summarizes the actionable information about the workloads, for example, the number of ready pods for a Replica Set or current memory usage for a Pod.
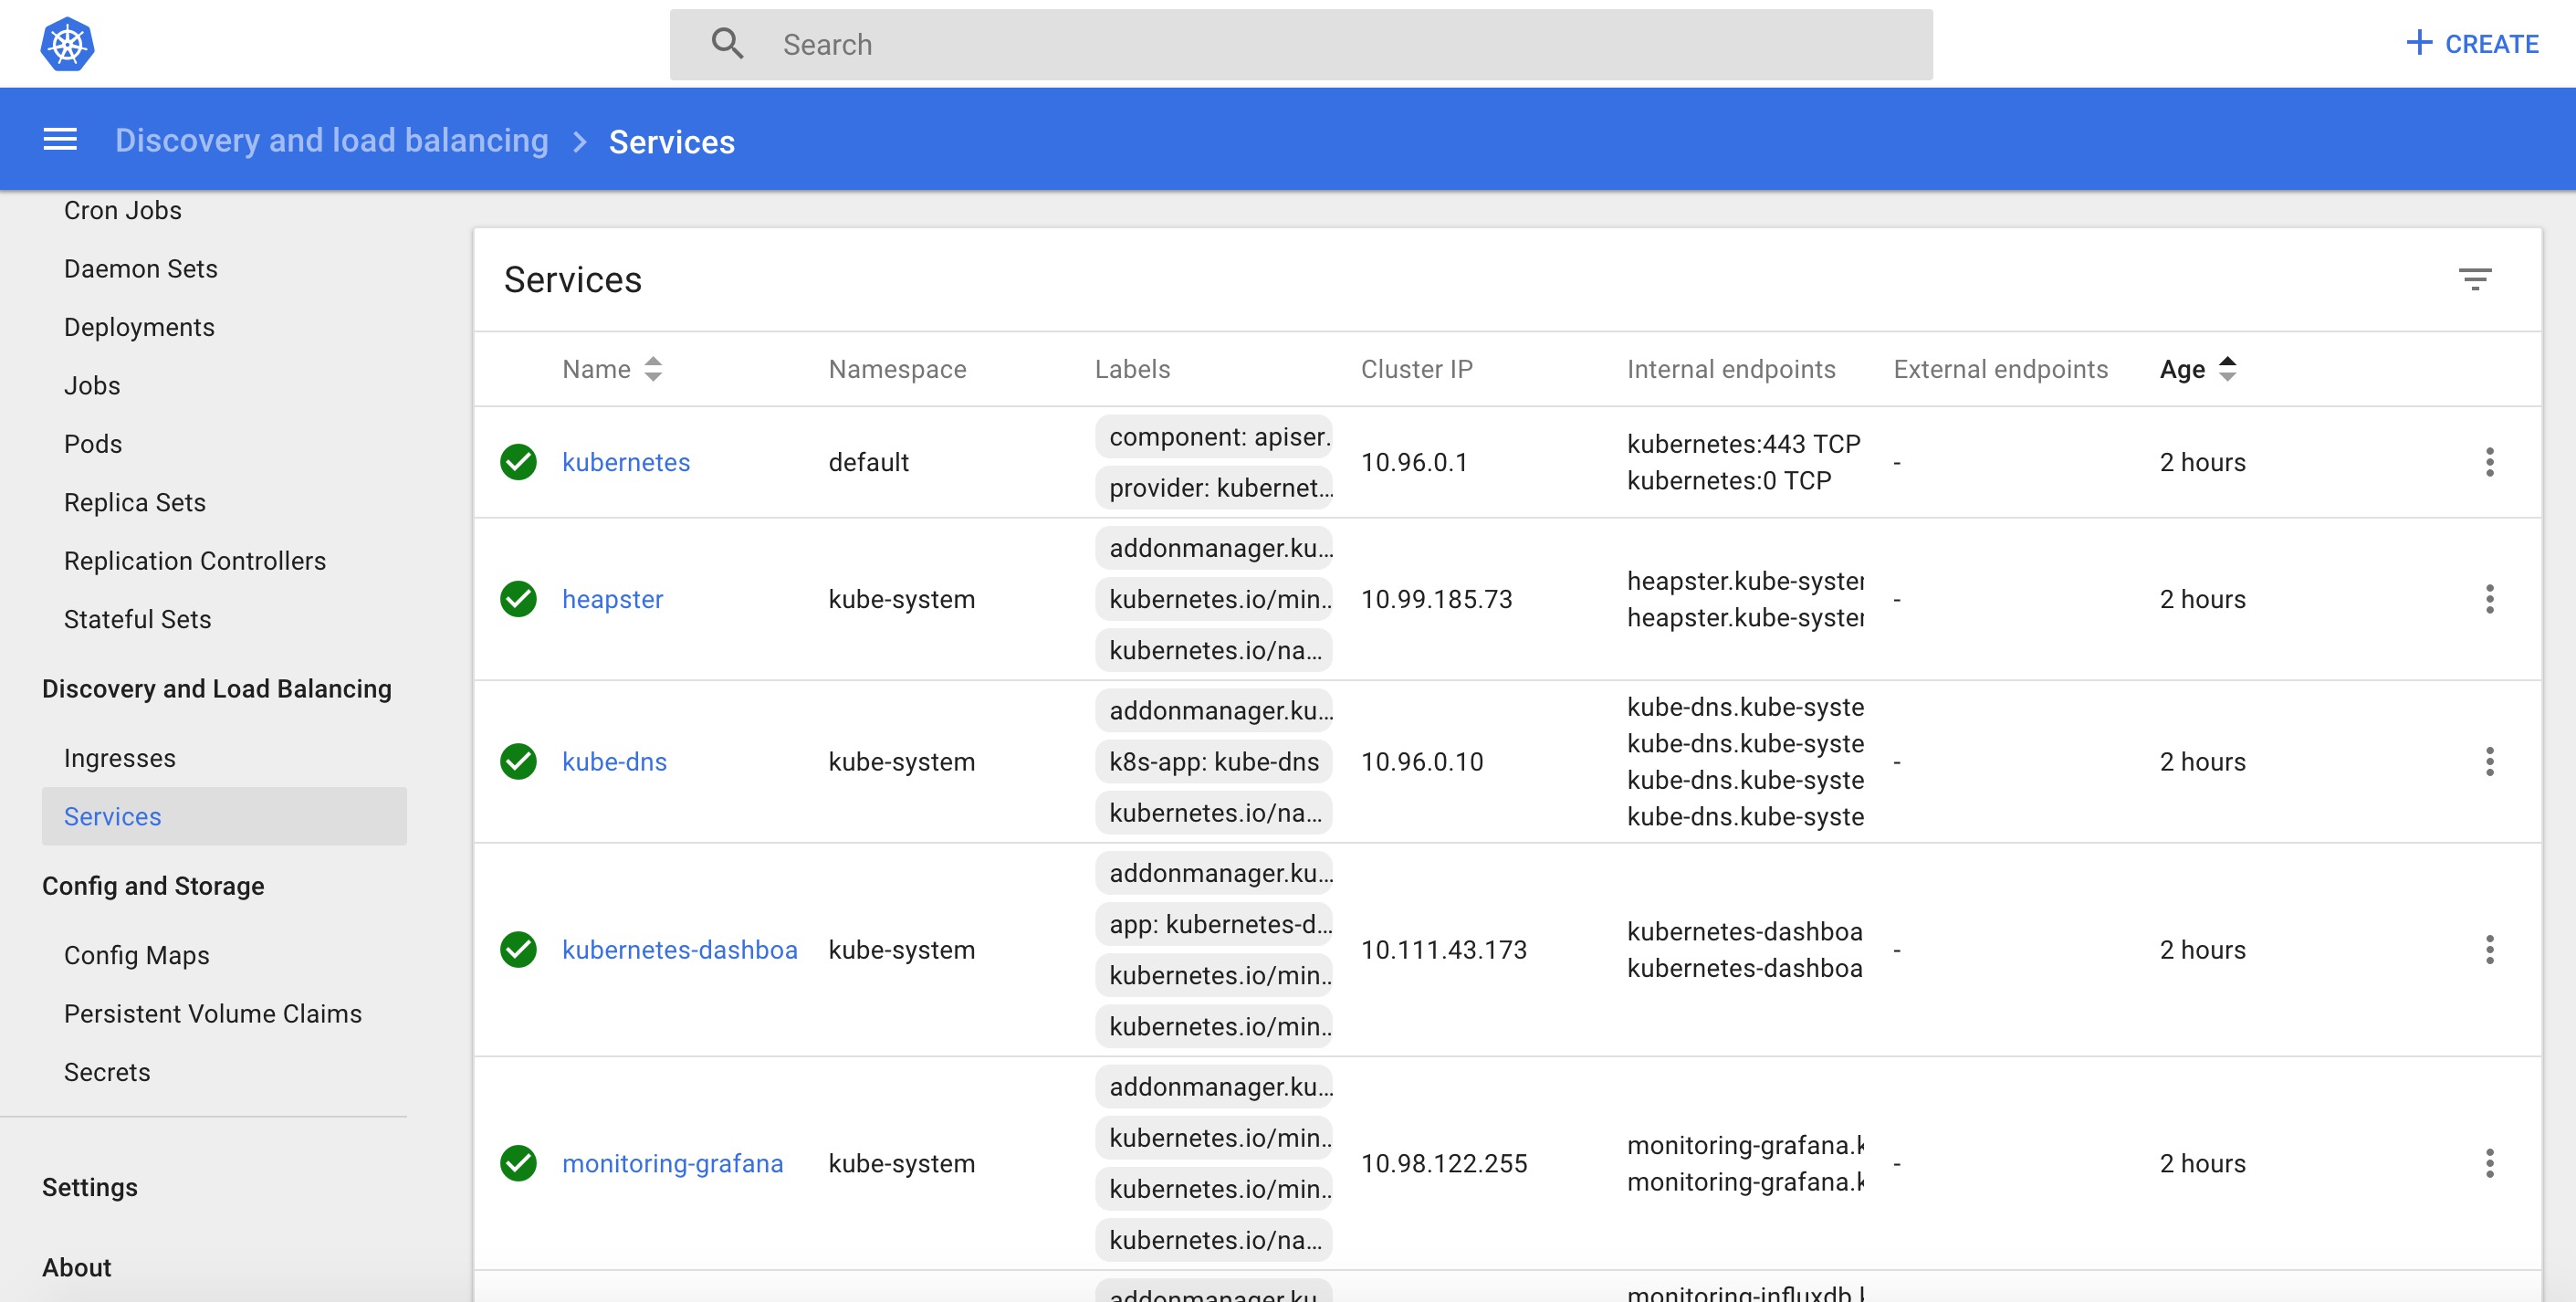
It shows the shows Kubernetes resources that allow for exposing services to the external world and discovering them within a cluster.
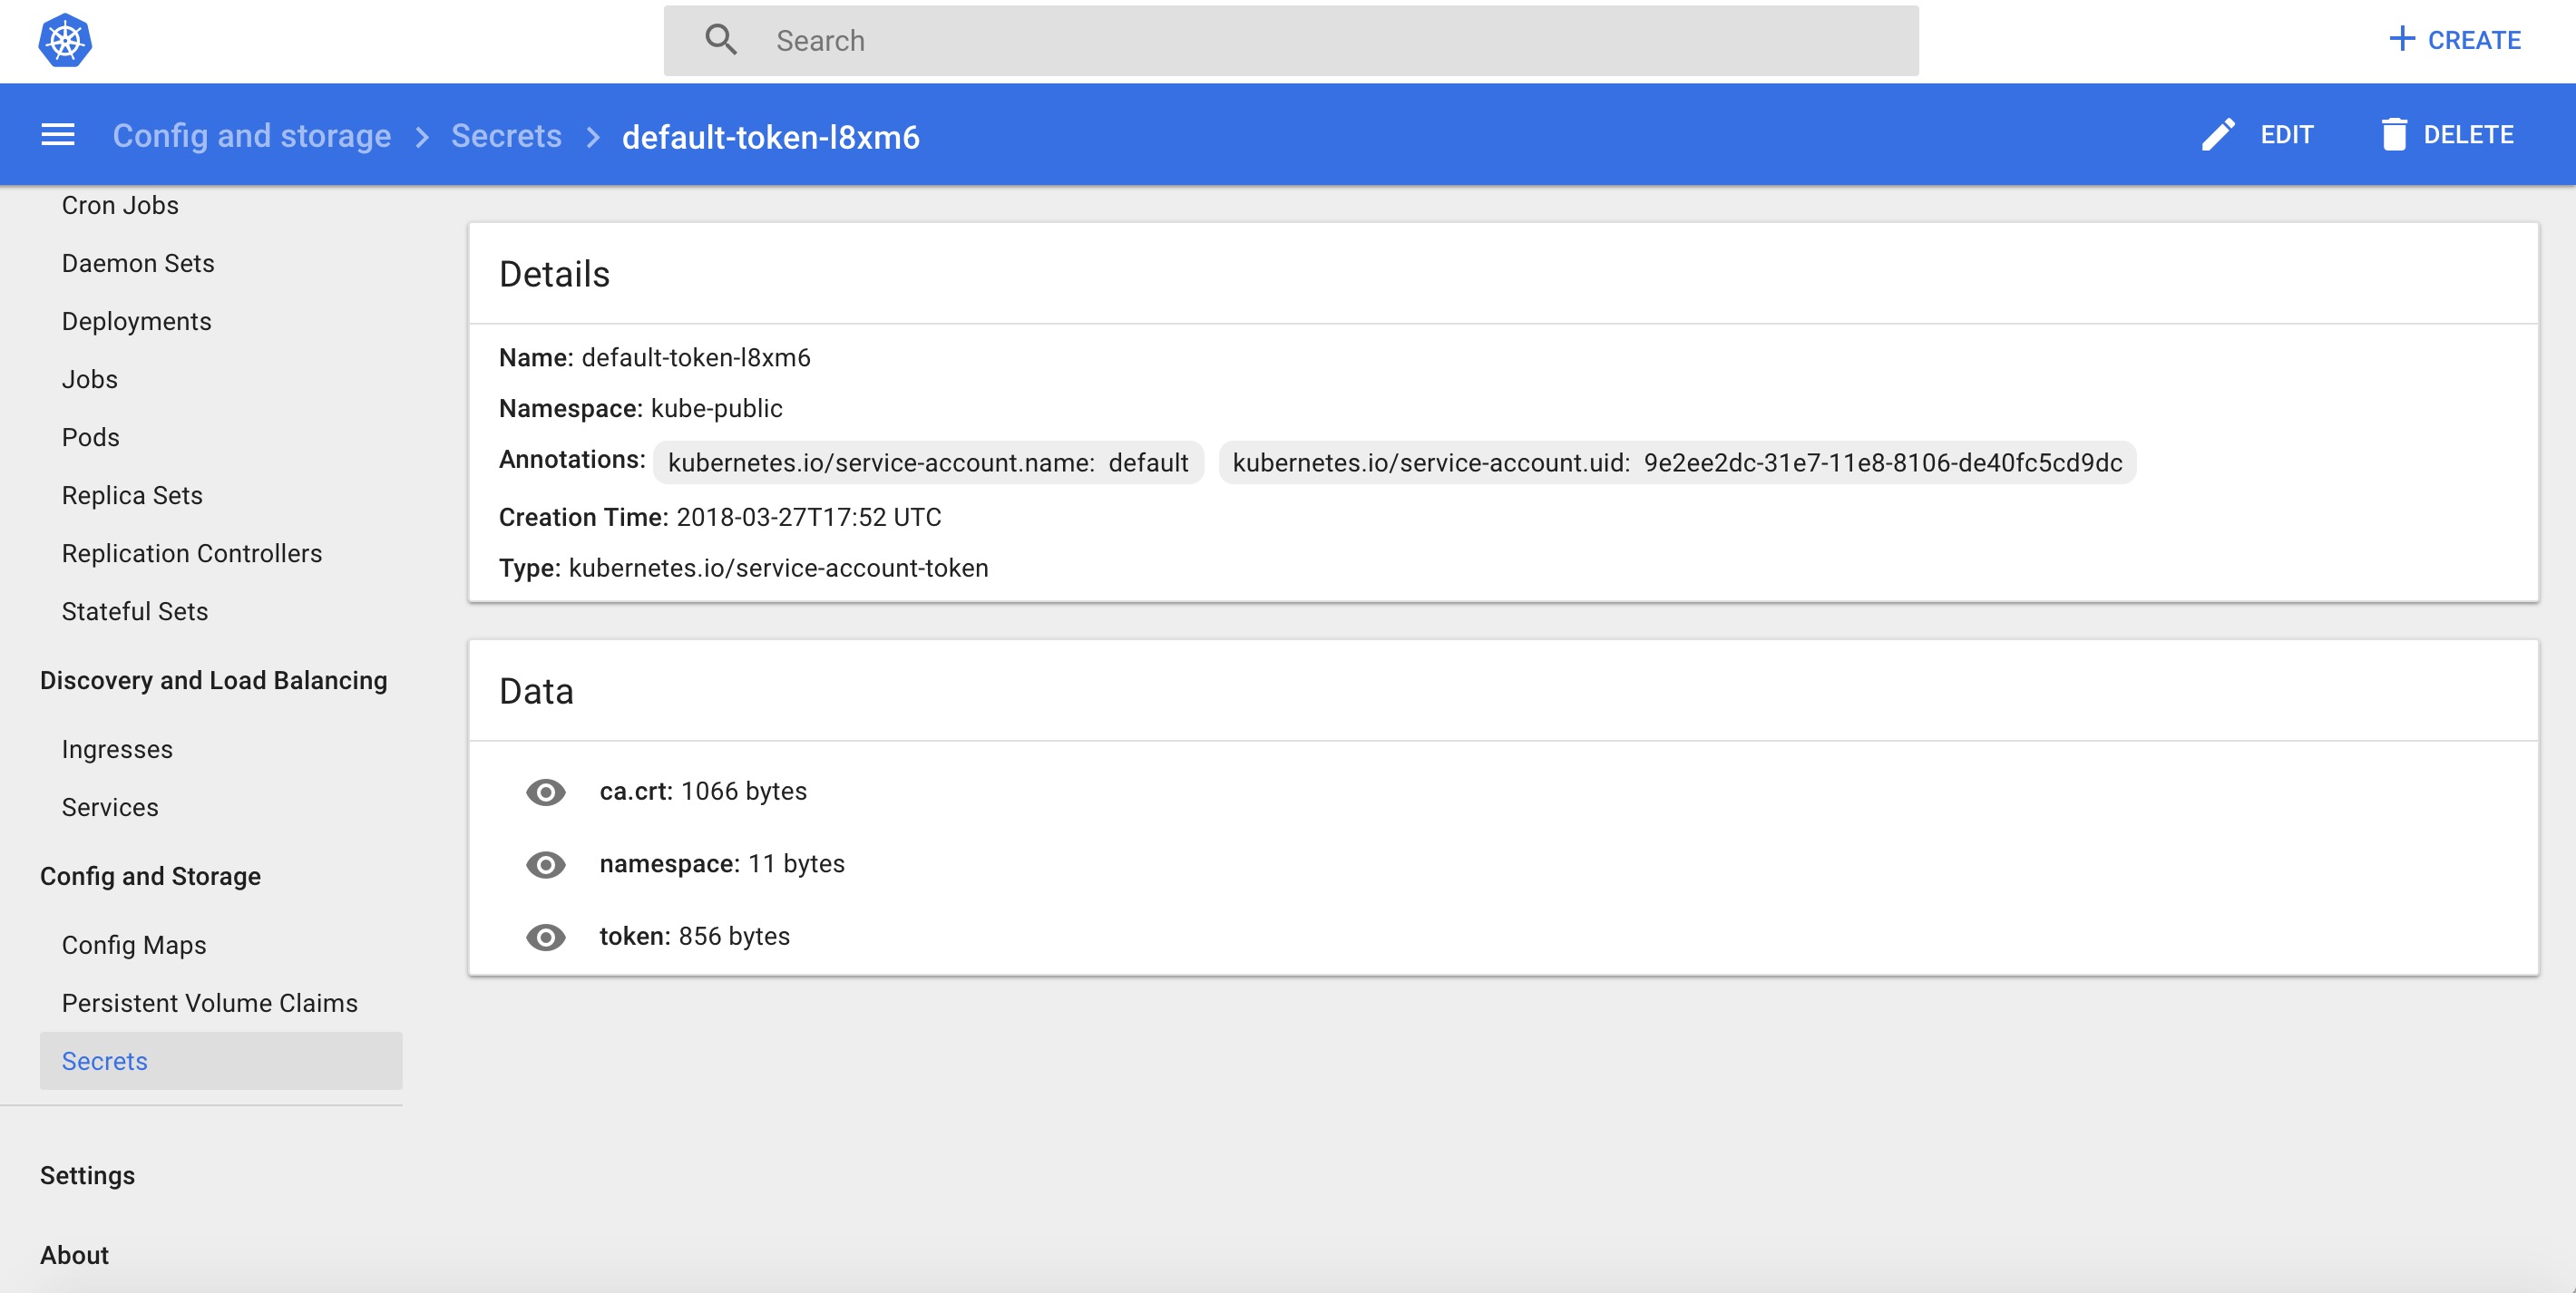
The Storage view shows Persistent Volume Claim resources which are used by applications for storing data whereas config view is used to shows all the Kubernetes resources that are used for live configuration of applications running in clusters.
Got a question for us? Please mention it in the Continuous Integration Tools comments section and we will get back to you.


 Thank you for registering Join Edureka Meetup community for 100+ Free Webinars each month JOIN MEETUP GROUP
Hi ,the kubernetes dashboard url is not working .Could you please update it
This article is absolutely useless. Where are you going to use LOCALHOST in production? Install it for all developers localy? FUNNY!!!