Data Science with Python Certification Course
- 132k Enrolled Learners
- Weekend
- Live Class
(49300)


 Copy Link!
Majority of the retail business holders find it hard to recognize customer needs. The reason why Data-driven companies such as Netflix, Walmart, Target, etc. are doing so well is because they have an army of Certified Data Analysts that grow their business by using the right tools to create personalized marketing strategies. We do understand that not all customers are alike and have the same taste. So, this leads to the challenge of marketing the right product to the right customer. An offer or product which might entice a particular customer segment may not be very helpful to other segments. So, you can apply k-means clustering algorithm to segment your entire customer audience into groups with similar traits and preferences based on various metrics (such as their activities, likes and dislikes on social media and their purchase history). Based on these customer segments identified, you can create personalized marketing strategies and bring more business to your organisation.
I hope you enjoyed reading my previous blog – What is Data Science which covers Machine Learning and the lifecycle of Data Science in detail. Before delving into k-means clustering directly, I will be covering following topics to give you a basic understanding of clustering.
Machine Learning is one of the most recent and exciting technologies. You probably use it dozen of times a day without even knowing it. Machine Learning is a type of artificial intelligence that provides computers with an ability to learn without being explicitly programmed. It works on supervised and unsupervised learning models. Unlike supervised learning model, the unsupervised model of Machine Learning has no predefined groups under which you can distribute your data. You can find these groupings through clustering. I will explain it further through the following examples.
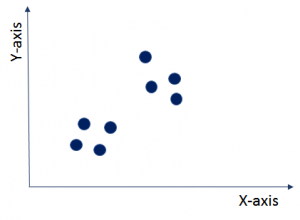
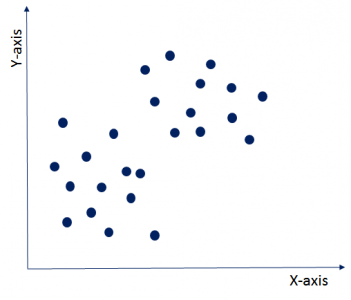
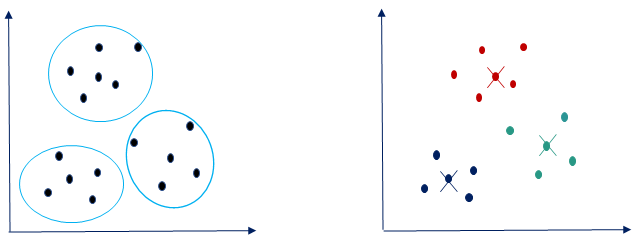
As you can see in this image, the data points are shown as blue dots. These data points do not have labels based on which you can differentiate them. You do not know anything about this data. So now the question is, can you find out any structure in this data? This problem can be solved using clustering technique. Clustering will divide this entire dataset under different labels (here called clusters) with similar data points into one cluster as shown in the graph given below. It is used as a very powerful technique for exploratory descriptive analysis.
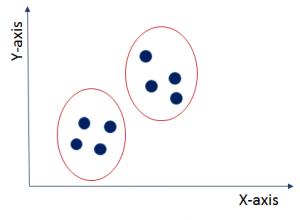 Here, the clustering technique has partitioned the entire data points into two clusters. The data points within a cluster are similar to each other but different from other clusters. For example, you have the data on symptoms of patients. Now, you can find out the name of a particular disease based on these symptoms.
Let’s understand clustering further with an example of google news.
What google news does is that every day with hundreds and thousands of news coming up on the web, it groups them into cohesive news stories. Let’s see how?
Once you go to news.google.com, you will see numerous news stories grouped as shown below.
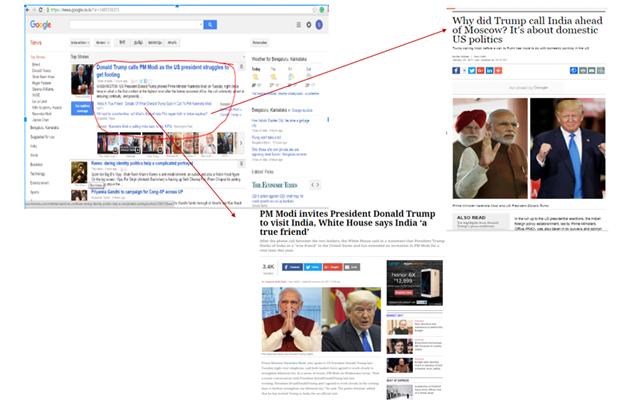
They are grouped into different news stories. Here, if you see the red highlighted area, you will get to know that various news URLs related to Trump and Modi are grouped under one section and rest in other sections. On clicking different URL from the group, you will get a different story on the same topic. So, google news automatically clusters new stories about the same topic into pre-defined clusters.
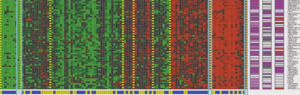 Another very fascinating application of clustering is in genomics. Genomics is the study of DNA. As you can see in the image, different colors like red, green and grey depict the degree to which individual does or does not has a specific gene. So, you can run clustering algorithm on the DNA data of a group of people to create different clusters. This can give you very valuable insights into the health of particular genes.
For example, people with Duffy-negative genotype tend to have higher resistance to malaria and are generally found in African regions. So, you can draw a relationship between the genotype, the native habitat and find out their response to particular diseases.
So, basically clustering partitions the dataset with similarities into different groups which can act as a base for further analysis. The result will be that objects in one group will be similar to one another but different from objects in another group.
Now, once you have understood what is clustering, let’s look at different ways to achieve these clusters.
Exclusive Clustering: 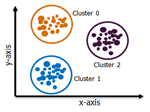 In exclusive clustering, an item belongs exclusively to one cluster, not several. In the image, you can see that data belonging to cluster 0 does not belong to cluster 1 or cluster 2. k-means clustering is a type of exclusive clustering.
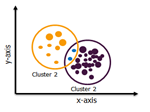 Overlapping Clustering: Here, an item can belong to multiple clusters with different degree of association among each cluster. Fuzzy C-means algorithm is based on overlapping clustering.
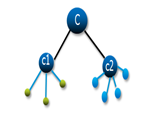
Hierarchical Clustering: In hierarchical clustering, the clusters are not formed in a single step rather it follows series of partitions to come up with final clusters. It looks like a tree as visible in the image.
While implementing any algorithm, computational speed and efficiency becomes a very important parameter for end results. So, I have explained k-means clustering as it works really well with large datasets due to its more computational speed and its ease of use.
k-means clustering is one of the simplest algorithms which uses unsupervised learning method to solve known clustering issues. k-means clustering require following two inputs.
Let’s say you have an unlabeled data set like the one shown below and you want to group this data into clusters.
Now, the important question is how should you choose the optimum number of clusters? There are two possible ways for choosing the number of clusters.
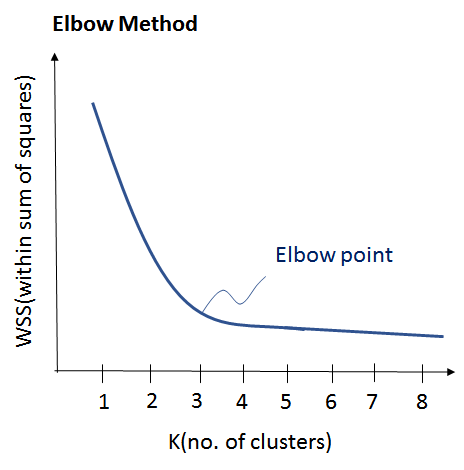
(i) Elbow Method: Here, you draw a curve between WSS (within sum of squares) and the number of clusters. It is called elbow method because the curve looks like a human arm and the elbow point gives us the optimum number of clusters. As you can see that after the elbow point, there is a very slow change in the value of WSS, so you should take the elbow point value as the final number of clusters.
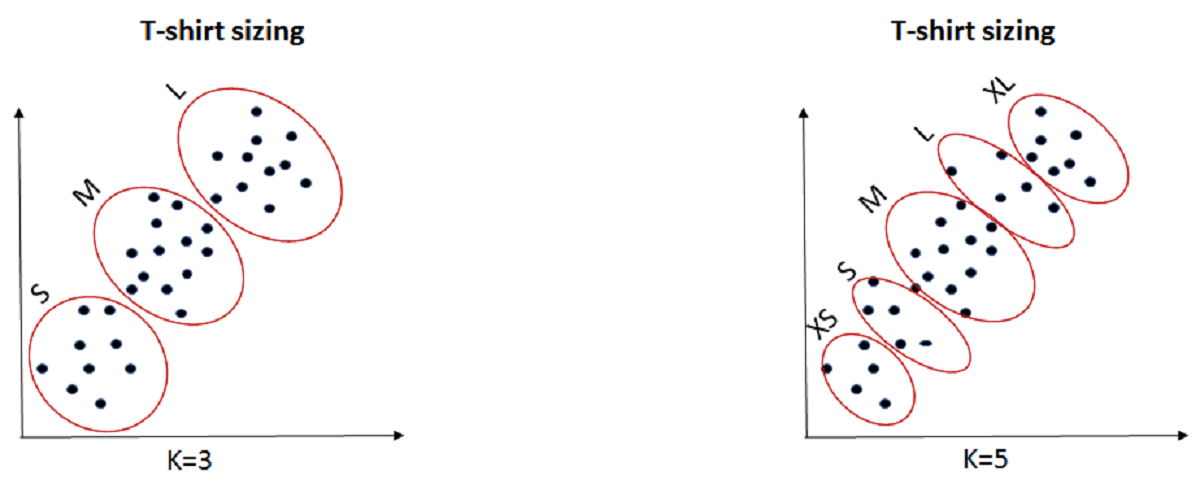
(ii) Purpose Based: You can run k-means clustering algorithm to get different clusters based on a variety of purposes. You can partition the data on different metrics and see how well it performs for that particular case. Let’s take an example of marketing T-shirts of different sizes. You can partition the dataset into different number of clusters depending upon the purpose that you want to meet. In the following example, I have taken two different criteria, price and comfort.
Let’s see these two possibilities as shown in the image below.
Now, once we have the value of k with us, let’s understand it’s execution.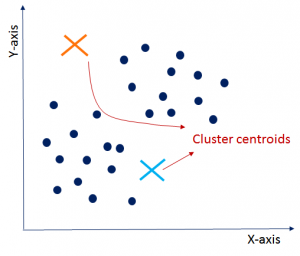
 luster Assignment:
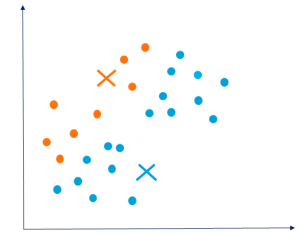
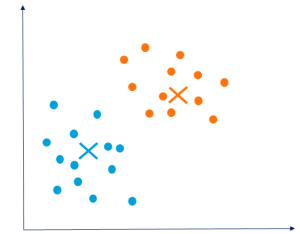
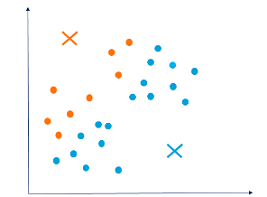
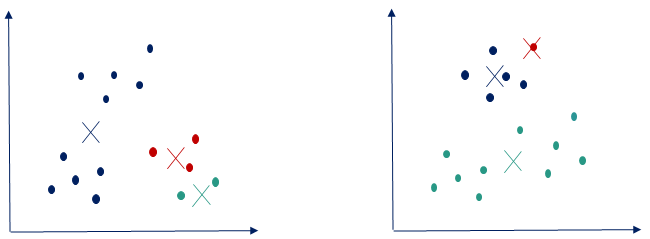
As you can see in the graph below, the three clusters are clearly visible but you might end up having different clusters depending upon your choice of cluster centroids.
Below shown are some other possibilities of cluster partitioning based on the different choice of cluster centroids. You may end up having any of these groupings based on your requirements and the goal that you are trying to achieve.
Now that you have understood the concepts of clustering, so let’s do some hands-on in R.
k-means clustering case study: Movie clustering
Let’s say, you have a movie dataset with 28 different attributes ranging from director facebook likes, movie likes, actor likes, budget to gross and you want to find out movies with maximum popularity amongst the viewers. You can achieve this by k-means clustering and divide the entire data into different clusters and do further analysis based on the popularity.
For this, I have taken the movie dataset of 5000 values with 28 attributes.
Step 1. First, I have loaded the dataset in RStudio.
movie_metadata <- read_csv(“~/movie_metadata.csv”)
View(movie_metadata)
Step 2. As you can see that there are many NA values in this data, so I will clean the dataset and remove all the null values from it.
movie <- data.matrix(movie_metadata)
movie <- na.omit(movie)
Step 3. In this example, I have taken first 500 values from the data set for analysis.
smple <- movie[sample(nrow(movie),500),]
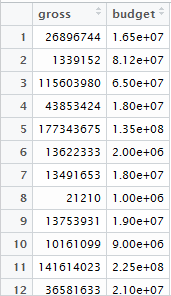
Step 4. Further, with the R code below, you can take two attributes budget and gross from the dataset to make clusters.
smple_short <- smple[c(9,23)]
smple_matrix <- data.matrix(smple_short)
View(smple_matrix)
Our dataset will look like below.
Step 5. Now, let’s determine the number of clusters.
wss <- (nrow(smple_matrix)-1)*sum(apply(smple_matrix,2,var))
for (i in 2:15) wss[i]<-sum(kmeans(smple_matrix,centers=i)$withinss)
plot(1:15, wss, type=”b”, xlab=”Number of Clusters”, ylab=”Within Sum of Squares”)
It gives the elbow plot as follows.
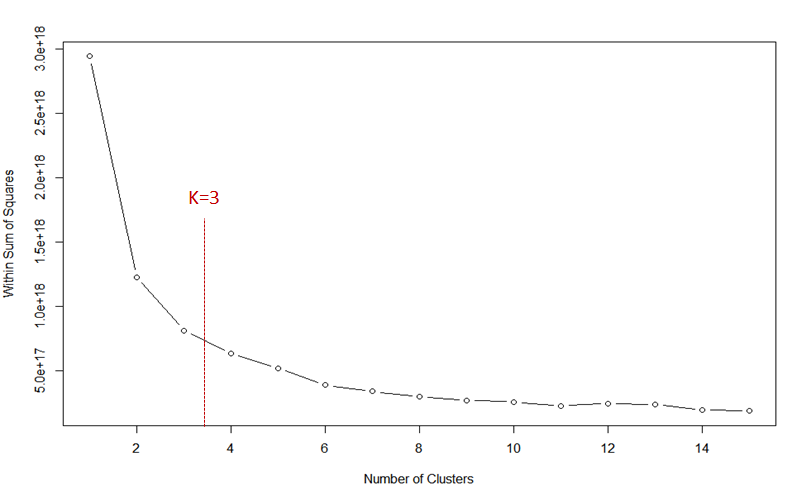
As you can see, there is a sudden drop in the value of WSS (within sum of squares) as the number of clusters increase from 1 to 3. Therefore, the bend at k=3 gives the stability in the value of WSS. We need to strike a balance between k and WSS. So, in this case, it comes at k=3.
Step 6. Now, with this cleaned data, I will apply inbuilt kmeans function in R to form clusters.
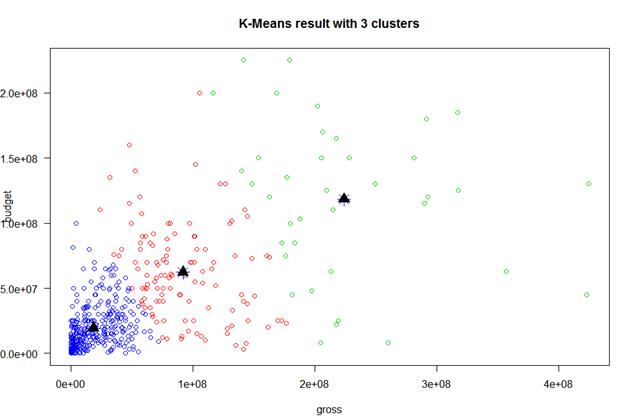
cl <- kmeans(smple_matrix,3,nstart=25)
You can plot the graph and cluster centroid using the following command.
plot(smple_matrix, col =(cl$cluster +1) , main=”k-means result with 2 clusters”, pch=1, cex=1, las=1)
points(cl$centers, col = “black”, pch = 17, cex = 2)
Step 7. Now, I will analyze how good is my cluster formation by using the command cl. It gives the following output.
Within cluster sum of squares by cluster:
[1] 3.113949e+17 2.044851e+17 2.966394e+17
(between_SS / total_SS = 72.4 %)
Here, total_SS is the sum of squared distances of each data point to the global sample mean whereas between_SS is the sum of squared distances of the cluster centroids to the global mean. Here, 72.4 % is a measure of the total variance in the data set. The goal of k-means is to maximize the between-group dispersion(between_SS). So, higher the percentage value, better is the model.
Step 8. For a more in-depth look at the clusters, we can examine the coordinates of the cluster centroids using the cl$centers component, which is as follows for gross and budget (in million).
gross budget
1 91791300 62202550
2 223901969 118289474
3 18428131 19360546
As per the cluster centroids, we can infer that cluster 1 and cluster 2 have more gross than the budget. Hence, we can infer that cluster 1 and cluster 2 made the profit while cluster 3 was in a loss.
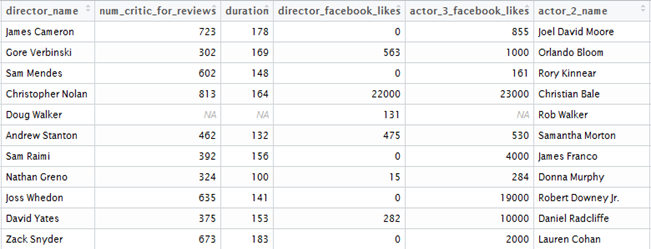
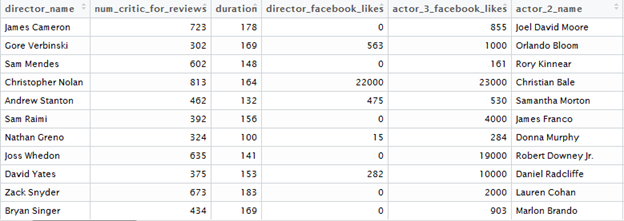
Step 9. Further, we can also examine how the cluster assignment relates to individual characteristics like director_facebook_likes(column 5) and movie_facebook_likes(column 28). I have taken the following 20 sample values.
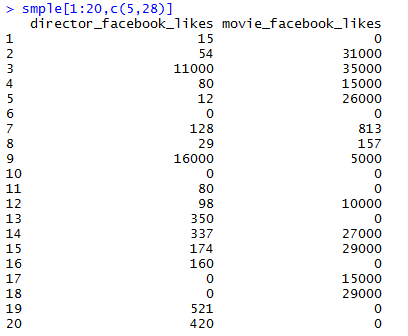
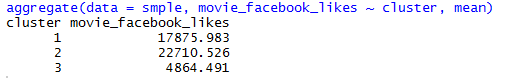
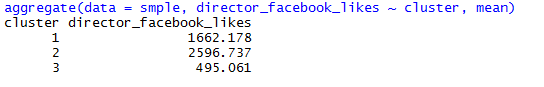
Using aggregate function we can look at other parameters of the data and draw insight. As you can see below that cluster 3 has least movie facebook likes as well as least director likes. This is expected because cluster 3 is already at a loss. Also, cluster 2 is doing a pretty good job by grabbing maximum likes and maximum gross.
Organizations like Netflix is making use of clustering to target movie clusters with maximum popularity among the viewers. They are selling these movies and making a huge profit out of this.
“We live and breathe the customer,” said Dave Hastings, Netflix’s director of product analytics. Currently, Netflix has 93.80 million worldwide streaming customers. They watch your every move very closely on the internet as to what movies you like, which director you prefer and then apply clustering to group the movies based on the popularity. Now, they recommend movies from the most popular cluster and enhance their business.
I urge you to see this k-means clustering algorithm video tutorial that explains all that we have discussed in the blog. Go ahead, enjoy the video and tell me what you think.
l hope you enjoyed reading my blog and understood k-means clustering. After doing projects using R, you can give a big boost to your resume. This will eventually lead to recruiters flocking around you. If you are interested to know more, then check out our Data Science certification training here, that comes with instructor-led live training and real-life project experience.


 Thank you for registering Join Edureka Meetup community for 100+ Free Webinars each month JOIN MEETUP GROUP
Hello! Can you please the movies metadala1 dataset in csv format which you used to explain k-means clustering in machine learning in 10 hours youtube video
The link to the movie data set is not working. Can you suggest an alternative link?
Q1: In this example, you have choose movie popularity criteria as gross & budget. In order to find movies whether gross is high and budget is less, one can do this using say SQL queries as well so why clustering is required in this case?
Q2: Can i have more than 2 attributes from dataset and apply K-Means to form cluster? If yes, how can i visualise this cluster?
Hey Sandeep,
Ans 1:
We haven’t chosen movie popularity criteria as gross and budget, we have clustered movie with similar gross and budget amount together, in order to create a group of movies with similar characteristics.
Ans 2:
Yes, you can group two attributes together, and visualize it, just plot the graph, to differentiate two clusters – you can do any of the following:
choose ‘pch’ which is symbol value, according to the cluster it is assigned to, the same way you can color them according to the cluster they are assigned to.
Hope this helps :)