Power BI Training Courses by PwC Academy
- 106k Enrolled Learners
- Weekend/Weekday
- Live Class
With Power BI you can connect to the world of data, create compelling and interactive reports, share your efforts with others, and expand their business intelligence efforts. The Power Query helps you to connect to sources, shape and transform the data to meet your needs.
This article provides an overview of the feature, but there’s way more to learn, and the more you play around with your data and understand the feature, the more powerful a tool you’ve got. Now, it’s not everything you need to know but the following topics are a great way to start out:
So, let’s get acquainted with this piece of technology.
So what exactly is Power Query?
Power Query is Microsoft’s Data Connectivity and Data Preparation technology. It basically, enables business users to access data stored in data sources seamlessly whilst, reshaping it to fit their needs. It’s easy to use, engaging, even convenient to use for the no-code users.
♠Note: A lot of you might get confused in M and DAX. Let me clarify once and for all that both of them are vastly different from one another. While M is a mashup query language used to query a multitude of data sources, DAX (or Data Analysis eXpressions) is a formula language which is used to work on data that is stored in tables.
Supported data sources include a wide range of file types, databases, Microsoft Azure services, and many other third-party online services. It also provides a Custom Connectors SDK so that third parties can create their own data connectors and seamlessly plug them into Power Query.
The Power Query Editor is the primary data preparation experience natively integrated into several Microsoft products, including but not limited to Microsoft Excel, Microsoft Power BI, Microsoft SQL Server Data Tools, etc. This, in turn, allows users to apply over 300 different data transformations by previewing data and selecting transformations in the user experience.

These data transformation capabilities are common across all data sources, despite the underlying data source limitations.
When transforming data with Power Query, you may encounter scenarios where Power BI loads data with incorrect formats or encoding from a CSV file. This can lead to garbled text, misplaced columns, or unexpected data types, impacting your analysis.
Power BI Desktop comes equipped with Power Query Editor. You can use the Power Query Editor to connect to one or many data sources, shape and transform the data. You could modify the data in hand to meet your needs, make it more usable, and then load that model into Power BI Desktop.
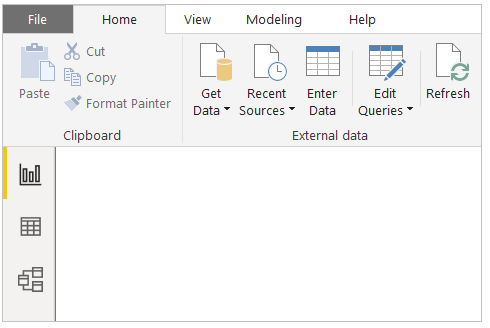
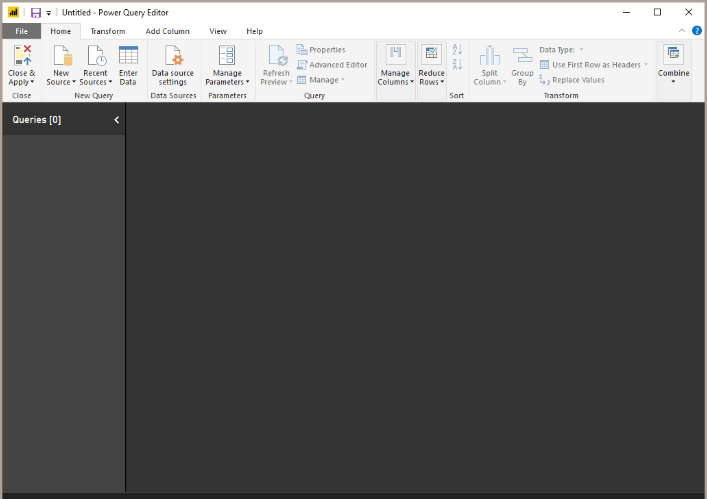
To get to the Query Editor, select Edit Queries from the Home tab of Power BI Desktop. With no data connections, the Query Editor appears quite dull, a blank pane as it should.

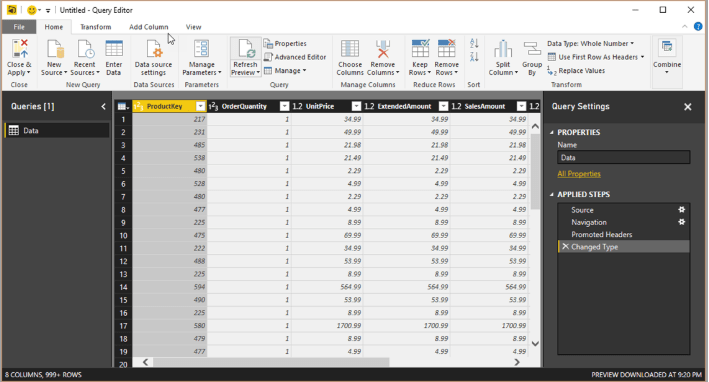
But once a query is loaded, this Editor view becomes way more interesting. If we connect to a data source, the Query Editor loads information about the data, which you can then begin to shape before basing your model on it.
This Edureka “Power Query Tutorial” video will help you to understand the value brought by the data connection technology into Power BI Desktop and how it provides a powerful tool for transforming and presenting business intelligence data.
Microsoft Power Query provides a powerful data import experience that encompasses many features. Power Query works with Analysis Services, Excel, and Power BI workbooks.
A core capability of Power Query is to filter and combine data from a rich collection of data sources that it supports. Any such data mashup is expressed using a functional, case sensitive language known as M Formula Language.
It is pretty similar to F# and is used to query a multitude of data sources. It contains commands to transform data and can return the results of the query to either an Excel table or Power BI data model.
Let’s get acquainted with the Query Editor.
So, once you’ve gotten to the query editor, you’ll have no data connections. The Query Editor appears as a blank pane, ready for data.

If you connect to this web data source, the Query Editor loads information about the data. You can then begin to shape and transform the same.
Once a data connection is established, the Query Editor appears to be something like the following:
Power Query Advanced Editor
If you want to see the code that the Query Editor is creating with each step or want to create your own shaping code, you can use the Advanced Editor.
When your query is where you want it, you can have the Editor apply the changes to the data model.

As progress is made, Power BI Desktop provides a dialogue to display its status.
Once you have your query, make sure your work is saved, Power BI Desktop can save your work in a .pbix file.
In this article, you learned about the Power Query feature, its various databases, and M language. You also got a brief idea on how to use Query Editor and Advanced Editor in Power BI Desktop whilst learning how to connect to data sources and save your query. When working with Power BI, you may notice that your DAX measures calculate correctly in Power BI Desktop, but return different results when published to Power BI Service. This discrepancy can be frustrating and may impact data accuracy in your reports.
Master the art of data visualization and analysis with our comprehensive Power BI Tutorial series.
To learn more concepts on Power BI, then check out our Power BI Training Certification which comes with instructor-led live training and real-life project experience. This training will help you understand Power BI in-depth and help you achieve mastery over the subject.
Related Questions
What are common pitfalls when using Power Query M language for data transformations?
How to select distinct values from multiple fields on MongoDB ?
What’s the best way to debug a DAX measure that’s producing incorrect results in visualizations?
Got a question for us? Please mention it in the comments section and we will get back to you.
 Thank you for registering Join Edureka Meetup community for 100+ Free Webinars each month JOIN MEETUP GROUP
edureka.co