Amazon CloudWatch is a monitoring service for AWS cloud resources and the applications you run on AWS. It is used to collect and track metrics, collect and monitor log files, and set alarms.
Before getting started with Amazon CloudWatch it’s important to know the items it enables the user to monitor:
- Amazon EC2 instances
- Amazon EBS volumes
- Elastic Load balancers
- AutoScaling groups
- Amazon RDS database instances in real-time
- Amazon SQS queues, SNS topics,
- AWS EMR job flows, Storage Gateway, DynamoDB tables
- Estimated AWS charges
With Amazon CloudWatch, the user can get:
- Up-to-minute statistics
- View graphs
- Set alarms for your metric data
- Use Auto Scaling to add/remove resources based on CloudWatch Metrics
Why is Amazon CloudWatch useful?
- Visibility into resource utilization
- Operational performance
- Overall demand patterns, including metrics such as CPU utilization, disk reads and writes, and network traffic.
Using CloudWatch
To get started with CloudWatch, the user signs up for Amazon EC2 service; once that is complete the registration for Amazon CloudWatch is automatically done and the feature can be accessed using the AWS Management Console.
There are two types available for EC2
Basic Monitoring – it provides monitoring of data every 5 minutes which is also free of cost.
Detailed Monitoring – charges you every minute.
One key point to understand is that Amazon CloudWatch is to monitor Amazon Service and not the user’s services. If the user has deployed a server Inside EC2, Amazon CloudWatch by default will not monitor it. An important point to note is that in Amazon, we don’t control the hardware. It monitors software but only for Amazon services.
Here are the steps to be followed to get started with Amazon CloudWatch
- Sign in to the AWS Management Console
- Click the launch instances button on the Amazon EC2 tab
- Select the AMI to launch an instance, select the key pair and configure the firewall
- Click on the ‘enable detailed CloudWatch monitoring for this instance’ checkbox. Click on the launch button
- Within minutes, the instance that you launched will show as running
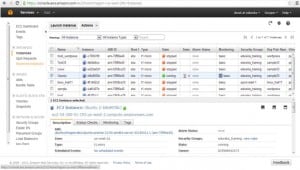
- Select the running instance from the list and click on the monitoring tab at the bottom
- The graphs for CPU, disk and network metrics are displayed for the instance you selected
Introduction to Amazon Cloudwatch
How Amazon Charges for CloudWatch?
It would charge per metrics. In EC2 there are 7 metrics. If it is basic monitoring it would be free of cost. If it is for detailed monitoring, it would charge 50 cents for each metric.
 How it works:
 How it works:
While using AMI we launch instance which has monitoring enabled in it. CloudWatch will keep monitoring resources and the alarm is set. Alarm is a trigger here. For example, if CPU utilization is more than 50% it will alert the user. The threshold level for each alarm is also set. It will then notify AutoScaling. From there we can trigger certain policies which will add or remove new instances. It will then be added to load balancer and will complete the scaling activity.
CloudWatch is nothing but a repository of data. It can receive data from two sources namely AWS Products and also the Custom Data. There are scripts available which we can configure in any machine in such a way that it would capture current data and send it to CloudWatch.
Where can it be useful?
For instance, if a person has a huge refrigeration plant, where multiple freezers are available, and the user wishes to be notified every time a freezer drops temperature. Here, the user can attach devices which will collect the temperature in constant interval and send the data in Amazon CloudWatch along with alarms.
The Alarm would be able to take 3 actions
- Autoscaling
- SNS (Simple Notification Service) – notifies through Email/SMS/http endpoint. In order to use webserver, the data has to be collected. For example, we go to run and enter the ‘perfmon’. It will give details like CPU utilization and other parameters which can be sent to Amazon. It would not monitor by default.
- EC2 Action
Here, the user’s infrastructure was not hosted in Amazon. A point to note is that if the user kept monitoring the CPU utilization, network I/O, he would capture the data and keep sending notification to the CloudWatch. The user had set up an alarm on a condition that whenever the CPU utilization is more than 70% , it must notify through SNS (Email+ http endpoint). The http endpoint was connected to a sensor device. So whenever a message came to the sensor device, the light will be red. Apart from that we can also view the notification using the AWS Console or create a Statistical Consumer where the data can be downloaded from CloudWatch and create its own tool. Amazon CloudWatch stores data only for two weeks. If the history data is required, it should be downloaded manually.
CloudWatch Monitoring:
- Basic Monitoring for Amazon EC2 instances: Ten pre-selected metrics at five-minute frequency, free of charge
- Detailed Monitoring for Amazon EC2 instances: Seven pre-selected metrics at one-minute frequency, for an additional charge
- Amazon EBS volumes: Ten pre-selected metrics at five-minute frequency, free of charge
- Elastic Load Balancers: Ten pre-selected metrics at one-minute frequency, free of charge
- Auto Scaling groups: Seven pre-selected metrics at one-minute frequency, optional and charged at standard pricing
- Amazon RDS DB instances: Thirteen pre-selected metrics at one-minute frequency, free of charge.
Metrics
- Namespaces: It is a grouping to know what this metric belongs to. For example: AWS/EC2, AWS/AutoScaling/ AWS/ELB
- Dimensions: Dimension is a name/value pair that you uniquely identify a metric. For example: AutoScalingGroupName, ImageId, InstanceID, InstanceType, Volume ID.
- Timestamps: To know what timestamp it had captured.
- Units: Unit represents the statistic’s unit of measure. For example: EC2 NetworkIn metric in bytes.
If you want to work as a cloud engineer or start your career in cloud computing, now is the time to do it. You may become a successful cloud engineer by obtaining the necessary qualifications. You may also take an online Cloud Computing Training.
Got a question for us? Mention them in the comments section and we will get back to you.
Related Posts: