Reshma AhmedReshma is a tech-savvy professional working as a Research Analyst at Edureka....Reshma is a tech-savvy professional working as a Research Analyst at Edureka. She is a DevOps evangelist, a Cloud enthusiast, a Big Data Hadoop...
In this Tableau interview questions and answers blog, I have collected the most frequently asked questions by interviewers. These questions are collected after consulting with top industry experts in the field of Data analytics and visualization. If you want to brush up with the Tableau basics, which I recommend you to do before going ahead with this Tableau Interview Questions for freshers and experienced, take a look at Tableau Tutorial blog.
Tableau Interview Questions & Answers | Tableau Career Path | Tableau Jobs | Edureka
This Edureka Tableau interview questions and answer tutorial gives you an overview of Tableau job market trends, career path in Tableau and how to get your dream Tableau job along with interview questions answered by a Tableau expert.
In case you have attended a Tableau interview in the recent past, do paste those Tableau developer interview questions in the comments section, and we’ll answer them ASAP. You can also comment below if you have any questions in your mind that you might face in your Tableau interview. In the meantime, maximize the data visualization career opportunities that will come your way by taking Tableau Training with Edureka. You can even get a Tableau certification after the course. Click below to know more.
This Tableau Interview questions is divided into the following parts:
Let’s begin this Tableau Interview Questions and Answers for Beginners level questions first.
Beginners Level Tableau Interview Questions for Freshers
Lets start on your Tableau journey with beginner-level Tableau interview questions crafted for freshers, enabling a solid foundation and confidence for entry-level roles.
1. What is the difference between Traditional BI Tools and Tableau?
Traditional BI Tools vs Tableau
Traditional BI Tools
Tableau
1. Architecture has hardware limitations.
1. Do not have dependencies.
2. Based on a complex set of technologies.
2. Based on Associative Search which makes it dynamic and fast
3. Do not support in-memory, multi-thread, multi-core computing.
3. Supports in memory when used with advanced technologies.
4. Has a predefined view of data.
4. Uses predictive analysis for various business operations.
It allows anyone to connect to the respective data.
Visualizes and creates interactive, shareable dashboards.
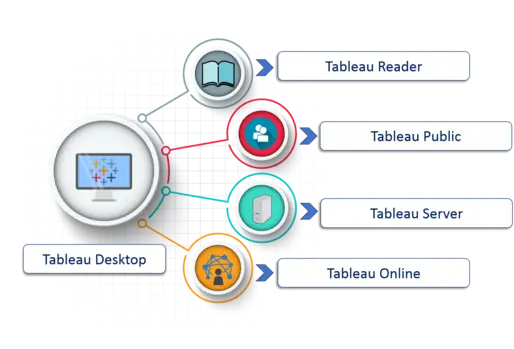
3. What are the different Tableau Products and what is the latest version of Tableau?
Here is the Tableau Product family.
(i)Tableau Desktop:
It is a self service business analytics and data visualization that anyone can use. It translates pictures of data into optimized queries. With tableau desktop, you can directly connect to data from your data warehouse for live upto date data analysis. You can also perform queries without writing a single line of code. Import all your data into Tableau’s data engine from multiple sources & integrate altogether by combining multiple views in a interactive dashboard.
(ii)Tableau Server:
It is more of an enterprise level Tableau software. You can publish dashboards with Tableau Desktop and share them throughout the organization with web-based Tableau server. It leverages fast databases through live connections.
(iii)Tableau Online:
This is a hosted version of Tableau server which helps makes business intelligence faster and easier than before. You can publish Tableau dashboards with Tableau Desktop and share them with colleagues.
(iv)Tableau Reader:
It’s a free desktop application that enables you to open and view visualizations that are built in Tableau Desktop. You can filter, drill down data but you cannot edit or perform any kind of interactions.
(v)Tableau Public:
This is a free Tableau software which you can use to make visualizations with but you need to save your workbook or worksheets in the Tableau Server which can be viewed by anyone.
Measures are the numeric metrics or measurable quantities of the data, which can be analyzed by dimension table. Measures are stored in a table that contain foreign keys referring uniquely to the associated dimension tables. The table supports data storage at atomic level and thus, allows more number of records to be inserted at one time. For instance, a Sales table can have product key, customer key, promotion key, items sold, referring to a specific event.
Dimensions are the descriptive attribute values for multiple dimensions of each attribute, defining multiple characteristics. A dimension table ,having reference of a product key form the table, can consist of product name, product type, size, color, description, etc.
6. What is the difference between .twb and .twbx extension?
A .twb is an xml document which contains all the selections and layout made you have made in your Tableau workbook. It does not contain any data.
A .twbx is a ‘zipped’ archive containing a .twb and any external files such as extracts and background images.
7. What are the different types of joins in Tableau?
The joins in Tableau are same as SQL joins. Take a look at the diagram below to understand it.
8. How many maximum tables can you join in Tableau?
You can join a maximum of 32 tables in Tableau.
9. What are the different connections you can make with your dataset?
We can either connect live to our data set or extract data onto Tableau.
Live: Connecting live to a data set leverages its computational processing and storage. New queries will go to the database and will be reflected as new or updated within the data.
Extract: An extract will make a static snapshot of the data to be used by Tableau’s data engine. The snapshot of the data can be refreshed on a recurring schedule as a whole or incrementally append data. One way to set up these schedules is via the Tableau server.
The benefit of Tableau extract over live connection is that extract can be used anywhere without any connection and you can build your own visualization without connecting to database.
10. What are shelves?
They are Named areas to the left and top of the view. You build views by placing fields onto the shelves. Some shelves are available only when you select certain mark types.
11. What are sets?
Sets are custom fields that define a subset of data based on some conditions. A set can be based on a computed condition, for example, a set may contain customers with sales over a certain threshold. Computed sets update as your data changes. Alternatively, a set can be based on specific data point in your view.
12. What are groups?
A group is a combination of dimension members that make higher level categories. For example, if you are working with a view that shows average test scores by major, you may want to group certain majors together to create major categories.
13. What is a hierarchical field?
A hierarchical field in tableau is used for drilling down data. It means viewing your data in a more granular level.
14. What is Tableau Data Server?
Tableau server acts a middle man between Tableau users and the data. Tableau Data Server allows you to upload and share data extracts, preserve database connections, as well as reuse calculations and field metadata. This means any changes you make to the data-set, calculated fields, parameters, aliases, or definitions, can be saved and shared with others, allowing for a secure, centrally managed and standardized dataset. Additionally, you can leverage your server’s resources to run queries on extracts without having to first transfer them to your local machine.
15. How can you create a dashboard in Tableau?
To create a dashboard in Tableau, follow these steps:
Connect to Data: Launch Tableau and connect to the data source you want to visualize. Tableau supports various data sources, including spreadsheets, databases, cloud services, and more.
Build Individual Worksheets: Create individual worksheets by dragging and dropping fields from the data pane onto the Rows and Columns shelves. Customize the visualization by choosing chart types, colors, labels, and formatting options.
Create a New Dashboard: Once you have built the necessary worksheets, navigate to the dashboard tab by clicking on the “New Dashboard” option on the bottom left corner.
Add Worksheets to Dashboard: Drag and drop the worksheets you created in step 2 onto the dashboard canvas. You can arrange them as desired and resize them to fit the layout.
Add Objects and Filters: Enhance the dashboard by adding objects like text, images, and web pages. You can also add filters to enable interactivity and allow users to explore the data.
Customize and Format: Format the dashboard to make it visually appealing and easy to understand. Tableau provides various formatting options for text, colors, size, and layout.
Create Dashboard Interactions: Set up interactivity between different worksheets in the dashboard. For example, you can create filter actions to update one worksheet based on selections in another.
Test and Refine: Preview the dashboard and test its functionality. Make any necessary adjustments to ensure that it provides the desired insights and meets your requirements.
Save and Share: Once the dashboard is complete, save it in Tableau format (.twb) or publish it to Tableau Server or Tableau Online for sharing with others.
By following these steps, you can create an interactive and visually appealing dashboard in Tableau, allowing users to explore and gain insights from your data visualization.
What is data blending in Tableau?
In Tableau, data blending is the process of combining data from different sources or links to make a single view that can be used for analysis. It is used when there is no direct link between the data sources or a key that they both share. Tableau finds similar dimensions and makes sensible connections between the main and secondary data sources. This lets users work with complicated sets of data and get insights from data that can’t be easily put together using standard joins. But there may be some limits to data blending, such as the possibility of data duplication and speed issues. Still, it is a powerful Tableau tool that lets you analyze many different datasets in depth.
What is the purpose of a parameter in Tableau?
In Tableau, a parameter is a dynamic placeholder that allows users to input values that can be used in calculations, filters, and various other aspects of a visualization. The purpose of a parameter is to make a Tableau dashboard or report more interactive and flexible by allowing users to control certain aspects of the data analysis without needing to modify the underlying data.
Key purposes and benefits of using parameters in Tableau:
Interactivity: Parameters enable interactivity in Tableau visualizations. Users can change the parameter value, and the visualization updates dynamically, providing real-time exploration of data.
Flexible Filtering: Parameters can be used as dynamic filters, allowing users to filter data by selecting values from a dropdown or inputting specific values.
Conditional Calculations: Parameters can be incorporated into calculations and formulas, making calculations dynamic and adaptable to user preferences.
Comparisons: Parameters facilitate comparing different scenarios or data subsets. Users can switch between various parameter values to see how different settings impact the visualization.
Storytelling: Parameters enhance storytelling capabilities by allowing users to interactively control the visual elements and view different perspectives of the data.
Dashboard Customization: Parameters allow users to customize dashboard elements, such as titles, captions, and labels, making the dashboards more personalized and user-friendly.
Ad Hoc Analysis: Parameters enable ad hoc analysis by allowing users to experiment with different data views without altering the original data or report.
Using parameters in Tableau provides a level of user control and flexibility, allowing for a more interactive and insightful data analysis experience. It empowers users to explore data, make data-driven decisions, and gain deeper insights from visualizations without requiring technical changes to the underlying data sources or calculations.
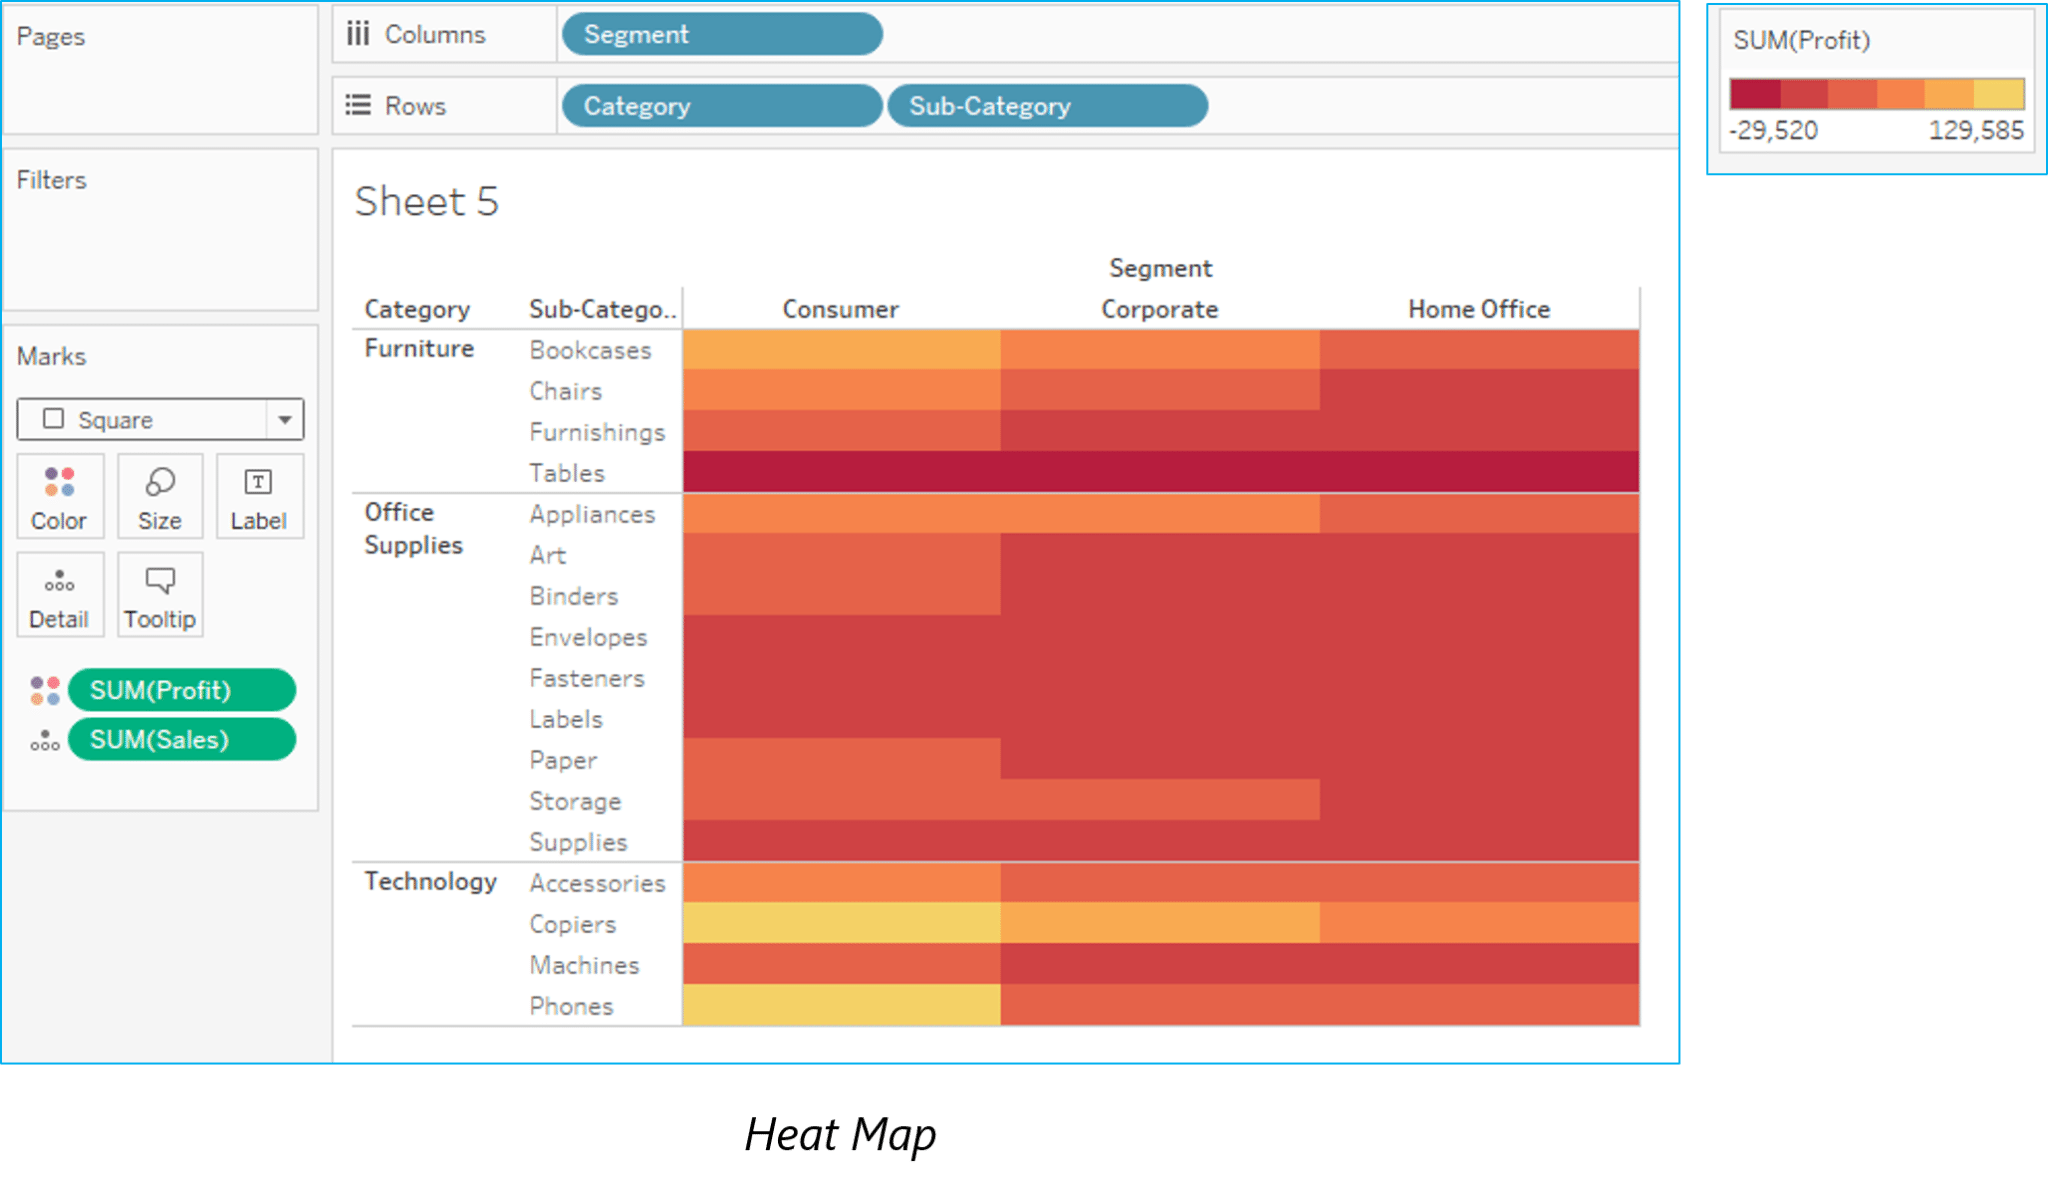
Define Heat Map.
A heat map is a type of color-coded matrix used in Tableau to graphically show data values along two axes. In this case, darker colors represent greater values while lighter hues represent lower ones. since a result, it is an effective instrument for data analysis and visualization, since it can be used to spot trends and patterns even in massive datasets.
Define LOD Expression.
LOD (Level of Detail) Expression in Tableau is a powerful feature that allows users to compute aggregations at different levels of granularity than the visualization’s primary data source. It provides the ability to control and manipulate the level of detail in calculations, regardless of the dimensions used in the view.
With LOD expressions, users can create calculations that consider specific dimensions while ignoring others, resulting in more precise and flexible aggregations. There are three types of LOD expressions in Tableau:
Fixed LOD: The fixed LOD expression allows users to compute an aggregation using specific dimensions, irrespective of the dimensions in the visualization. It is denoted by the `{FIXED}` keyword and enables users to create calculations that stay consistent across different levels of granularity.
Include LOD: The include LOD expression computes an aggregation that includes the specified dimensions in addition to the dimensions in the visualization. It is represented by the `{INCLUDE}` keyword and is useful when users want to perform calculations that consider specific dimensions in addition to the dimensions on the view.
Exclude LOD: The exclude LOD expression computes an aggregation excluding the specified dimensions from the dimensions in the visualization. It is denoted by the `{EXCLUDE}` keyword and is used to exclude specific dimensions while performing calculations.
LOD expressions are valuable in various scenarios, such as comparing subsets of data, creating dynamic filters, and achieving complex calculations without the need for data reshaping or aggregation at the data source level. They provide users with fine-grained control over calculations and enhance the analytical capabilities of Tableau.
List out Tableau File Extensions.
In Tableau, various file extensions are used to save and manage different types of files. Here are some common Tableau file extensions:
.twb: Tableau Workbook (.twb) files contain a single worksheet and its associated visualizations, calculations, and data connections. They are used to save individual Tableau worksheets and can be shared with others for analysis.
.twbx: Tableau Packaged Workbook (.twbx) files are similar to .twb files but include all the necessary data sources and files needed to view the workbook. They are used to package and share workbooks along with their data sources for easy distribution.
.tds: Tableau Data Source (.tds) files are XML-based files that store information about a data source connection. They contain the connection details, such as server information, database credentials, and query details, but do not include the actual data.
.tdsx: Tableau Packaged Data Source (.tdsx) files are similar to .tds files but include the actual data source along with its connection details. They are used to package and share data sources with others for easy access.
.tde: Tableau Data Extract (.tde) files are a proprietary file format used to store data in a highly compressed and optimized form. They are used to create extract files that improve performance by reducing data query times.
.twm: Tableau Window Metadata (.twm) files store metadata about Tableau window settings, such as window size, position, and the state of sheets and dashboards. These files help restore the layout and state of the Tableau window when reopened.
.tdc: Tableau Data Connection (.tdc) files are XML files used to customize and modify data connections. They can be used to specify custom connection settings and configurations for specific data sources.
.tfl: Tableau Font List (.tfl) files are XML-based files that store font information used in Tableau workbooks. These files help maintain font consistency when sharing workbooks across different computers.
These are some of the common Tableau file extensions that users encounter while working with Tableau workbooks, data sources, and related files. Each extension serves a specific purpose in the Tableau ecosystem.
Define TreeMap.
TreeMaps are a type of data visualization in Tableau that display hierarchical data as nested rectangles where the size and color of the rectangles indicate the values associated with the categories, revealing both the structure of the data and its quantitative aspects.
What is a parameter Tableau? And how does it work?
In Tableau, a parameter is a dynamic placeholder that allows users to input values that can be used in calculations, filters, and various other aspects of a visualization. It is a powerful feature that enhances the interactivity and flexibility of Tableau dashboards and reports.
How Parameters Work in Tableau:
Creating a Parameter: To create a parameter in Tableau, you define its data type (integer, float, string, date, etc.) and set its allowable values, which can be a range, list, or a set of individual values.
Interactivity: Once a parameter is created, it appears as a control element on the Tableau dashboard. Users can interact with the parameter by changing its value using a dropdown, slider, or input field.
Parameter in Calculations: Parameters can be incorporated into calculations and formulas in Tableau. For example, you can create a calculated field that uses a parameter to dynamically adjust the calculation based on the user’s input.
Dynamic Filters: Parameters can be used as dynamic filters, allowing users to filter data by selecting values from the parameter dropdown. This allows users to interactively control what data they want to view.
Comparisons and Scenarios: Parameters are valuable for creating comparisons and scenarios. Users can change the parameter value to view different subsets of data or compare different aspects of the visualization.
Customizing Dashboards: Parameters can also be used to customize dashboard elements, such as titles, captions, and labels. This helps in creating more personalized and user-friendly dashboards.
Storytelling: Parameters enhance storytelling capabilities by allowing users to interactively control visual elements and view different perspectives of the data.
Parameters provide a level of user control and flexibility, allowing for a more interactive and insightful data analysis experience. They empower users to explore data, make data-driven decisions, and gain deeper insights from visualizations without needing to modify the underlying data or calculations.
What are the different data types in Tableau?
In Tableau, data types define the nature and format of the data present in each column of a dataset. Tableau supports various data types to accommodate different types of data. Here are the main data types in Tableau:
Integer: Whole numbers without decimal points, used for counting or ordinal values.
Float: Numeric values with decimal points, used for continuous numerical data.
String (Text): Alphanumeric characters, used for text data, names, labels, and categorical values.
Boolean: Logical values representing True or False, used for binary data or conditional statements.
Date: Dates without time information, used for date-based analysis and time series.
Datetime: Dates with time information, used for more granular time-based analysis.
Geographic Role: Special data type for geographical data, such as latitude and longitude, used for creating maps.
Duration: Represents time duration, used for calculating time differences.
Currency: Used to display currency symbols and values with proper formatting.
Percentage: Used for percentage values with formatting to show percentage symbol.
Whole Number (Discrete): Similar to Integer but treated as a discrete (categorical) dimension.
Decimal Number (Discrete): Similar to Float but treated as a discrete (categorical) dimension.
Ordinal: Categorical data with a specific order, used for data with inherent ranking.
Measure Names: Special data type used for representing the names of measures in Tableau.
Measure Values: Special data type used for representing the values of measures in Tableau.
Each data type serves a specific purpose in Tableau and affects how the data is interpreted and displayed in visualizations. Choosing the correct data type is crucial for accurate analysis and effective data visualization in Tableau.
Give a brief about the tableau dashboard.
A Tableau dashboard is a collection of visualizations and worksheets that provide a consolidated view of data insights and analysis. It is a user-friendly and interactive interface that allows users to explore, interact, and gain insights from data in a visually appealing manner.
Key features of a Tableau dashboard:
Multiple Visualizations: A dashboard can contain multiple visualizations, such as charts, graphs, tables, and maps, organized on a single screen to provide a comprehensive view of the data.
Interactivity: Dashboards are highly interactive, allowing users to drill down, filter, sort, and highlight data points to explore different aspects of the data.
Data Filters: Users can apply data filters to focus on specific subsets of data, making it easier to analyze and interpret relevant information.
Layout and Design: Tableau dashboards offer flexible layout and design options, allowing users to arrange visualizations, add text, images, and web pages to create a visually appealing and informative dashboard.
Parameter Controls: Parameters can be added to dashboards to enable dynamic user control over calculations, filters, and other aspects of data analysis.
Real-time Updates: Dashboards in Tableau are connected to live data sources or data extracts, ensuring that the visualizations update in real-time as the underlying data changes.
Storytelling: Dashboards can be used to tell data-driven stories, presenting insights and findings in a logical and engaging manner.
Sharing and Collaboration: Tableau dashboards can be shared with others within the organization or published to Tableau Server or Tableau Online for wider dissemination and collaboration.
Tableau dashboards are widely used in data analysis, business intelligence, and data visualization projects, as they provide a clear and concise representation of complex data, enabling users to make data-driven decisions more effectively.
What is the Hierarchy in Tableau?
In Tableau, a hierarchy is a logical arrangement of fields that represents a parent-child relationship between dimensions. It allows users to create drill-down or roll-up views of data, enabling them to explore data at different levels of granularity.
Key points about hierarchies in Tableau:
Parent-Child Relationship: Hierarchies are created by grouping related dimensions together to form a parent-child relationship. The hierarchy has one or more levels, with each level representing a different dimension.
Drill-Down and Roll-Up: With hierarchies, users can drill down to view more detailed data or roll up to view aggregated data at higher levels. For example, a time hierarchy might have levels such as Year, Quarter, Month, and Day, allowing users to drill down from Year to Quarter, Month, and Day.
Nested Structure: Hierarchies are represented as a nested structure in the Tableau data pane, with the parent dimension at the top and the child dimensions indented below.
Creating Hierarchies: To create a hierarchy, users simply drag and drop dimensions onto each other in the data pane to form the desired parent-child relationship.
Hierarchy Sorting: Tableau automatically sorts hierarchies in ascending or descending order based on the data. Users can also customize the sorting order if needed.
Hierarchical Filters: When filtering data, hierarchical filters allow users to filter data at different levels within the hierarchy, making it easier to focus on specific subsets of data.
Hierarchies in Tableau are useful for organizing and presenting data in a structured manner, allowing users to explore data at different levels of detail and gain insights from various perspectives. They are commonly used in data analysis and data visualization to provide users with a flexible and interactive way to navigate and analyze data at different hierarchical levels.
What is a Column chart?
In Tableau, a column chart is a type of data visualization that represents data using vertical bars. Each column corresponds to a specific category or dimension, and the height of the column indicates the value of a measure associated with that category.
Key features of a column chart in Tableau:
Vertical Bars: The primary feature of a column chart is the vertical bars, where the length or height of each bar represents the magnitude of the associated measure.
Categorical Data: Column charts are suitable for visualizing categorical data, where each category is represented by a separate column.
Aggregated Values: The height of the columns can represent aggregated values such as sum, average, count, or any other measure based on the data analysis requirements.
Grouped or Stacked Columns: Tableau allows users to create grouped or stacked column charts. In a grouped column chart, each category has its set of columns side-by-side, while in a stacked column chart, the columns are stacked on top of each other for each category.
Color Encoding: Users can use color to encode additional information, such as differentiating between subcategories or segments within a column.
Axis Labels and Titles: Column charts come with axis labels and titles to provide context and explanation for the data being visualized.
Column charts are commonly used to compare values between different categories and identify patterns or trends in the data. They are effective for presenting data in a straightforward and intuitive manner, making them a popular choice for data analysis and reporting tasks in Tableau.
What is the Line Chart?
In Tableau, a line chart is a type of data visualization that represents data using connected data points plotted on a Cartesian coordinate system. It is used to display trends and patterns in the data over time or any continuous dimension.
Key features of a line chart in Tableau:
Connected Data Points: The primary feature of a line chart is the line that connects the data points, representing the trend or progression of the measure over the continuous dimension.
Time Series Analysis: Line charts are especially useful for time series analysis, where the X-axis represents time or date and the Y-axis represents the values of the measure.
Continuous Data: Line charts are suitable for visualizing continuous data, such as temperature, sales, stock prices, or any other data that varies continuously.
Smooth or Stepped Lines: Tableau provides options to display lines as smooth curves or stepped lines, depending on the data and the desired visualization.
Data Labels and Annotations: Users can add data labels and annotations to highlight specific data points or significant events.
Trend Lines and Forecasting: Tableau allows users to add trend lines and perform forecasting to visualize and predict future trends based on historical data.
Color Encoding: Users can use color to encode additional information, such as differentiating between multiple lines representing different categories or groups.
Line charts are effective for visualizing and analyzing data that shows trends, changes over time, or any continuous progression. They are widely used for data exploration, time-based analysis, and making data-driven decisions based on patterns and insights revealed by the visualization.
What is a Stacked Bar chart?
A stacked bar chart is a type of data visualization that represents data using horizontal or vertical bars, where each bar is divided into segments or stacked sections to show the contribution of different categories or subgroups to the total value.
Key features of a stacked bar chart:
Segments (Stacks): The primary feature of a stacked bar chart is the segments or stacks within each bar. Each segment represents a specific category or subgroup, and the length or height of the segment corresponds to the value of that category.
Total Value: The total height (for vertical bars) or width (for horizontal bars) of the bar represents the total value, which is the sum of the values of all segments.
Categorical Data: Stacked bar charts are suitable for visualizing categorical data with multiple subcategories.
Comparison of Proportions: Stacked bar charts are useful for comparing the proportions of different subcategories within each category.
Color Encoding: Each segment in the stacked bar chart is typically assigned a different color to visually differentiate between the subcategories.
Axis Labels and Titles: Stacked bar charts come with axis labels and titles to provide context and explanation for the data being visualized.
Stacked bar charts are commonly used to display the composition of data, showing how different subcategories contribute to the whole. They are effective for visualizing data with multiple categories and subgroups, making it easy to identify patterns and comparisons within the data. However, it’s important to use stacked bar charts with caution, as they can become visually cluttered and less effective when dealing with large numbers of subcategories or complex data.
What is an Area Chart?
An area chart is a type of data visualization that represents data using a series of data points connected by a line, with the space between the line and the axis filled with color to form a shaded area. It is used to display the cumulative data over time or any continuous dimension and is similar to a line chart, but with the area under the line filled.
Key features of an area chart:
Connected Data Points: Like a line chart, an area chart has data points connected by a line, representing the trend or progression of the measure over time or any continuous dimension.
Cumulative Representation: The area between the line and the axis is filled with color, representing the cumulative sum of the measure at each data point.
Time Series Analysis: Area charts are commonly used for time series analysis, where the X-axis represents time or date and the Y-axis represents the values of the measure.
Continuous Data: Area charts are suitable for visualizing continuous data, such as population growth, revenue over time, or any data that varies continuously.
Stacked Area Chart: Tableau provides the option to create a stacked area chart, where multiple area charts are stacked on top of each other to show the contribution of different categories or subgroups to the total.
Color Encoding: The color of the area can be used to differentiate between multiple lines representing different categories or groups.
Area charts are effective for visualizing data trends, showing the cumulative impact of data over time, and comparing the contributions of different categories to the total. They are widely used in data analysis, time-based analysis, and forecasting to gain insights into data patterns and changes over time.
What is Context Filter and show the steps on how to create the Context Filter Tableau?
In Tableau, a context filter is a special type of data filter that allows you to control the order in which filters are applied to the data. It creates a temporary table containing only the data that passes through the context filter, and all subsequent filters are applied to this reduced dataset. Context filters are particularly useful when dealing with complex data relationships and large datasets, as they help improve performance and optimize query execution.
Steps to create a context filter in Tableau:
Connect to Data: Start by connecting to your data source in Tableau and importing the relevant data.
Create Initial Filters: Before creating the context filter, you may want to add some initial filters to your visualization to narrow down the data.
Right-click on a Filter: In the data pane or on the Filters shelf, right-click on the filter you want to convert to a context filter.
Select “Add to Context”: From the context menu that appears, select “Add to Context.” This action will change the filter icon, indicating that it has been added to the context.
Order of Filters: Move the context filter to the top of the list of filters on the Filters shelf. This ensures that it will be applied first when the visualization is computed.
Recompute the Visualization: After adding the context filter, recompute the visualization by clicking the “Refresh” or “Run” button on the toolbar to see the impact of the context filter on your data.
By adding a context filter, you’re instructing Tableau to create a temporary table with the data that meets the conditions of the context filter, and then apply subsequent filters only to this reduced dataset. This can significantly improve performance, especially when dealing with complex data models and large datasets.
Keep in mind that using context filters should be done with consideration, as they can impact the accuracy of certain calculations and aggregations, depending on the order in which filters are applied. It is essential to understand the data and the specific requirements of your analysis before applying context filters.
Intermediate Tableau Developer Interview Questions and Answers
Explore a curated collection of Tableau interview questions and answers tailored for intermediate-level developers, designed to deepen expertise and excel in interviews.
31. What is Tableau Data Engine?
Tableau Data Engine is a really cool feature in Tableau. Its an analytical database designed to achieve instant query response, predictive performance, integrate seamlessly into existing data infrastructure and is not limited to load entire data sets into memory.
If you work with a large amount of data, it does takes some time to import, create indexes and sort data but after that everything speeds up. Tableau Data Engine is not really in-memory technology. The data is stored in disk after it is imported and the RAM is hardly utilized.
32. What are the different filters in Tableau and how are they different from each other?
In Tableau, filters are used to restrict the data from database.
The different filters in Tableau are: Quick , Context and Normal/Traditional filter are:
Normal Filter is used to restrict the data from database based on selected dimension or measure. A Traditional Filter can be created by simply dragging a field onto the ‘Filters’ shelf.
Quick filter is used to view the filtering options and filter each worksheet on a dashboard while changing the values dynamically (within the range defined) during the run time.
Context Filter is used to filter the data that is transferred to each individual worksheet. When a worksheet queries the data source, it creates a temporary, flat table that is uses to compute the chart. This temporary table includes all values that are not filtered out by either the Custom SQL or the Context Filter.
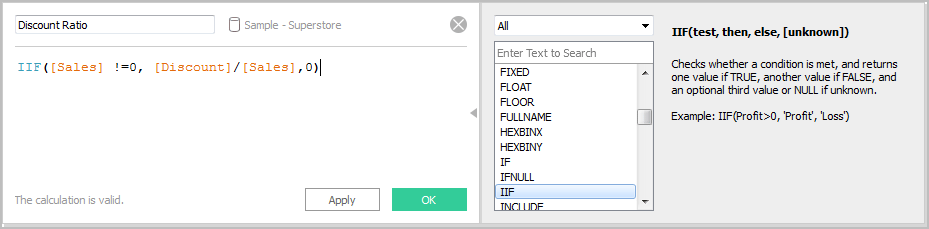
33. How to create a calculated field in Tableau?
Click the drop down to the right of Dimensions on the Data pane and select “Create > Calculated Field” to open the calculation editor.
Name the new field and create a formula.
Take a look at the example below:
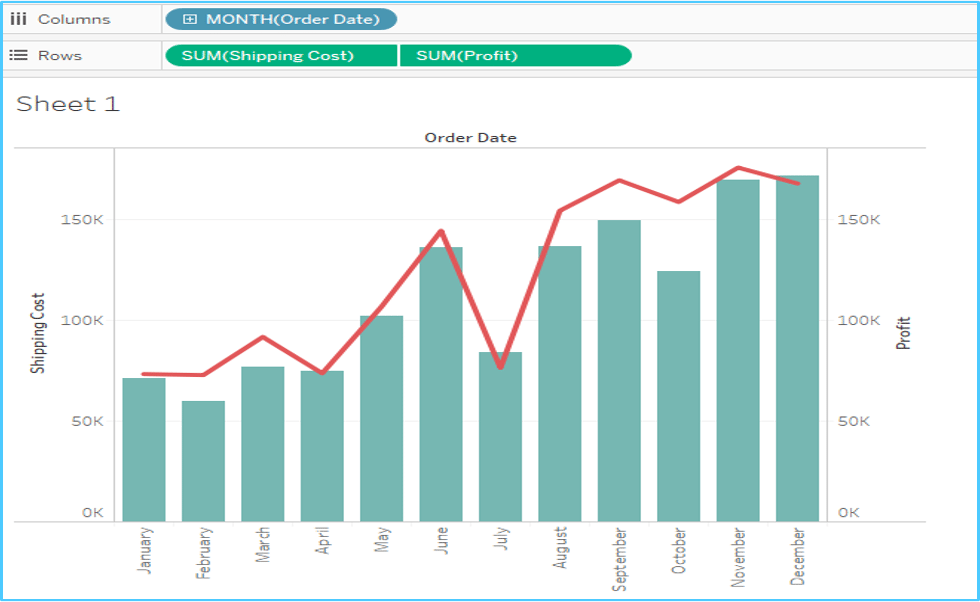
34. What is a dual axis?
Dual Axis is an excellent phenomenon supported by Tableau that helps users view two scales of two measures in the same graph. Many websites like Indeed.com and other make use of dual axis to show the comparison between two measures and their growth rate in a septic set of years. Dual axes let you compare multiple measures at once, having two independent axes layered on top of one another. This is how it looks like:
35. What is the difference between a tree map and heat map?
A heat map can be used for comparing categories with color and size. With heat maps, you can compare two different measures together.
A tree map also does the same except it is considered a very powerful visualization as it can be used for illustrating hierarchical data and part-to-whole relationships.
36. What is disaggregation and aggregation of data?
The process of viewing numeric values or measures at higher and more summarized levels of the data is called aggregation. When you place a measure on a shelf, Tableau automatically aggregates the data, usually by summing it. You can easily determine the aggregation applied to a field because the function always appears in front of the field’s name when it is placed on a shelf. For example, Sales becomes SUM(Sales). You can aggregate measures using Tableau only for relational data sources. Multidimensional data sources contain aggregated data only. In Tableau, multidimensional data sources are supported only in Windows.
According to Tableau, Disaggregating your data allows you to view every row of the data source which can be useful when you are analyzing measures that you may want to use both independently and dependently in the view. For example, you may be analyzing the results from a product satisfaction survey with the Age of participants along one axis. You can aggregate the Age field to determine the average age of participants or disaggregate the data to determine what age participants were most satisfied with the product.
37. What is the difference between joining and blending in Tableau?
Joining term is used when you are combining data from the same source, for example, worksheet in an Excel file or tables in Oracle database
While blending requires two completely defined data sources in your report.
38. What are Extracts and Schedules in Tableau server?
Data extracts are the first copies or subdivisions of the actual data from original data sources. The workbooks using data extracts instead of those using live DB connections are faster since the extracted data is imported in Tableau Engine.After this extraction of data, users can publish the workbook, which also publishes the extracts in Tableau Server. However, the workbook and extracts won’t refresh unless users apply a scheduled refresh on the extract. Scheduled Refreshes are the scheduling tasks set for data extract refresh so that they get refreshed automatically while publishing a workbook with data extract. This also removes the burden of republishing the workbook every time the concerned data gets updated.
39. How to view underlying SQL Queries in Tableau?
Viewing underlying SQL Queries in Tableau provides two options:
Create a Performance Recording to record performance information about the main events you interact with workbook. Users can view the performance metrics in a workbook created by Tableau. Help -> Settings and Performance -> Start Performance Recording Help -> Setting and Performance -> Stop Performance Recording.
Reviewing the Tableau Desktop Logs located at C:UsersMy DocumentsMy Tableau Repository. For live connection to data source, you can check log.txt and tabprotosrv.txt files. For an extract, check tdeserver.txt file.
40. How to do Performance Testing in Tableau?
Performance testing is again an important part of implementing tableau. This can be done by loading Testing Tableau Server with TabJolt, which is a “Point and Run” load generator created to perform QA. While TabJolt is not supported by tableau directly, it has to be installed using other open source products.
41. Name the components of a Dashboard.
Horizontal – Horizontal layout containers allow the designer to group worksheets and dashboard components left to right across your page and edit the height of all elements at once.
Vertical – Vertical containers allow the user to group worksheets and dashboard components top to bottom down your page and edit the width of all elements at once.
Text – All textual fields.
Image Extract – A Tableau workbook is in XML format. In order to extracts images, Tableau applies some codes to extract an image which can be stored in XML.
Web [URL ACTION] – A URL action is a hyperlink that points to a Web page, file, or other web-based resource outside of Tableau. You can use URL actions to link to more information about your data that may be hosted outside of your data source. To make the link relevant to your data, you can substitute field values of a selection into the URL as parameters.
42. How to remove ‘All’ options from a Tableau auto-filter?
The auto-filter provides a feature of removing ‘All’ options by simply clicking the down arrow in the auto-filter heading. You can scroll down to ‘Customize’ in the dropdown and then uncheck the ‘Show “All” Value’ attribute. It can be activated by checking the field again.
43. How to add Custom Color to Tableau?
Adding a Custom Color refers to a power tool in Tableau. Restart you Tableau desktop once you save .tps file. From the Measures pane, drag the one you want to add color to Color. From the color legend menu arrow, select Edit Colors. When a dialog box opens, select the palette drop-down list and customize as per requirement.
44. What is TDE file?
TDE is a Tableau desktop file that contains a .tde extension. It refers to the file that contains data extracted from external sources like MS Excel, MS Access or CSV file. There are two aspects of TDE design that make them ideal for supporting analytics and data discovery.
Firstly, TDE is a columnar store.
The second is how they are structured which impacts how they are loaded into memory and used by Tableau. This is an important aspect of how TDEs are “architecture aware”. Architecture-awareness means that TDEs use all parts of your computer memory, from RAM to hard disk, and put each part to work what best fits its characteristics.
45. Mention whether you can create relational joins in Tableau without creating a new table?
Yes, one can create relational joins in tableau without creating a new table.
46. How to automate reports?
You need to publish report to tableau server, while publishing you will find one option to schedule reports.You just need to select the time when you want to refresh data.
47. What is Assume referential integrity?
In some cases, you can improve query performance by selecting the option to Assume Referential Integrity from the Data menu. When you use this option, Tableau will include the joined table in the query only if it is specifically referenced by fields in the view.
48. Explain when would you use Joins vs. Blending in Tableau?
If data resides in a single source, it is always desirable to use Joins. When your data is not in one place blending is the most viable way to create a left join like the connection between your primary and secondary data sources.
49. What is default Data Blending Join?
Data blending is the ability to bring data from multiple data sources into one Tableau view, without the need for any special coding. A default blend is equivalent to a left outer join. However, by switching which data source is primary, or by filtering nulls, it is possible to emulate left, right and inner joins.
50. What do you understand by blended axis?
In Tableau, measures can share a single axis so that all the marks are shown in a single pane. Instead of adding rows and columns to the view, when you blend measures there is a single row or column and all of the values for each measure is shown along one continuous axis. We can blend multiple measures by simply dragging one measure or axis and dropping it onto an existing axis.
51. What is story in Tableau?
A story is a sheet that contains a sequence of worksheets or dashboards that work together to convey information. You can create stories to show how facts are connected, provide context, demonstrate how decisions relate to outcomes, or simply make a compelling case. Each individual sheet in a story is called a story point.
52. What is the difference between discrete and continuous in Tableau?
There are two types of data roles in Tableau – discrete and continuous dimension.
Discrete data roles are values that are counted as distinct and separate and can only take individual values within a range. Examples: number of threads in a sheet, customer name or row ID or State. Discrete values are shown as blue pills on the shelves and blue icons in the data window.
Continuous data roles are used to measure continuous data and can take on any value within a finite or infinite interval. Examples: unit price, time and profit or order quantity. Continuous variables behave in a similar way in that they can take on any value. Continuous values are shown as green pills.
53.How to create stories in Tableau?
There are many ways to create story in Tableau. Each story point can be based on a different view or dashboard, or the entire story can be based on the same visualization, just seen at different stages, with different marks filtered and annotations added. You can use stories to make a business case or to simply narrate a sequence of events.
Click the New Story tab.
In the lower-left corner of the screen, choose a size for your story. Choose from one of the predefined sizes, or set a custom size, in pixels.
By default, your story gets its title from its sheet name. To edit it, double-click the title. You can also change your title’s font, color, and alignment. Click Apply to view your changes.
To start building your story, drag a sheet from the Story tab on the left and drop it into the center of the view
Click Add a caption to summarize the story point.
To highlight a key takeaway for your viewers, drag a text object over to the story worksheet and type your comment.
To further highlight the main idea of this story point, you can change a filter or sort on a field in the view, then save your changes by clicking Update above the navigator box.
54. What is the DRIVE Program Methodology?
Tableau Drive is a methodology for scaling out self-service analytics. Drive is based on best practices from successful enterprise deployments. The methodology relies on iterative, agile methods that are faster and more effective than traditional long-cycle deployment.
A cornerstone of this approach is a new model of partnership between business and IT.
55. How to use group in calculated field?
By adding the same calculation to ‘Group By’ clause in SQL query or creating a Calculated Field in the Data Window and using that field whenever you want to group the fields.
Using groups in a calculation. You cannot reference ad-hoc groups in a calculation.
Blend data using groups created in the secondary data source: Only calculated groups can be used in data blending if the group was created in the secondary data source.
Use a group in another workbook. You can easily replicate a group in another workbook by copy and pasting a calculation.
56. Mention what is the difference between published data sources and embedded data sources in Tableau?
The difference between published data source and embedded data source is that,
Published data source: It contains connection information that is independent of any workbook and can be used by multiple workbooks.
Embedded data source: It contains connection information and is associated with a workbook.
57. Mention what are different Tableau files?
Different Tableau files include:
Workbooks: Workbooks hold one or more worksheets and dashboards
Bookmarks: It contains a single worksheet and its an easy way to quickly share your work
Packaged Workbooks: It contains a workbook along with any supporting local file data and background images
Data Extraction Files: Extract files are a local copy of a subset or entire data source
Data Connection Files: It’s a small XML file with various connection information
Tableau Full Course – Learn Tableau in 6 Hours | Tableau Training for Beginners | Edureka
Advanced Tableau Interview Questions for Experienced Professional
Now Lets explore some advanced tableau interview questions and answers for Experienced Professional.
58. How to embed views onto Webpages?
You can embed interactive Tableau views and dashboards into web pages, blogs, wiki pages, web applications, and intranet portals. Embedded views update as the underlying data changes, or as their workbooks are updated on Tableau Server. Embedded views follow the same licensing and permission restrictions used on Tableau Server. That is, to see a Tableau view that’s embedded in a web page, the person accessing the view must also have an account on Tableau Server.
Alternatively, if your organization uses a core-based license on Tableau Server, a Guest account is available. This allows people in your organization to view and interact with Tableau views embedded in web pages without having to sign in to the server. Contact your server or site administrator to find out if the Guest user is enabled for the site you publish to.
You can do the following to embed views and adjust their default appearance:
Get the embed code provided with a view: The Share button at the top of each view includes embed code that you can copy and paste into your webpage. (The Share button doesn’t appear in embedded views if you change the showShareOptions parameter to false in the code.)
Customize the embed code: You can customize the embed code using parameters that control the toolbar, tabs, and more. For more information, see Parameters for Embed Code.
Use the Tableau JavaScript API: Web developers can use Tableau JavaScript objects in web applications. To get access to the API, documentation, code examples, and the Tableau developer community, see the Tableau Developer Portal.
59. Design a view in a map such that if user selects any state, the cities under that state has to show profit and sales.
According to your question you must have state, city, profit and sales fields in your dataset.
Step 1: Double click on the state field
Step 2: Drag the city and drop it into Marks card.
Step 3: Drag the sales and drop it into size.
Step 4: Drag profit and drop it into color.
Step 5: Click on size legend and increase the size.
Step 6: Right click on state field and select show quick filter.
Step 7: Select any state now and check the view.
60. Think that I am using Tableau Desktop & have a live connection to Cloudera Hadoop data. I need to press F5 to refresh the visualization. Is there anyway to automatically refresh visualization every ‘x’ seconds instead of pressing F5?
Here is an example of refreshing the dashboard for every 5 seconds.
All you need to do is replace the api src and server url with yours.
<!DOCTYPE html>

<html lang="en">

<head>

<title>Tableau JavaScript API </title>

<script type="text/javascript" src="http://servername/javascripts/api/tableau_v8.js"></script>

</head>

<div id="tableau Viz"></div>

<script type='text/javascript'>

var placeholderDiv = document.getElementById("tableau Viz");

var url = "http://servername/t/311/views/Mayorscreenv5/Mayorscreenv2";

var options={

hideTabs:True,

width:"100%",

height:"1000px"

};

var viz= new tableauSoftware.Viz(placeholderDiv,url,options);

setInterval (function() {viz.refreshDataAsync()},5000);

</script>

</body>

</html>
Some Additional Tricky Tableau Developer Interview Questions
Here are some tricky Tableau Interview questions which are frequently asked in interview:
61. Suppose my license expires today, will users be able to view dashboards or workbooks which I published in the server earlier?
If your server license expires today, your username on the server will have the role ‘unlicensed’ which means you cannot access but others can. The site admin can change the ownership to another person so that the extracts do not fail.
62. Is Tableau software good for strategic acquisition?
Yes! For sure. It gives you data insight to the extent that other tools can’t. Moreover, it also helps you to plan and point the anomalies and improvise your process for betterment of your company.
63. Can we place an excel file in a shared location and and use it to develop a report and refresh it in regular intervals?
Yes, we can do it. But for better performance we should use Extract.
64. Can Tableau be installed on MacOS?
Yes, Tableau Desktop can be installed on both on Mac and Windows Operating System.
65. What is the maximum no. of rows Tableau can utilize at one time?
Tableau is not restricted by the no. of rows in the table. Customers use Tableau to access petabytes of data because it only retrieves the rows and columns needed to answer your questions.
66. When publishing workbooks on Tableau online, sometimes a error about needing to extract appears. Why does it happen occasionally?
This happens when a user is trying to publish a workbook that is connected to an internal server or a file stored on a local drive, such as a SQL server that is within a company’s network.
I hope that these Tableau Interview Questions were helpful to you. I will be coming up with more Tableau blogs for you all soon.
If you wish to master Business Intelligence tools, Edureka has a curated Business Intelligence Course which covers various concepts of data visualization in depth, including conditional formatting, scripting, data ware housing, power bi, linking charts, dashboard integration, Tableau integration with R, and more. It comes with 24*7 support to guide you throughout your learning period. New batches are starting soon.
Got a question for us? Please mention it in the comments section, and we will get back to you at the earliest.
Hey Subba Reddy, thanks for checking out our blog. We’re glad you liked it. You can check out our interview questions tutorial here: https://www.youtube.com/watch?v=SEctitOFm0I. We will be coming up with more such tutorials and blogs. Do subscribe to stay posted. Cheers!
Tableau released the new version of 10.1.1 which has improved visual analytics to analyze the data even faster and we can directly connect CSV file to JSON file.
Hey Meera, thanks for checking out the blog. This improved functionality is available in the later version, but we have used the older version in the webinar. Cheers!
Hi Blog this is very useful for me like interview patten and answers also single word ans thank you much.. please share if you have more to this mail id: ashokputta9@gmail.com
Hey Ashok, thanks for checking out the blog. We’re glad you found it useful. Do subscribe to our blog to stay posted on the upcoming interview questions blogs. Cheers! :)
Hi. Can you help me with this question which is asked in one of the interviews. Question: What would be the reason if a dashboard is working fine on Tableau desktop where as it is very slow on Tableau server.
Hey Prasanna, thanks for checking out the blog. At this juncture all we can say is that you should check the Webbook design and implement in such a way that it will take less memory. Let us dig around a bit more and get back with more inputs. Cheers!
My freiend is recently passed on Tableau certification from ExcelR Solutions and now he preparing for his Tableau Interview. I will share these Interview questions with his as it;s may help him for being ready for interview.
Hope you are doing great. I am planning to give Tableau Certificate exam, can you please share the questions with me. my id is nishant.15990@yahoo.com number is 8806577744


 Copy Link!
 (i)Tableau Desktop:
 5. What are Measures and Dimensions?
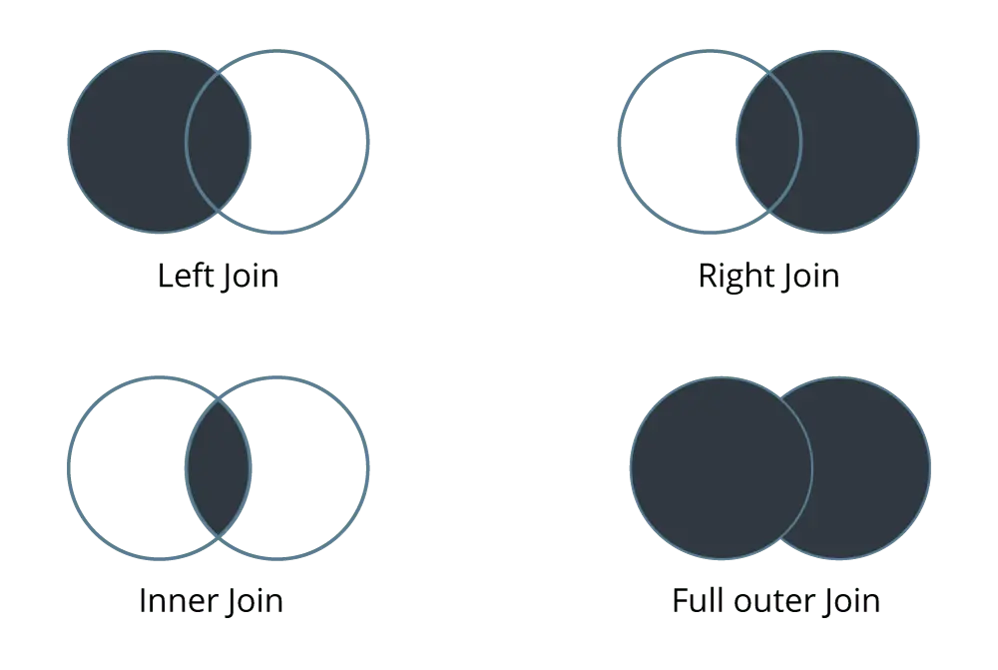 8. How many maximum tables can you join in Tableau?
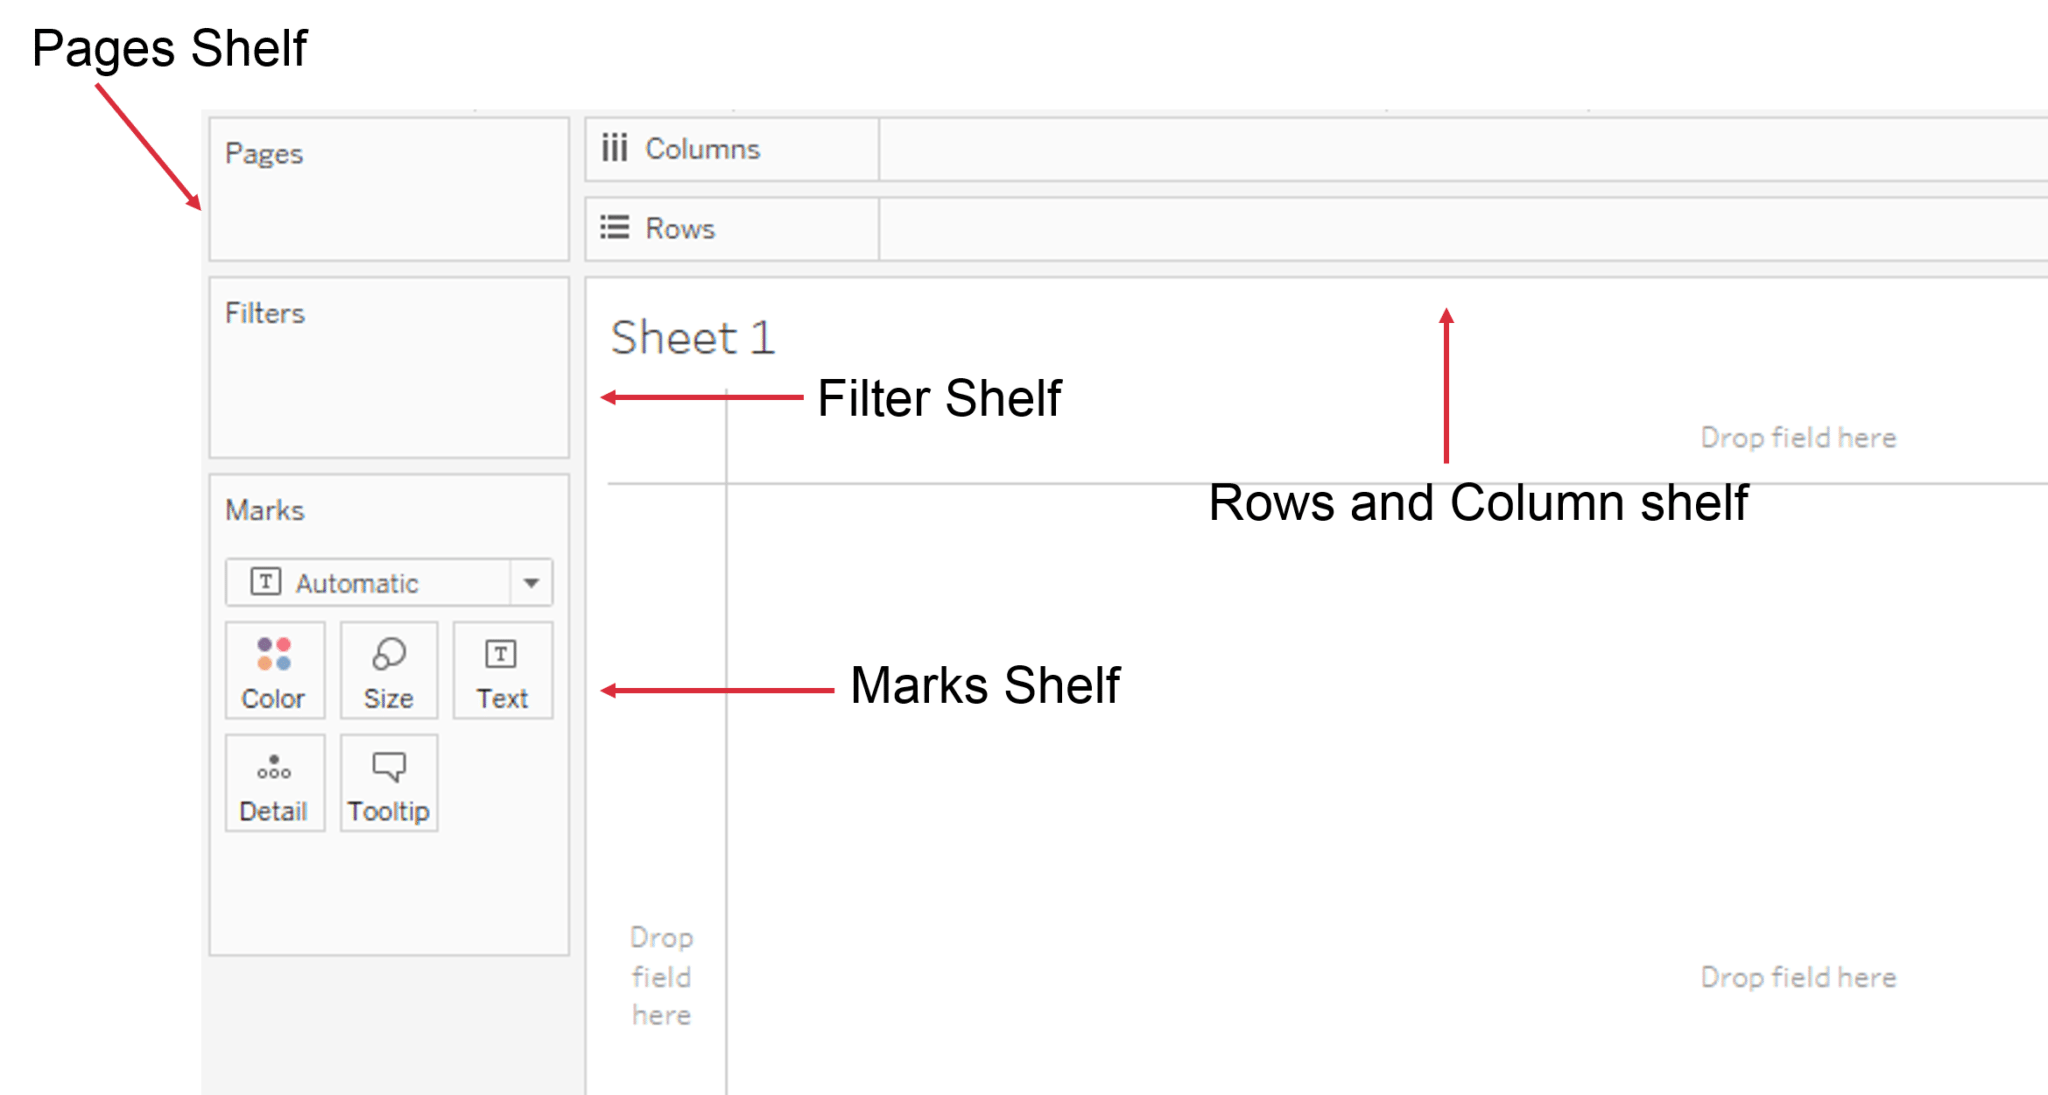
 A tree map also does the same except it is considered a very powerful visualization as it can be used for illustrating hierarchical data and part-to-whole relationships.
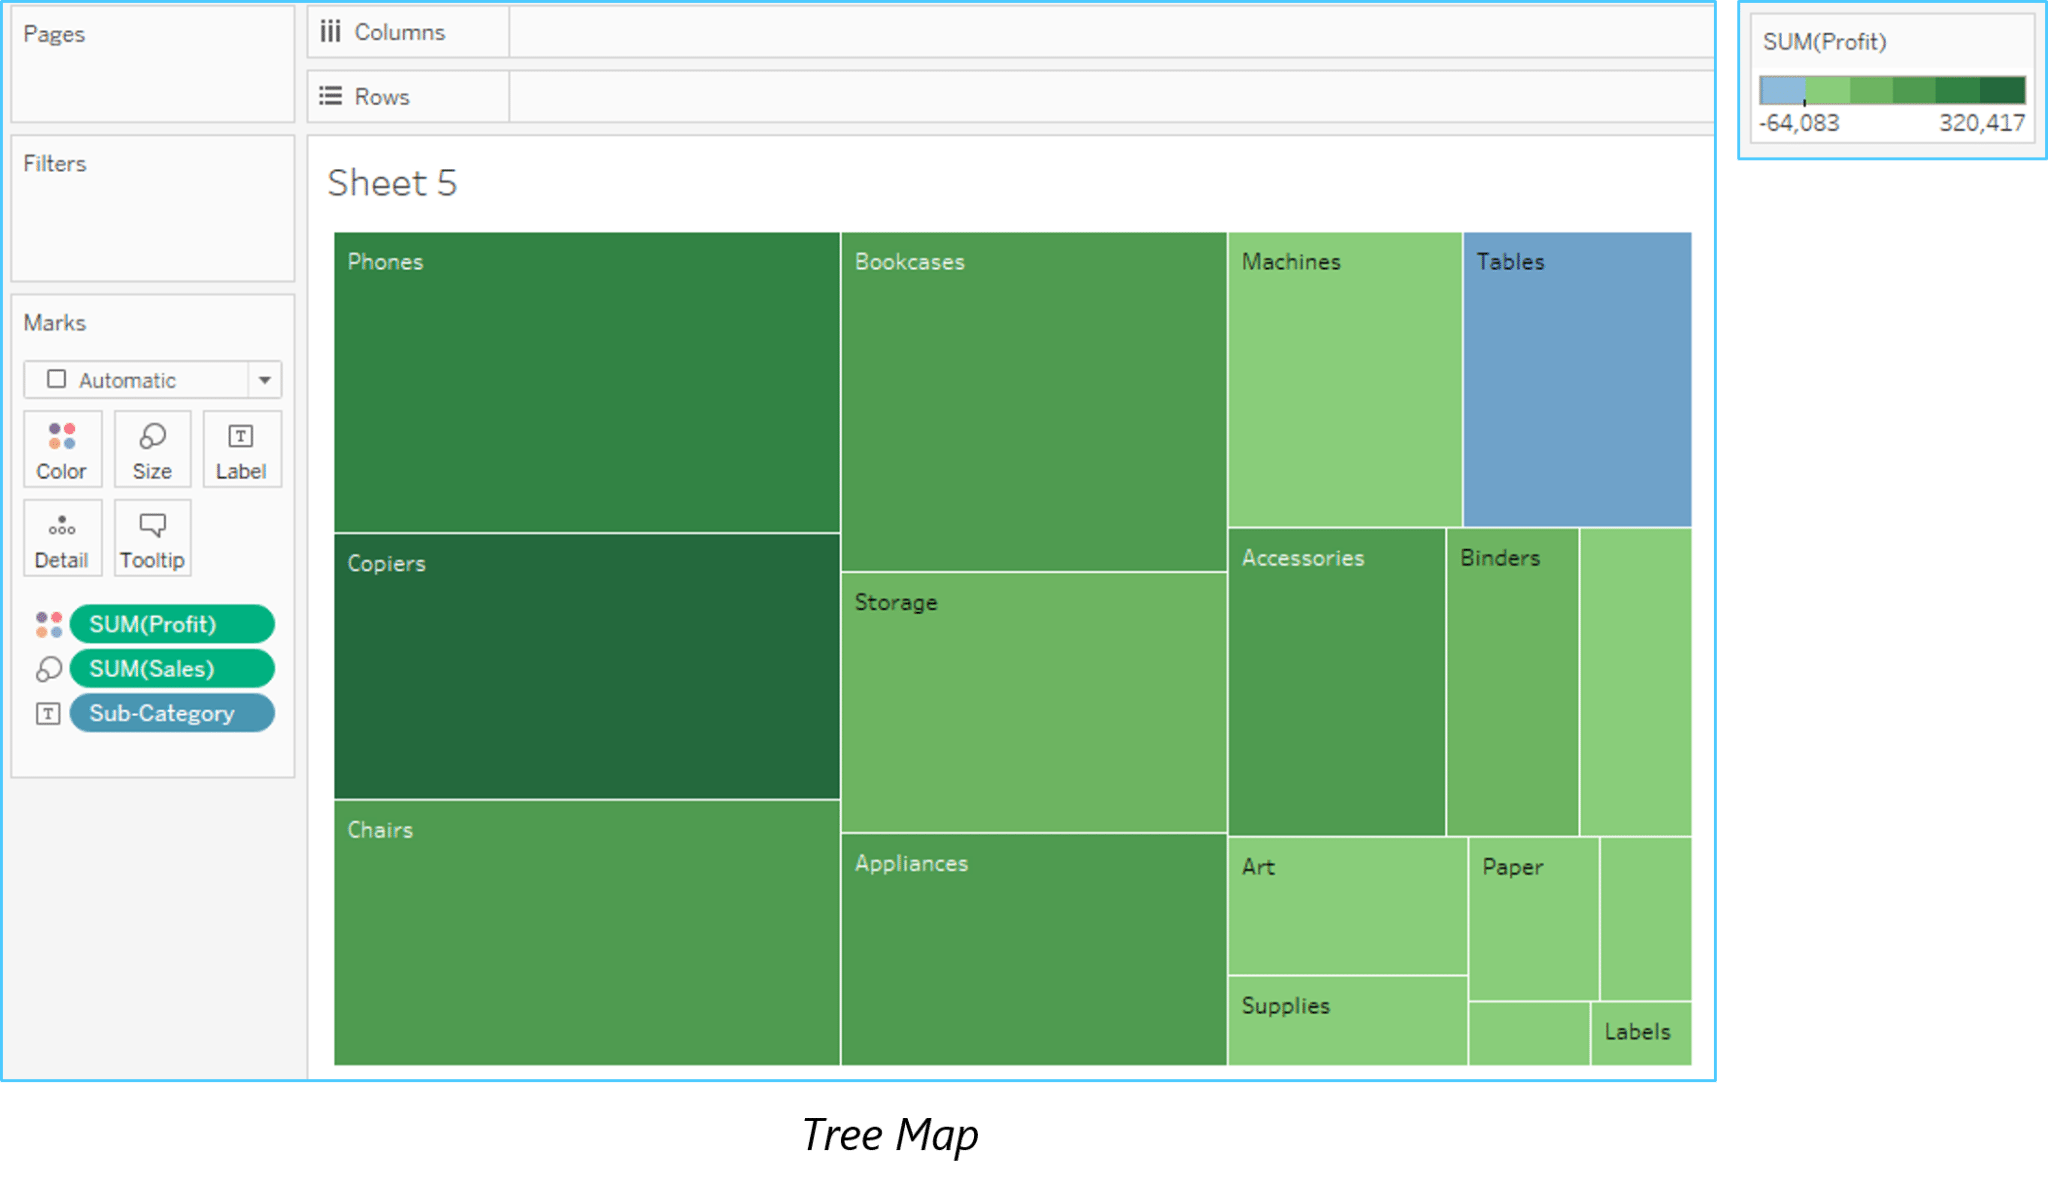


 Thank you for registering Join Edureka Meetup community for 100+ Free Webinars each month JOIN MEETUP GROUP


which chart we should use if we have sales,profit,year other than bar and line charts
dis is nice blog dear…. send me some more tricky questions on Tableau ….this is nice collecton
Hey Subba Reddy, thanks for checking out our blog. We’re glad you liked it.
You can check out our interview questions tutorial here: https://www.youtube.com/watch?v=SEctitOFm0I.
We will be coming up with more such tutorials and blogs. Do subscribe to stay posted. Cheers!
What is the maximum no. of Columns Tableau can utilize at one time?
16 columns
Hi blog this is awesome interview question.
thanks for the simple Q&A format for the Tableau beginning stage
Hey Roshan, thanks for the wonderful feedback! We thought you might like this blog too: https://www.edureka.co/blog/tableau-career-opportunities-101. Cheers!
Tableau released the new version of 10.1.1 which has improved visual analytics to analyze the data even faster and we can directly connect CSV file to JSON file.
Hey Meera, thanks for checking out the blog. This improved functionality is available in the later version, but we have used the older version in the webinar. Cheers!
Hi Blog this is very useful for me like interview patten and answers also single word ans thank you much.. please share if you have more to this mail id: ashokputta9@gmail.com
Again Thanks..
Hey Ashok, thanks for checking out the blog. We’re glad you found it useful. Do subscribe to our blog to stay posted on the upcoming interview questions blogs. Cheers! :)
Hi. Can you help me with this question which is asked in one of the interviews. Question: What would be the reason if a dashboard is working fine on Tableau desktop where as it is very slow on Tableau server.
Hey Prasanna, thanks for checking out the blog. At this juncture all we can say is that you should check the Webbook design and implement in such a way that it will take less memory. Let us dig around a bit more and get back with more inputs. Cheers!
Its very helpful … thanks for making this :)
Thanks for checking out the blog, Amy! We’re glad you found it useful. Also, check out this Tableau career opportunities blog: https://www.edureka.co/blog/tableau-career-opportunities-101. We believe you will find it relevant.
My freiend is recently passed on Tableau certification from ExcelR Solutions and now he preparing for his Tableau Interview. I will share these Interview questions with his as it;s may help him for being ready for interview.
Hi Pawan,
Hope you are doing great.
I am planning to give Tableau Certificate exam, can you please share the questions with me.
my id is nishant.15990@yahoo.com
number is 8806577744
Hey Nishant, stay tuned. :)
Please share the certification questions..helps many people here.Thanks
Hey Pawan, we taken your feedback and will incorporate the certification questions soon. Cheers!