


Here is a list of Top 50 R Interview Questions and Answers you must prepare in 2024. This blog covers all the important questions which can be asked in your interview on R. These R interview questions will give you an edge in the burgeoning analytics market where global and local enterprises, big or small, are looking for professionals with certified expertise in R.
R is a programming language which can be as useful as you want it to be. It’s a tool at your disposal which can be used for multiple purposes such as statistical analysis, data visualization, data manipulation, predictive modelling, forecast analysis and the list goes on. R is used by the top companies such as Google, Facebook and Twitter.
R Interview Questions:
1. What are the different data structures in R? Briefly explain about them.
Broadly speaking these are Data Structures available in R:
| Data Structure | Description |
| Vector | A vector is a sequence of data elements of the same basic type. Members in a vector are called components. |
| List | Lists are the R objects which contain elements of different types like − numbers, strings, vectors or another list inside it. |
| Matrix | A matrix is a two-dimensional data structure. Matrices are used to bind vectors from the same length. All the elements of a matrix must be of the same type (numeric, logical, character, complex). |
| Dataframe | A data frame is more generic than a matrix, i.e different columns can have different data types (numeric, character, logical, etc). It combines features of matrices and lists like a rectangular list. |
2. How can you load a .csv file in R?
- Loading a .csv file in R is quite easy.
- All you need to do is use the “read.csv()” function and specify the path of the file.
house<-read.csv("C:/Users/John/Desktop/house.csv")3. What are the different components of grammar of graphics?
Broadly speaking these are different components in grammar of graphics:
- Data layer
- Aesthetics layer
- Geometry layer
- Facet layer
- Co-ordinate layer
- Themes layer
4. What is Rmarkdown? What is the use of it?
RMarkdown is a reporting tool provided by R. With the help of Rmarkdown, you can create high quality reports of your R code.
The output format of Rmarkdown can be:
- HTML
- WORD
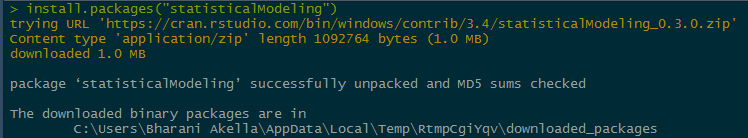
5. How do you install a package in R?
The below command is used to install a package in R:
install.packages(“<package_name>”)let’s look at an example:

R Interview Questions
6. What are the steps to build and evaluate a linear regression model in R?
These are sequential steps which need to be followed while building a linear regression model:
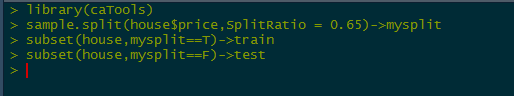
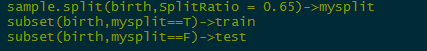
- Start off by dividing the data into train and test sets, this step is vital because you will be building the model on the train set and evaluating it’s performance on the test set.
- You can do this using the sample.split() function from the “catools” package. This function gives an option of split-ratio, which you can specify according to your needs.

R Interview Questions
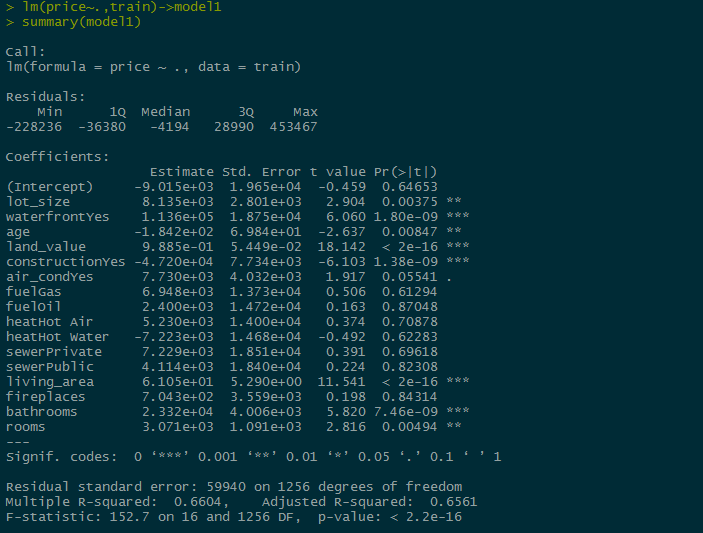
- Once, you are done splitting the data into training and test sets, You can go ahead and build the model on the train set.
- The “lm()” function is used to build a model.

R Interview Questions
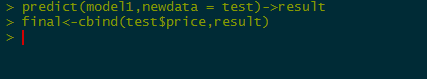
- Finally you can predict the values on the test set, using the “predict()” function.

R Interview Questions
- The final step would be to find out the RMSE, the lower the RMSE value, the better the prediction.
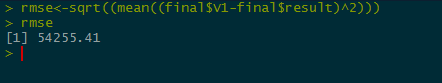

R Interview Questions
7. Name some packages in R, which can be used for data imputation?
These are some packages in R which can used for data imputation
- MICE
- Amelia
- missForest
- Hmisc
- Mi
- imputeR
8. Explain about confusion matrix in R?
A confusion matrix can be used to evaluate the accuracy of the model built. It Calculates a cross-tabulation of observed and predicted classes. This can be done using the “confusionmatrix()” function from the “caTools” package.
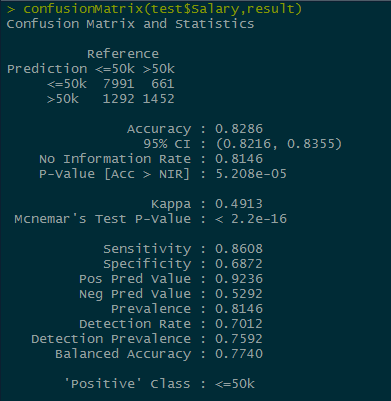

Here, we have created a confusion matrix, which gives a tabulated list for “actual” and “predicted” values.
9. How would you write a custom function in R? Give an example.
This is the syntax to write a custom function In R:
<object-name>=function(x){
—
—
—
}
Let’s look at an example to create a custom function in R ->
fun1<-function(x){ifelse(x>5,100,0)}
v<-c(1,2,3,4,5,6,7,8,9,10)fun1(v)->v 10. Name some functions available in “dplyr” package.
Functions in dplyr package:
- filter
- select
- mutate
- arrange
- count
11. How would you create a new R6 Class?
We would have to first create an object template, which consists of the “Data Members” and “Class Functions” present in the class.
An R6 object template comprises of these parts ->
- Class Name
- Private Data Members
- Public Member Functions
Let’s understand the object template through code ->

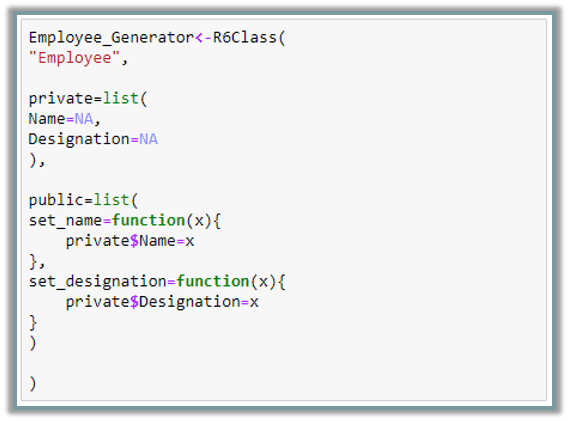
The above code consists of these parts:
- Class Name – “Employee”
- Private Data Members – “Name” & “Designation”
- Public Member Functions – “set_name()” & “set_designation”
12. What is a Random Forest? How do you build and evaluate a Random Forest in R?
Random Forest is an ensemble classifier made using many decision tree models. It combines the results from many decision tree models and this result is usually better than the result of any individual model.
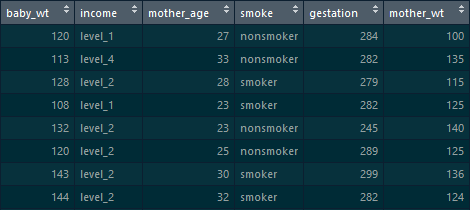
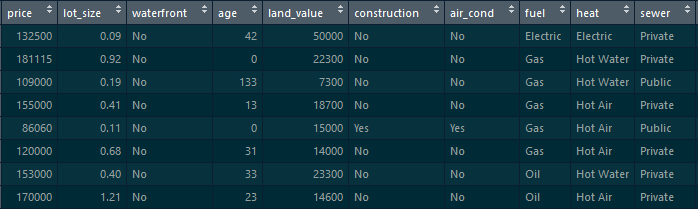
We’ll be working with the “birth” data-set which comprises of these columns:

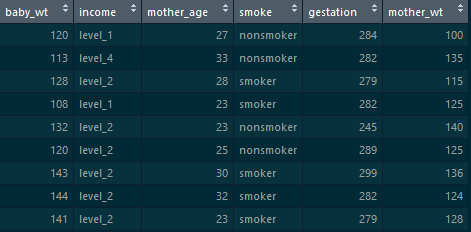
Let’s build a random forest model on top of this to predict the “smoke” column, i.e, whether the mother smokes or not.
- Let’s start off by dividing the data into train and test->

- Build random forest model on the train set->
randomForest(smoke~.,birth)->mod1- Now, we’ll predict the model on the test set->
predict(mod1,test)->result13. Tell me something about shinyR.
Shiny is an R package that makes it easy to build interactive web apps straight from R. You can host standalone apps on a webpage or embed them in Rmarkdown documents or build dashboards. You can also extend your Shiny apps with CSS themes, htmlwidgets, and JavaScript actions.
14. What is advantage of using apply family of functions in R?
The apply function allows us to make entry-by-entry changes to data frames and matrices.
The usage in R is as follows:
apply(X, MARGIN, FUN, …)
where:
X is an array or matrix;
MARGIN is a variable that determines whether the function is applied over rows (MARGIN=1), columns (MARGIN=2), or both (MARGIN=c(1,2));
FUN is the function to be applied.
If MARGIN=1, the function accepts each row of X as a vector argument, and returns a vector of the results. Similarly, if MARGIN=2 the function acts on the columns of X. Most impressively, when MARGIN=c(1,2) the function is applied to every entry of X.
Advantage:
With the apply function we can edit every entry of a data frame with a single line command. No auto-filling, no wasted CPU cycles.
15. What packages are used for data mining in R?
Some packages used for data mining in R:
- data.table- provides fast reading of large files
- rpart and caret- for machine learning models.
- Arules- for associaltion rule learning.
- GGplot- provides varios data visualization plots.
- tm- to perform text mining.
- Forecast- provides functions for time series analysis
16. What is clustering? What is the difference between kmeans clustering and hierarchical clustering?
Cluster is a group of objects that belongs to the same class. Clustering is the process of making a group of abstract objects into classes of similar objects.
Let us see why clustering is required in data analysis:
- Scalability − We need highly scalable clustering algorithms to deal with large databases.
- Ability to deal with different kinds of attributes − Algorithms should be capable of being applied to any kind of data such as interval-based (numerical) data, categorical, and binary data.
- Discovery of clusters with attribute shape − The clustering algorithm should be capable of detecting clusters of arbitrary shape. They should not be bounded to only distance measures that tend to find spherical cluster of small sizes.
- High dimensionality − The clustering algorithm should not only be able to handle low-dimensional data but also the high dimensional space.
- Ability to deal with noisy data − Databases contain noisy, missing or erroneous data. Some algorithms are sensitive to such data and may lead to poor quality clusters.
- Interpretability − The clustering results should be interpret-able, comprehensible, and usable.
K-MEANS clustering:
K-means clustering is a well known partitioning method. In this method objects are classified as belonging to one of K-groups. The results of partitioning method are a set of K clusters, each object of data set belonging to one cluster. In each cluster there may be a centroid or a cluster representative. In the case where we consider real-valued data, the arithmetic mean of the attribute vectors for all objects within a cluster provides an appropriate representative; alternative types of centroid may be required in other cases.
Example: A cluster of documents can be represented by a list of those keywords that occur in some minimum number of documents within a cluster. If the number of the clusters is large, the centroids can be further clustered to produce hierarchy within a dataset. K-means is a data mining algorithm which performs clustering of the data samples. In order to cluster the database, K-means algorithm uses an iterative approach.
R code
# Determine number of clusters
wss <- (nrow(mydata)-1)*sum(apply(mydata,2,var))for (i in 2:15) wss[i] <- sum(kmeans(mydata,centers=i)$withinss)plot(1:15, wss, type=”b”, xlab=”Number of Clusters”,ylab=”Within groups sum of squares”)# K-Means Cluster Analysis
fit <- kmeans(mydata, 5) # 5 cluster solution# get cluster means
aggregate(mydata,by=list(fit$cluster),FUN=mean)# append cluster assignment
mydata <- data.frame(mydata, fit$cluster)A robust version of K-means based on mediods can be invoked by using pam( ) instead of kmeans( ). The function pamk( ) in the fpc package is a wrapper for pam that also prints the suggested number of clusters based on optimum average silhouette width.
Hierarchical Clustering:
This method creates a hierarchical decomposition of the given set of data objects. We can classify hierarchical methods on the basis of how the hierarchical decomposition is formed. There are two approaches here:
- Agglomerative Approach
- Divisive Approach
Agglomerative Approach:
This approach is also known as the bottom-up approach. In this, we start with each object forming a separate group. It keeps on merging the objects or groups that are close to one another. It keeps on doing so until all of the groups are merged into one or until the termination condition holds.
Divisive Approach:
This approach is also known as the top-down approach. In this, we start with all of the objects in the same cluster. In the continuous iteration, a cluster is split up into smaller clusters. It is down until each object in one cluster or the termination condition holds. This method is rigid, i.e., once a merging or splitting is done, it can never be undone.
R code
Cars example
# The mtcars data set is built into R:
help(mtcars)# We will focus on the variables that are continuous in nature rather than discrete:
cars.data <- mtcars[,c(1,3,4,5,6,7)]# Standardizing by dividing through by the sample range of each variable
samp.range <- function(x){myrange <- diff(range(x))return(myrange)}my.ranges <- apply(cars.data,2,samp.range)cars.std <- sweep(cars.data,2,my.ranges,FUN=”/”)# Getting distance matrix:
dist.cars <- dist(cars.std)
# Single linkage:
cars.single.link <- hclust(dist.cars, method=’single’)
# Plotting the single linkage dendrogram:
plclust(cars.single.link, labels=row.names(cars.data), ylab=”Distance”)
# Opening new window while keeping previous one open
windows()
# complete linkage:
cars.complete.link <- hclust(dist.cars, method=’complete’)# Plotting the complete linkage dendrogram:
plclust(cars.complete.link, labels=row.names(cars.data), ylab=”Distance”)# Average linkage:
cars.avg.link <- hclust(dist.cars, method=’average’)# Plotting the average linkage dendrogram:
plclust(cars.avg.link, labels=row.names(cars.data), ylab=”Distance”)# Average Linkage dendrogram seems to indicate two major clusters,
# Single Linkage dendrogram may indicate three.
# Single Linkage Solution:
cut.3 <- cutree(cars.single.link, k=3)# printing the “clustering vector”
cut.3
cars.3.clust <- lapply(1:3, function(nc) row.names(cars.data)[cut.3==nc])# printing the clusters in terms of the car names
cars.3.clust
# Cluster 1 seems to be mostly compact cars, Cluster 2 is sports cars, Cluster 3 is large Luxury sedans
17. Give examples of “rbind()” and “cbind()” functions in R
Cbind(): As the name suggests, it is used to bind two columns together. One fact to be kept in mind while binding two columns is, the number of rows in both the columns need to be same.
Let’s understand this with an example:
This is “Marks” data-set which comprises of marks in three subjects->
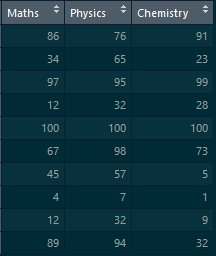

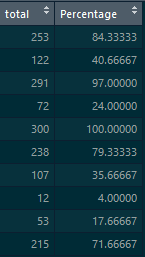
We’ll bind this with a new dataset “Percentage” which consists of two columns :-> “Total” and “Percentage”

Let’s combine the columns from these two data-sets using the “cbind()” function->
cbind(Marks,Percentage)
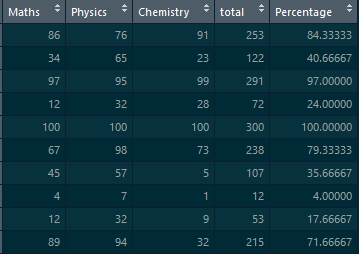
Since, the number of rows in both the data-sets is same we have combined the columns with the help of “cbind()” function
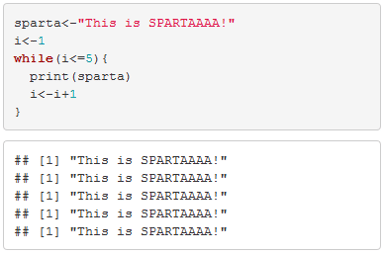
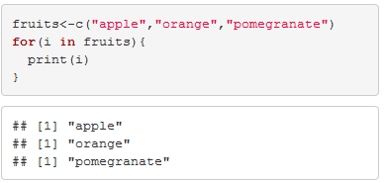
18. Give examples of while and for loop in R.
While loop:

For loop:

19. Give examples of “select” and “filter” functions from “dplyr” package.

Select: This function from “dplyr” package is used to select some specific columns from the data-set
Birth_weight %>% select(1,2,3)->birth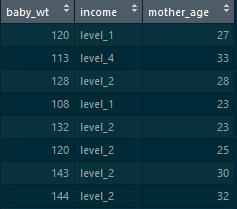

Birth_weight %>% select(-5)->birth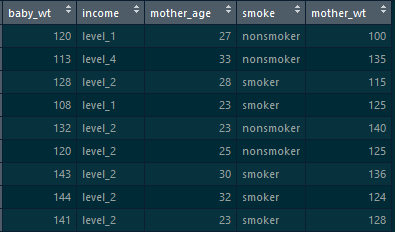

Filter: This function from “dplyr” package is used to filter out some rows on the basis of a condition:
Birth_weight %>% filter(mother_age>35)->birth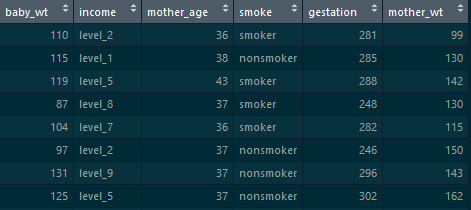

Birth_weight %>% filter(baby_wt>125 & smoke=="smoker")->birth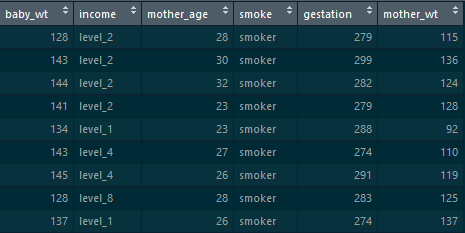

20. What is the use of stringR package. Give some examples of the functions in Stringr.
Some functions in StringR:
Initial:
fruit->
![]()

- Converting the strings into capital:
str_to_upper(fruit)
- Finding the count of number of letters:
str_count(fruit)
21. What do you know about the rattle package in R?
Rattle is a popular GUI for data mining using R. It presents statistical and visual summaries of data, transforms data so that it can be readily modelled, builds both unsupervised and supervised machine learning models from the data, presents the performance of models graphically, and scores new datasets for deployment into production. A key features is that all of your interactions through the graphical user interface are captured as an R script that can be readily executed in R independently of the Rattle interface.
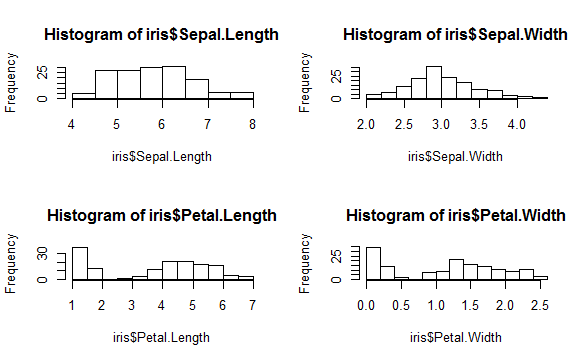
22. How would you make multiple plots onto a single page in R?
Plotting multiple plots onto a single page using base graphs is quite easy:
For, example if you want to plot 4 graphs onto the same pane, you can use the below command:
par(mfrow=c(2,2))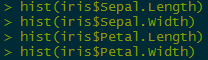


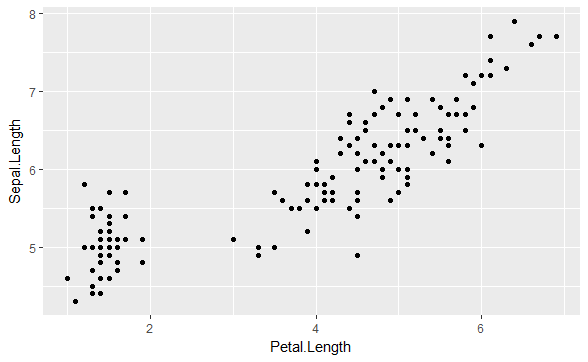
23. How would you create a scatterplot using ggplot2 package?
A scatter-plot can be used to visualize the correlation between two or more entities at the same time.
Let’s take an example and understand how to make a scatter-plot using ggplot2 package->
ggplot(iris,aes(y=Sepal.Length,x=Petal.Length))+geom_point()
24. How would you facet the data using ggplot2 package?
Let’s take an example to understand faceting with ggplot2
Initial:
ggplot(house,aes(y=price,x=waterfront))+geom_boxplot()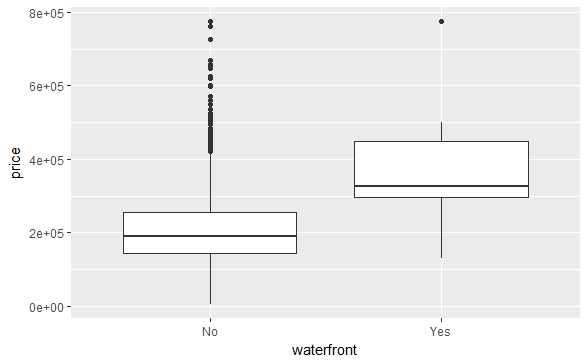
ggplot(house,aes(y=price,x=waterfront))+geom_boxplot()+facet_grid(.~waterfront)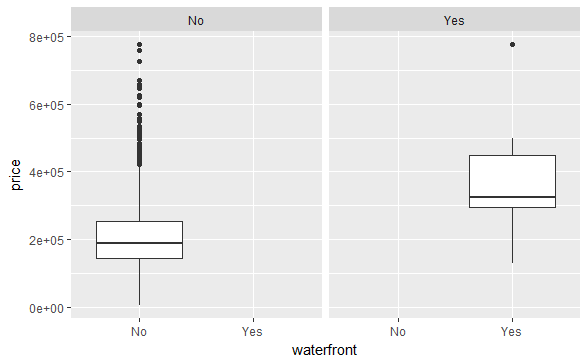
25. Given a vector of values, how would you convert it into a time series object?
Let’s say this is our vector->
a<-c(1,2,3,4,5,6,7,8,9)To convert this into a time series object->
as.ts(a)->a
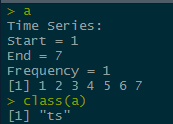
Let’s plot this:
ts.plot(a)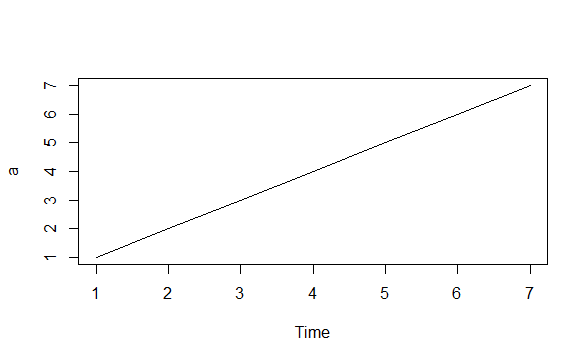
26. What is a White Noise model and how can you simulate it using R?
The white noise (WN) model is a basic time series model.It is the simplest example of a stationary process.
A white noise model has:
- A fixed constant mean
- A fixed constant variance
- No correlation over time
Simulating a white noise model in R:
arima.sim(model=list(order=c(0,0,0)),n=50)->wn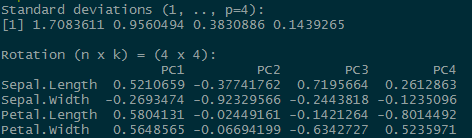

ts.plot(wn)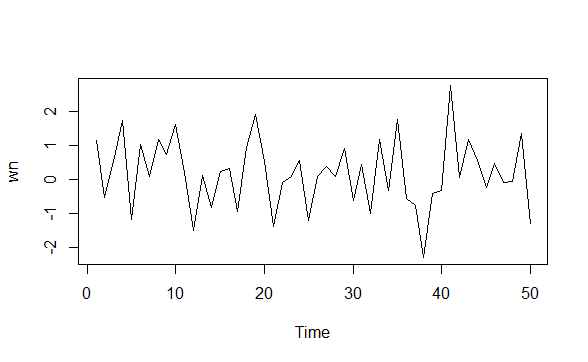
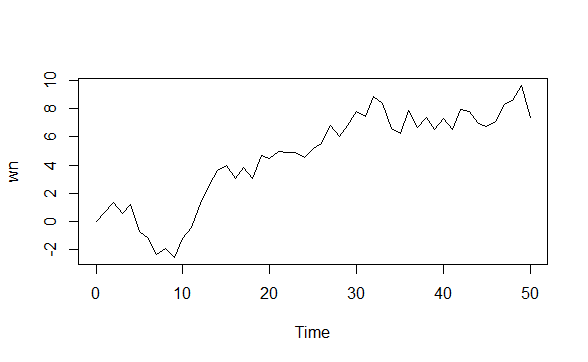
27. What is a Random Walk model and how can you simulate it using R?
A random walk is a simple example of non-stationary process.
A random walk has:
- No specified mean or variance
- Strong dependence over time
- It’s changes or increments are white noise
Simulating random walk in R:
arima.sim(model=list(order=c(0,1,0)),n=50)->rwts.plot(rw)
28. What is Principal Component Analysis and how can you create a PCA model in R?
Principal Component Analysis is a method for dimensionality reduction. Many a times, it happens that, one observation is related to multiple dimensions(features) and this brings in a lot of chaos to the data, that is why it is important to reduce the number of dimensions.
The concept of Principal Component Analysis is this:
- The data is transformed to a new space, with equal or less number of dimensions. These dimensions(features) are known as principal components.
- The first principal component captures the maximum amount of variance from the features in the original data.
- The second principal component is orthogonal to the first and captures the maximum amount of variability left.
- The same is true for each principal component, they are all uncorrelated and each is less important than the previous one.
We can do PCA in R with the help of “prcomp()” function.
prcomp(iris[-5])->pca
Let’s see how thee variability decreases across different principal components
screeplot(pca)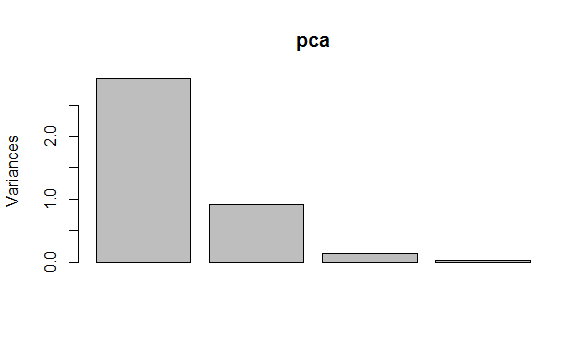
29. How would you find out the mean of one column w.r.t another?
Let’s perform the operation on the iris data-set:
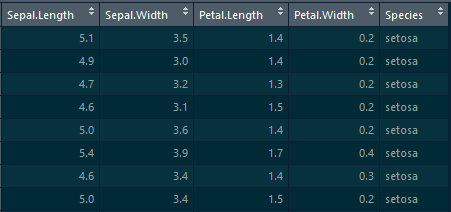

We’ll be using the mean() function from the mosaic package
mean(iris$Sepal.Length~iris$Species)This command gives the mean values of Sepal-Length across different species of iris flower.

We observe that “virginica” has the highest sepal length and “setosa” has the lowest sepal length.
30. Explain about “initialize()” function in R?
initialize() function is used to initialize the private data members while declaring the object.

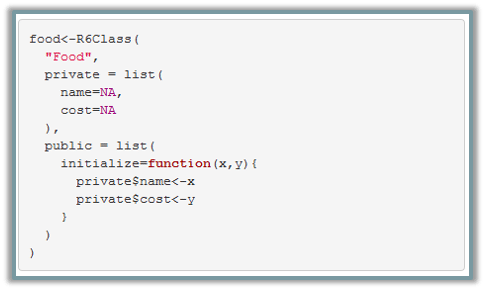
With the above code, we are initializing the values of “name” and “cost” during the time of declaration

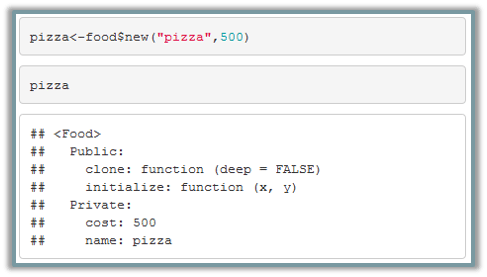
We have initialized the values of ‘500’ to cost and ‘pizza’ to name
31. How would you fit a linear model over a scatter-plot?
We can do that using the “ggplot2” package.
We’ll first make a scatter-plot with the help of geom_point() function, then we’ll make the linear model, by adding the geom_smooth() layer on top of it.
ggplot(data = house,aes(y=price,x=living_area))+geom_point()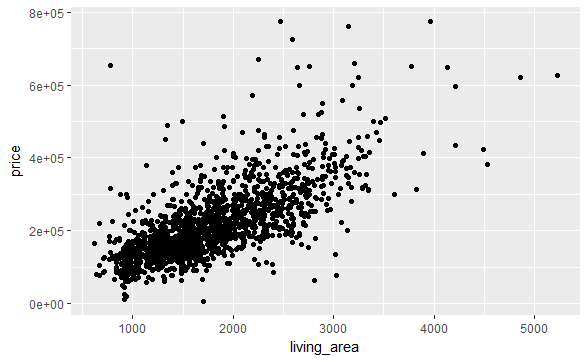
we’ll be adding the geom_smooth() layer on top of this, to fit a linear model.
ggplot(data = house,aes(y=price,x=living_area))+geom_point()+geom_smooth(method = "lm")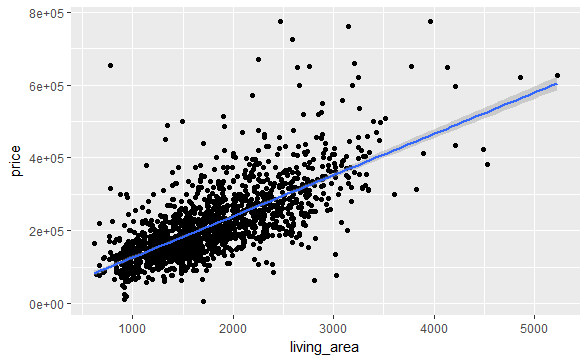
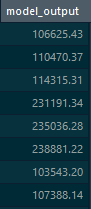
32. What do you know about the evaluate_model() function from “statisticalModeling” Package
This is an alternative to the “predict()” function . i.e. It is used to predict the values of the built model.
The difference between this and predict function is that, it automatically selects more sensible values than the predict function.

Let’s build a linear regression model on top of this and then predict the values using evaluate_model()
lm(price~.,data = house)->mod1evaluate_model(mod1)->resultIt gives a data-set, which also comprises a new column for the model_output

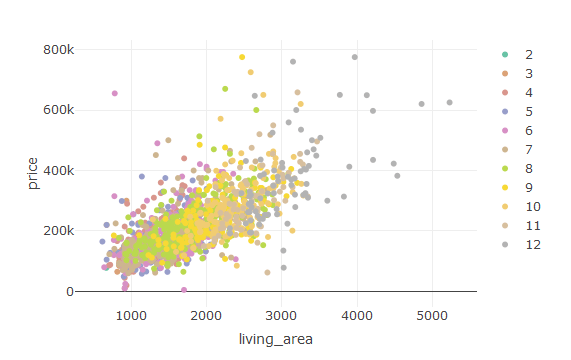
33. How would you build a Scatter-plot using plotly?
With the help of “plotly” we can create stunning visualizations.
This is the command to create a stunning scatter plot with the help of “plotly” package.
plot_ly(house,y=~price,x=~living_area,color=~rooms)
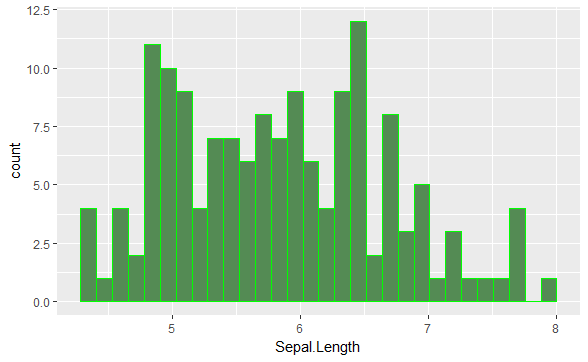
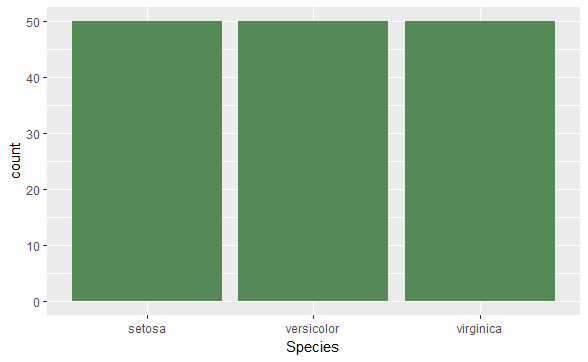
34. What is the difference between a bar-chart and a histogram? Where would you use a bar-chart and where would you use a histogram?
People most often get confused where to use a histogram and where to use a bar-graph. One simple point to be kept in mind is, histograms are used to plot the distribution of a continuous variable and bar-charts are used to plot the distribution of a categorical variable.

Let’s plot a histogram for the iris dataset with the help of ggplot2 package:
ggplot(data = iris,aes(x=Sepal.Length))+geom_histogram(fill="palegreen4",col="green") We have plotted “Sepal.Length”- a continuous variable, onto the x-axis.
Now, let’s make a bar-graph:
ggplot(data = iris,aes(x=Species))+geom_bar(fill="palegreen4") We’ll plotted “Species”- a categorical variable onto the x-axis.
35. How would you create a box-plot using “plotly”?
This is the command to create a box-plot in R:
plot_ly(house,y=~price,x=~rooms,color=~rooms,type="box")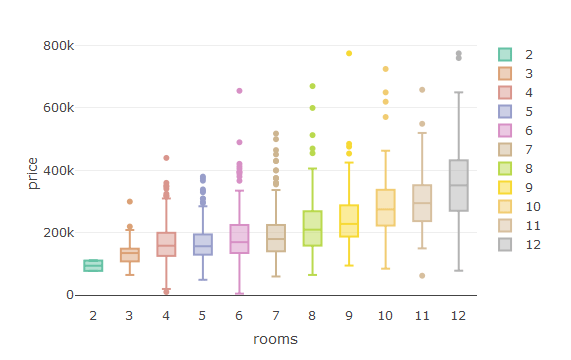
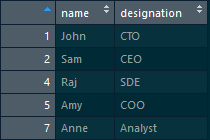
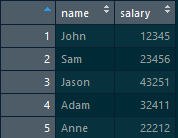
36. How would you do a left and right join in R?
We’ll be using the help of “dplyr” package to make a left join and right join.
We have two data-sets -> employee salary and employee designation:
Employee_designation->

Employee_salary->

Let’s do a left join on these two data-sets using “left_join()” function from dplyr package:
left_join(employee_designation,employee_salary,by="name")Result->

Now, let’s perform a right join between these two data-sets:
right_join(employee_designation,employee_salary,by="name") Result->

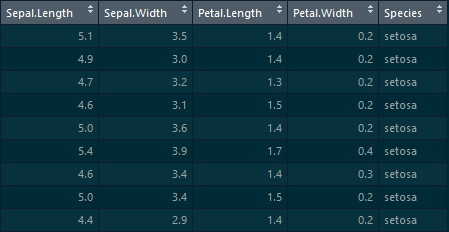
37. What is a factor? How would you create a factor in R?
Conceptually, factors are variables in R which take on a limited number of different values; such variables are often referred to as categorical variables. One of the most important use of factors is in statistical modeling; since categorical variables enter into statistical models differently than continuous variables, storing data as factors ensures that the modeling functions will treat such data correctly.
Initially, we have a character vector of names of fruits, let’s convert it into a factor:

Converting the character vector into a factor can be done using the as.factor() function:
as.character(fruit)->fruit
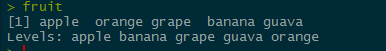
let’s look at the class of the vector now:

38. Given a vector of numbers, how would you turn the values into scientific notation?
We have the below vector:
a<-c(0.1324,0.0001234,234.21341324,09.324324)We can convert it into scientific notation using the “formatC()” function:
formatC(a,format="e")This is the result:
![]()

39. How would you join multiple strings together?
Joining strings in R is quite an easy task. We can do it either with the help of “paste()” function or “string_c()” function from “stringR” package.
Let’s understand this with an example:
We have the “fruit” vector, which comprises of names of fruits, and we would want to add the string “fruit” before the name of the fruit. Let’s go ahead and do that.
First, let’s have a glance at the “fruits” vector.
print(fruit)![]()
Now, let’s use the paste function:
paste("fruit",fruit)
Now, let’s perform the same task using “str_c()” function from “stringR” package.
str_c("fruit",fruit,sep="-")![]()

40. Write a custom function which will replace all the missing values in a vector with the mean of values.
Let’s take this vector:
a<-c(1,2,3,NA,4,5,NA,NA)Now, let’s write the function to impute the values:
mean_impute<-function(x){
ifelse(is.na(x),mean(x,na.rm = T),x)
}
This is the result:
![]()

41. What are the different import functions in R?
Data from different sources and different formats can be imported into R. Let’ have a look at the different import functions available in R:
- read.csv()-> for reading .csv files
- read_sas()-> for reading .sas7bdat files
- read_excel()-> for xl sheets
- read_sav()-> for spss data
42. Name some functions which can be used for debugging in R?
These are some functions which can be used for debugging in R:
- traceback()
- debug()
- browser()
- trace()
- recover()
43. How would you check the distribution of a categorical variable in R?
We would often want to find out how are the values of a categorical variable distributed.
We can use the table() function to find the distribution of categorical values.
table(iris$Species)
Now, let’s find out the percentage distribution of these values.
table(iris$Species)/nrow(iris)![]()

44. How would you rename the columns of a dataframe?
Most often the column names do not convey the right information about the values present in the column, thus we need to rename them.
Let’s take an example which will illustrate on how to rename the columns.
This is the fruits data-set, which consists of two columns:

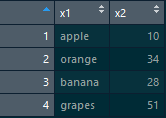
We see that the column names do not give any information about the data present in them, so let’s go ahead and rename those columns.
The “colnames()” function is used to rename the columns.
colnames(fruits)<-c("name","cost")Now, let’s look at the result: 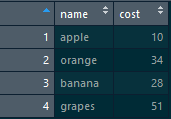

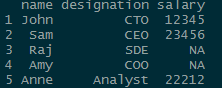
45. How would you find the number of missing values in a dataset and remove all of them?
Missing values bring in a lot of chaos to the data. Thus, it is always important to deal with the missing values before we build any models.
Let’s take an example:
This is an employee data-set which consists of missing values, let’s go ahead and remove them.
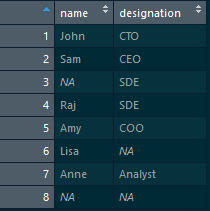

This Code gives the number of missing values->
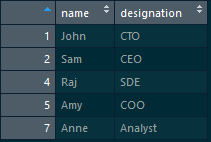
sum(is.na(employee))Now, let’s delete the missing values:
na.omit(employee)This is the result after deleting the missing values:

46. What is correlation? How would you measure correlation in R?
Correlation is a measure to find the strength of association between two variables.
We can use the cor() function in R to find the correlation coefficient.
We’ll be working with the iris data-set:
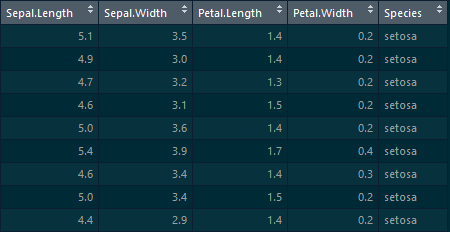

Let’s find the extent of correlation between these variables, using the cor() function
cor(iris[-5])Let’s have a look at the result:
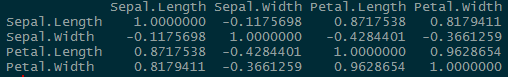

If the correlation coefficient is closer to +1, then there is a strong positive relation between the variables. Similarly, if the correlation coefficient is closer to -1, then there would be a strong negative correlation between the two variables.
If we take “Sepal.Length” and “Petal.Length”, the correlation coefficient is 0.8717538, which means there is strong positive relation between these two variables.
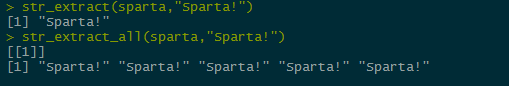
47. How would you extract one particular word from a string?
The string_extract_all() function from the “stringR” package can be used to extract a particular pattern from a string.
sparta<-"This is Sparta! This is Sparta! This is Sparta! This is Sparta! This is Sparta!"Let’s extract the pattern “Sparta!” from it.

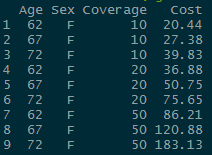
48. From the below data-set, extract only those values where Age>60 and Sex=”F”.
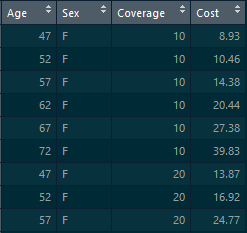

We can do it using the “dplyr” package. “dplyr” is a package which provides many functions for data manipulation, one such function is filter().
Let’s go ahead and perform the desired task using the filter() function
AARP %>% filter(Age>60 & Sex=="F")With the above command, we are filtering out those values where Age is greater than 60 and “Sex” is female.

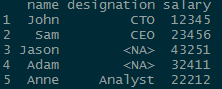
49. You have an employee data-set, which comprises of two columns->”name” and “designation”, add a third column which would indicate the current date and time.
This is the employee data-set:
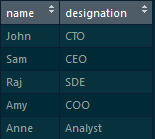

We can add the date using cbind() function
cbind(employee,date())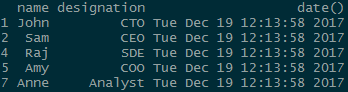

50. How would you do a cross-product of two tables in R?
“merge()” function can be used to perform a cross-product in R:
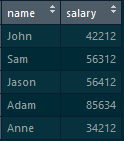
We have two tables-> “employee_designation” and “employee_salary”
employee_designation table: which consists of “name” and “designation”
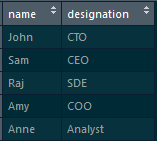

employee_salary table: which consists of “name” and “salary”

By following the below command, we will get a cross-product:
merge(employee_designation,employee_salary,by=NULL)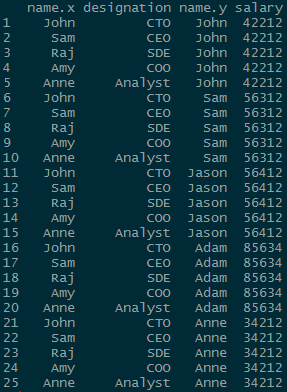

All the best for your interview!
Check out the R Certification Training by Edureka, a trusted online learning company with a network of more than 250,000 satisfied learners spread across the globe. Edureka’s Data Analytics with R training will help you gain expertise in R Programming, Data Manipulation, Exploratory Data Analysis, Data Visualization, Data Mining, Regression, Sentiment Analysis and using RStudio for real life case studies on Retail, Social Media.