
Advanced DevOps Certification Training with G ...
- 24k Enrolled Learners
- Weekend
- Live Class
(7990)


 Copy Link!
Nagios is one of the most widely used tools for Continuous Monitoring. Since organizations are now releasing softwares more frequently than ever so there is a dire need for a tool that can monitor the functioning of the softwares and provide teams with the relevant feedback. This is one of the reasons that brought Continuous Monitoring into the picture. This makes Nagios a very important tool to implement DevOps. So below is the list of Nagios Interview Questions. I have collected these questions after doing a lot of research and after discussing with some of the experts who are directly involved in the hiring process.
This Nagios Interview Questions blog is a part of parent blog DevOps Interview Questions. It includes all the DevOps Stages.
First question in this Nagios Interview Questions blog has to be:
You can answer this question by first mentioning that:
Nagios is one of the monitoring tools that is used for Continuous monitoring of systems, applications, services, and business processes etc. in a DevOps culture. In the event of a failure, Nagios can alert technical staff of the problem, allowing them to begin remediation processes before outages affects business processes, end-users, or customers. With Nagios you don’t have to explain why an unseen infrastructure outage affect your organization’s bottom line.
Few of its important features are:
| Feature | Description |
| Monitoring | Its powerful script APIs allow easy monitoring of in-house and custom applications, services, and systems |
| Visibility & Awareness | It provides a centralized view of the entire monitored IT infrastructure with detailed status information |
| Problem Remediation | Alert acknowledgments in Nagios, provide communication on known issues and problem response |
| Proactive Planning | Trending and capacity planning add-ons are there in Nagios to aware you about the aging infrastructure |
| Reporting | Availability reports ensure SLAs are being met & provide a record of alerts, notifications, and alert response |
| Customizable Code | Since it is an open source software you get the full access to its source code |
| Large Community | Nagios is backed up by a community of more than 1 million+ users worldwide which provides free support |
Now, once you have defined what is Nagios, you can mention the various things that you can achieve using Nagios.
By using Nagios you can:
This overall completes the answer to this question. The further details like advantages etc. can be added as per the direction where the discussion is heading.
I will advise you to follow the below explanation for this answer:
Now, the next set of Nagios interview questions will focus on Nagios components like Plugins, NRPE, etc.
Begin this answer by defining Plugins.
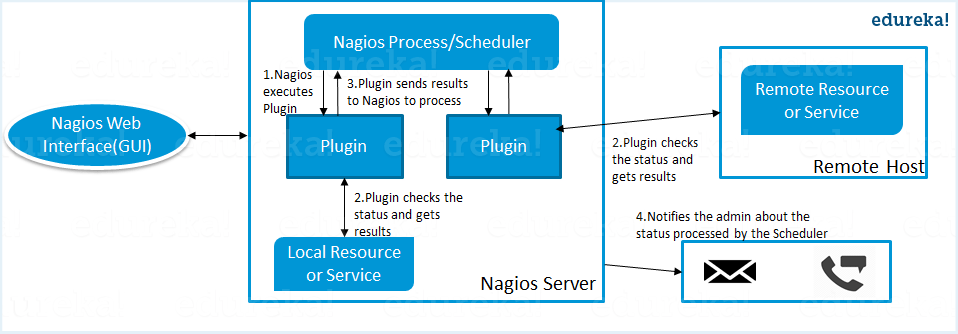
Plugins are scripts (Perl scripts, Shell scripts, etc.) that can run from a command line to check the status of a host or service. Nagios uses the results from the plugins to determine the current status of hosts and services on your network.
Once you have defined Plugins I will suggest you to explain why we need plugins.
Nagios will execute a Plugin whenever there is a need to check the status of a host or service. The plugin will perform the check and then simply returns the result to Nagios. Nagios will process the results that it receives from the Plugin and take the necessary actions.
For this answer first give a small definition of NRPE.
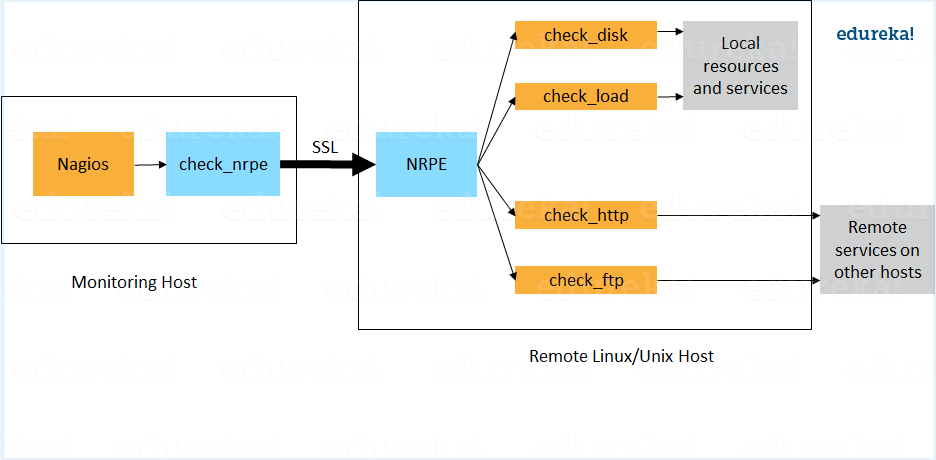
The NRPE addon is designed to allow you to execute Nagios plugins on remote Linux/Unix machines. The main reason for doing this is to allow Nagios to monitor “local” resources (like CPU load, memory usage, etc.) on remote machines. Since these public resources are not usually exposed to external machines, an agent like NRPE must be installed on the remote Linux/Unix machines.
Now I will advise you to explain the NRPE architecture on the basis of diagram shown below.
The NRPE addon consists of two pieces:
The check_nrpe plugin, which resides on the local monitoring machine.
The NRPE daemon, which runs on the remote Linux/Unix machine.
There is a SSL (Secure Socket Layer) connection between monitoring host and the remote host as shown in the diagram.
My advise will be to follow the below mention flow for this answer:
Both Configuration and Logs can be stored in a backend. Configurations are stored in backend using NagiosQL. Historical data are stored using ndoutils. In addition, you also have nagdb and opdb.
Now, the next set of Nagios interview questions will dig in deep so be prepared.
According to me the answer should start by explaining what is Passive check.
Passive checks are initiated and performed by external applications/processes and the Passive check results are submitted to Nagios for processing.
Now I will advise you to explain the need for Passive check.
Passive checks are useful for monitoring services that are Asynchronous in nature and cannot be monitored effectively by polling their status on a regularly scheduled basis. It can also be used for monitoring services that are Located behind a firewall and cannot be checked actively from the monitoring host.
Interviewer will now dig deep, so the next set of Nagios interview questions will test your experience with Nagios.
Make sure that you stick to the question during your explanation so I will advise you to follow the below mentioned flow:
Nagios check for external commands under the following conditions:
For this answer first point out the basic difference Active and Passive check.
The major difference between Active and Passive checks is that Active checks are initiated and performed by Nagios, while passive checks are performed by external applications.
If your interviewer is looking unconvinced with the above explanation then I will suggest you to also mention some key features of both Active and Passive checks:
Passive checks are useful for monitoring services that are:
The main features of Actives checks are as follows:
Interviewer is expecting an answer related to the distributed architecture of Nagios so I will suggest you to answer it in the below mentioned format:
With Nagios you can monitor your whole enterprise by using a distributed monitoring scheme in which local slave instances of Nagios perform monitoring tasks and report the results back to a single master. You manage all configuration, notification, and reporting from the master, while the slaves do all the work. This design takes advantage of Nagios’s ability to utilize passive checks i.e. external applications or processes that send results back to Nagios. In a distributed configuration, these external applications are other instances of Nagios.
I will suggest you to first mention what this main configuration file contains and its function.
The main configuration file contains a number of directives that affect how the Nagios daemon operates. This config file is read by both the Nagios daemon and the CGIs (It specifies the location of your main configuration file).
Now you can tell where it is present and how it is created.
A sample main configuration file is created in the base directory of the Nagios distribution when you run the configure script. The default name of the main configuration file is nagios.cfg, it is usually placed in the etc/ subdirectory of you Nagios installation (i.e. /usr/local/nagios/etc/).
I hope you have enjoyed the above set of Nagios interview questions, the next set of questions will be more challenging, so be prepared.
I will advise you to first explain Flapping first.
Flapping occurs when a service or host changes state too frequently, this causes lot of problem and recovery notifications.
Once you have defined Flapping explain how Nagios detects Flapping.
Whenever Nagios checks the status of a host or service, it will check to see if it has started or stopped flapping. Nagios follow the below procedure to do that:
According to me the proper format for this answer should be:
First name the variables and then a small explanation of each of these variables:
Now I will give a small explanation for each of these variables.
Name is a placeholder that is used by other objects. Use defines the “parent” object whose properties should be used. Register can have a value of 0 (indicating its only a template) and 1 (an actual object). The register value is never inherited.
Answer to this question is pretty direct I will answer this by saying:
One of the features of Nagios is object configuration format in that you can create object definitions that inherit properties from other object definitions and hence the name. This simplifies and clarifies relationships between various components.
I will advise you to first give a small introduction on State Stalking.
State Stalking is used for logging purposes. When Stalking is enabled for a particular host or service, Nagios will watch that host or service very carefully and log any changes it sees in the output of check results.
Depending on the discussion between you and interviewer you can also add:
It can be very helpful in later analysis of the log files. Under normal circumstances, the result of a host or service check is only logged if the host or service has changed state since it was last checked.
First I will suggest you to explain:
When Nagios says a node is unreachable, a node is unreachable if Nagios is not able to find a path to the node.
Now you can mention the difference.
The node itself may be up but because Nagios is unable to connect to it, it has to mark this as unreachable. To achieve this, Nagios use parent-child relationship between components.
Finally for better understanding explain it with an example.
A router may be defined as a parent for a server.
According to me the best way to put this answer is by saying:
The current state of monitored services and hosts is determined by two components:
There are two types of states SOFT states and HARD states.
Now explain what is Soft and Hard states:
This is the end of my blog on Nagios interview questions and if you want in-depth knowledge about the whole DevOps life-cycle click on the button below:
These Nagios interview questions are more than enough to help you get your dream job.
I have included the frequently asked Nagios interview questions. If you have more questions in your mind just type it in the comment box below and we will reply you ASAP.
If you found this blog on Nagios Interview Questions relevant, check out the DevOps training by Edureka, a trusted online learning company with a network of more than 250,000 satisfied learners spread across the globe. The Edureka DevOps Certification Training course helps learners gain expertise in various DevOps processes and tools such as Puppet, Jenkins, Nagios and GIT for automating multiple steps in SDLC.


 Thank you for registering Join Edureka Meetup community for 100+ Free Webinars each month JOIN MEETUP GROUP