Zulaikha LateefZulaikha is a tech enthusiast working as a Research Analyst at Edureka.Zulaikha is a tech enthusiast working as a Research Analyst at Edureka.
The world has changed since Artificial Intelligence, Machine Learning, and Deep learning were introduced and will continue to do so in the years to come. In this Machine Learning Interview Questions in 2025 blog, I have collected the most frequently asked questions by interviewers. These questions are collected after consulting with Machine Learning Python certification training experts.
You may go through this recording of Machine Learning Interview Questions and Answers where our instructor has explained the topics in a detailed manner with examples that will help you to understand this concept better.
This Edureka video on Machine Learning Interview Questions and Answers will help you to prepare yourself for Data Science / Machine Learning interviews.
In case you have attended any Machine Learning interview in the recent past, do paste those interview questions in the comments section and we’ll answer them at the earliest. You can also comment below if you have any questions in your mind, which you might face in your Machine Learning interview.
In this blog on Machine Learning Interview Questions, I will be discussing the top Machine Learning related questions asked in your interviews. So, for your better understanding I have divided this blog into the following 3 sections:
In order to address various issues and opportunities in the fields of artificial intelligence, computer science, and data analysis, machine learning was developed. Here are some main explanations for the introduction of machine learning:
Complex Problem Solving: Machine learning was created to address complex issues that traditional rule-based programming cannot or will not be able to address. Making sense of huge amounts of data, spotting patterns, and making predictions are frequent components of these issues.
Data Explosion: In recent decades, the generation and collection of data have grown exponentially. Machine learning offers tools and techniques to make predictions, automate decision-making procedures, and extract practical insights from this enormous amount of data.
Automation: Previously manual tasks could now be automated thanks to machine learning.This is crucial because automating processes can lead to significant cost savings and productivity gains in industries like manufacturing, logistics, and customer service.
Adaptability: Machine learning models can modify and improve their performance as they are exposed to more data. This adaptability is advantageous in dynamic environments where underlying patterns and relationships may change over time.
Natural Language Processing: Natural language understanding and generation have advanced thanks to machine learning and are now a necessary component of applications like chatbots, language translation, sentiment analysis, and content recommendation systems.
Individualization: Machine learning is used to produce individualized user experiences, such as specialized product recommendations, content recommendations, and targeted advertising.
Image and Speech Recognition: For systems to recognize objects in images, translate spoken words, and even understand the sentiment of written or spoken language, machine learning is crucial.
Scientific Research: In fields like genomics, climate modeling, and drug discovery, machine learning is used to analyze large datasets, simulate natural phenomena, and make predictions.
Security and Fraud Detection: To identify and stop security threats, machine learning is used to identify malware, network intrusions, and fraudulent transactions.
Healthcare: To enhance patient care and outcomes, machine learning is used in medical diagnosis, drug discovery, and treatment planning.
Virtual personal assistants: Siri, Google Assistant, and Alexa are a few examples of virtual personal assistants that use machine learning to comprehend and answer questions in natural language.
Q2. Why is machine learning important?
Machine learning, a subfield of artificial intelligence, empowers computers to draw insights from data and forecast outcomes. By leveraging specialized algorithms, these systems can process data, identify underlying trends, and formulate decisions. The landscape of machine learning can be segmented into three primary methods:
Supervised learning: This involves training computers using pre-annotated data, facilitating the generation of accurate predictions based on this reference.
Unsupervised learning: In this method, computers analyze unlabeled data, striving to discern inherent structures or correlations autonomously.
Reinforcement learning: Here, the machine refines its decisions by learning from the consequences of its actions, essentially through trial and error.
Applications of machine learning are vast, encompassing fields like self-driving vehicles, visual perception, linguistic understanding, and personalized content suggestions.
Q3.How are clustering algorithms used in real-world settings?
Clustering algorithms are frequently used to gather together similar data points in a wide range of real-world applications. Applications of clustering algorithms include the following:
Customer segmentation: Businesses use clustering to group customers with similar purchasing patterns and preferences. This information may be used for targeted marketing and product recommendations.
Image segmentation: Clustering is a technique used in image processing to separate images into useful regions. It can tell the difference between the foreground and background in computer vision applications.
Detection of Anomalies: Clustering can be used to find anomalies or outliers in datasets, which is important for network security, fraud detection, and quality assurance.
Document Clustering: By combining related documents, clustering algorithms can help with topic modeling, information retrieval, and organizing massive document collections.
Genomic Analysis: In genomics research, clustering is used to classify genes with comparable expression patterns, assisting in the understanding of gene relationships and functions.
Recommendation Systems: Cooperative filtering-based recommendation systems are more effective when users with similar preferences are grouped together using clustering.
Social Network Analysis: Clustering identifies communities or groups within social networks, which is helpful for recommending content, understanding network dynamics, and targeting advertising.
Market Basket Analysis: Clustering is a useful tool for determining which products are frequently bought together in retail, which is important for inventory management and marketing plans.
Natural Language Processing: Information retrieval, topic modeling, and sentiment analysis are all aided by clustering, which groups similar text documents, sentences, or words.
Healthcare: Clustering is used in personalized medicine and healthcare planning to help with disease classification and patient profiling.
Image Compression: In order to reduce the data size while maintaining image quality, clustering can be used to group similar pixel values in both image and video compression.
Sensor Data Analysis: In order to identify patterns, anomalies, and trends in a variety of industries, including manufacturing and environmental monitoring, clustering is used to group sensor data from IoT devices.
Geographical Data: Clustering can be used to group geographical locations with similar properties for urban planning, market analysis, and environmental studies.
These are only a few examples; clustering algorithms are widely used in many fields to analyze data, draw conclusions, and spot patterns.Depending on the goals of the application and the kind of data, a different clustering algorithm may be used.
Q4. What are the different types of Machine Learning?
Supervised Learning
Unsupervised Learning
Reinforcement Learning
Definition
The machine learns by using labelled data
The machine is trained on labelled data without any guidance
An agent interacts with its environment by producing actions & discovers errors or rewards
Types of Problems
Regression or Classification
Association or Classification
Reward Based
Types of Data
Labelled Data
Unlabelled Data
No pre-defined data
Training
External Supervision
No Supervision
No Supervision
Approach
Map Labelled input to known output
Understand pattern and discover output
Follow trail and error method
Popular Algorithms
Linear regression, Logistic regression, SVM, KNN, etc
Supervised learning is a method in which the machine learns using labeled data.
It is like learning under the guidance of a teacher
Training dataset is like a teacher which is used to train the machine
Model is trained on a pre-defined dataset before it starts making decisions when given new data
Unsupervised Learning:
Unsupervised learning is a method in which the machine is trained on unlabelled data or without any guidance
It is like learning without a teacher.
Model learns through observation & finds structures in data.
Model is given a dataset and is left to automatically find patterns and relationships in that dataset by creating clusters.
Reinforcement Learning:
Reinforcement learning involves an agent that interacts with its environment by producing actions & discovers errors or rewards.
It is like being stuck in an isolated island, where you must explore the environment and learn how to live and adapt to the living conditions on your own.
Model learns through the hit and trial method
It learns on the basis of reward or penalty given for every action it performs
Q5. How would you explain Machine Learning to a school-going kid?
Suppose your friend invites you to his party where you meet total strangers. Since you have no idea about them, you will mentally classify them on the basis of gender, age group, dressing, etc.
In this scenario, the strangers represent unlabeled data and the process of classifying unlabeled data points is nothing but unsupervised learning.
Since you didn’t use any prior knowledge about people and classified them on-the-go, this becomes an unsupervised learning problem.
Q6. How does Deep Learning differ from Machine Learning?
Deep Learning
Machine Learning
Deep Learning is a form of machine learning that is inspired by the structure of the human brain and is particularly effective in feature detection.
Machine Learning is all about algorithms that parse data, learn from that data, and then apply what they’ve learned to make informed decisions.
Deep Learning vs Machine Learning – Machine Learning Interview Questions – Edureka
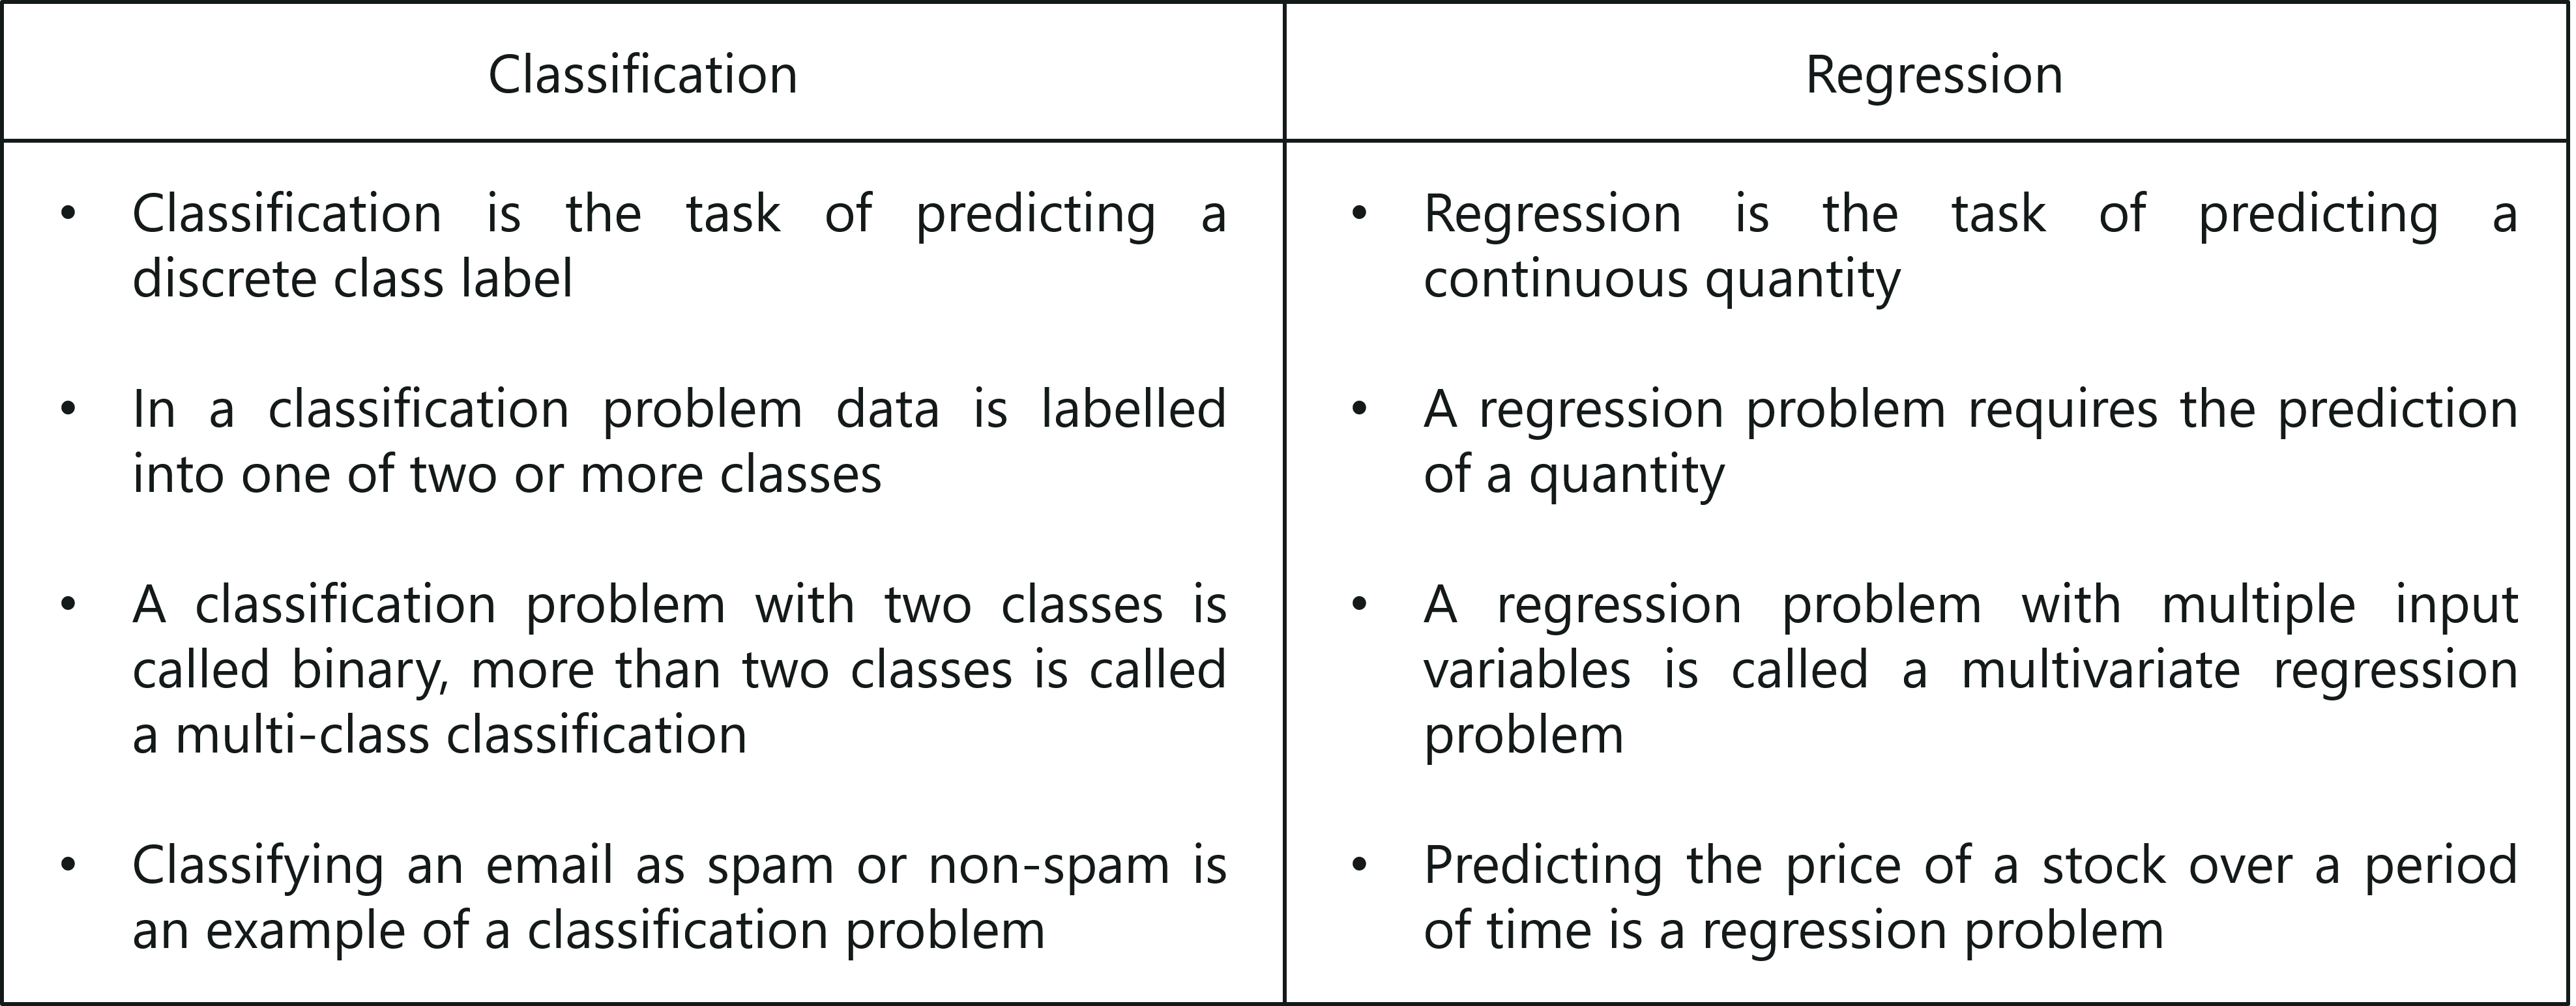
Q7. Explain Classification and Regression
Classification vs Regression – Machine Learning Interview Questions – Edureka
ChatGPT Tutorial | ChatGPT Explained | What is ChatGPT ? | Edureka
This 𝐂𝐡𝐚𝐭𝐆𝐏𝐓 𝐓𝐮𝐭𝐨𝐫𝐢𝐚𝐥 is intended as a Crash Course on 𝐂𝐡𝐚𝐭𝐆𝐏𝐓 for Beginners. 𝐂𝐡𝐚𝐭𝐆𝐏𝐓 has been growing in popularity exponentially. But, 𝐂𝐡𝐚𝐭𝐆𝐏𝐓 is still not known to many people. In this video, I aim to show you the different ways in which you can use 𝐂𝐡𝐚𝐭𝐆𝐏𝐓 for yourself. 𝐂𝐡𝐚𝐭𝐆𝐏𝐓 has been the buzzword for a while now. This yap lab was put on the throne 5 days after its release and has been changing the game ever since.
Q8. What is ‘Naive’ in a Naive Bayes?
The word “naive” in “Naive Bayes” refers to an assumption that this classification algorithm makes to make things simpler. The “naive” assumption is that, given the class label, all features used to predict a class are independent of one another. Although the Naive Bayes algorithm makes the assumption that features are independent for the sake of simplicity, features in many real-world datasets are frequently correlated or dependent on one another.
Despite this oversimplification, the Naive Bayes algorithm can perform surprisingly well in a wide range of real-world classification tasks, including text classification and spam email detection. It is computationally effective and simple to implement due to its simplicity. Deep learning models, decision trees, and random forests are examples of more complex machine learning algorithms that may be more appropriate in situations where feature independence does not hold.
Q9. What do you understand by selection bias?
It is a statistical error that causes a bias in the sampling portion of an experiment.
The error causes one sampling group to be selected more often than other groups included in the experiment.
Selection bias may produce an inaccurate conclusion if the selection bias is not identified.
Q10. What do you understand by Precision and Recall?
Let me explain you this with an analogy:
Imagine that, your girlfriend gave you a birthday surprise every year for the last 10 years. One day, your girlfriend asks you: ‘Sweetie, do you remember all the birthday surprises from me?’
To stay on good terms with your girlfriend, you need to recall all the 10 events from your memory. Therefore, recall is the ratio of the number of events you can correctly recall, to the total number of events.
If you can recall all 10 events correctly, then, your recall ratio is 1.0 (100%) and if you can recall 7 events correctly, your recall ratio is 0.7 (70%)
However, you might be wrong in some answers.
For example, let’s assume that you took 15 guesses out of which 10 were correct and 5 were wrong. This means that you can recall all events but not so precisely
Therefore, precision is the ratio of a number of events you can correctly recall, to the total number of events you can recall (mix of correct and wrong recalls).
From the above example (10 real events, 15 answers: 10 correct, 5 wrong), you get 100% recall but your precision is only 66.67% (10 / 15)
Q11. Explain false negative, false positive, true negative and true positive with a simple example.
Let’s consider a scenario of a fire emergency:
True Positive: If the alarm goes on in case of a fire. Fire is positive and prediction made by the system is true.
False Positive: If the alarm goes on, and there is no fire. System predicted fire to be positive which is a wrong prediction, hence the prediction is false.
False Negative: If the alarm does not ring but there was a fire. System predicted fire to be negative which was false since there was fire.
True Negative: If the alarm does not ring and there was no fire. The fire is negative and this prediction was true.
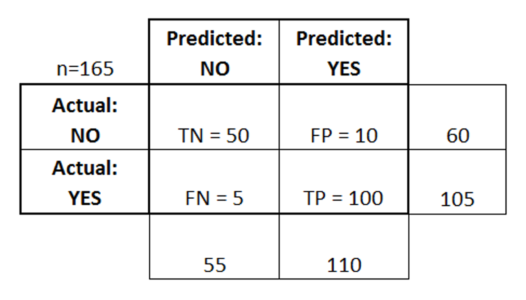
Q12. What is a Confusion Matrix?
A confusion matrix or an error matrix is a table which is used for summarizing the performance of a classification algorithm.
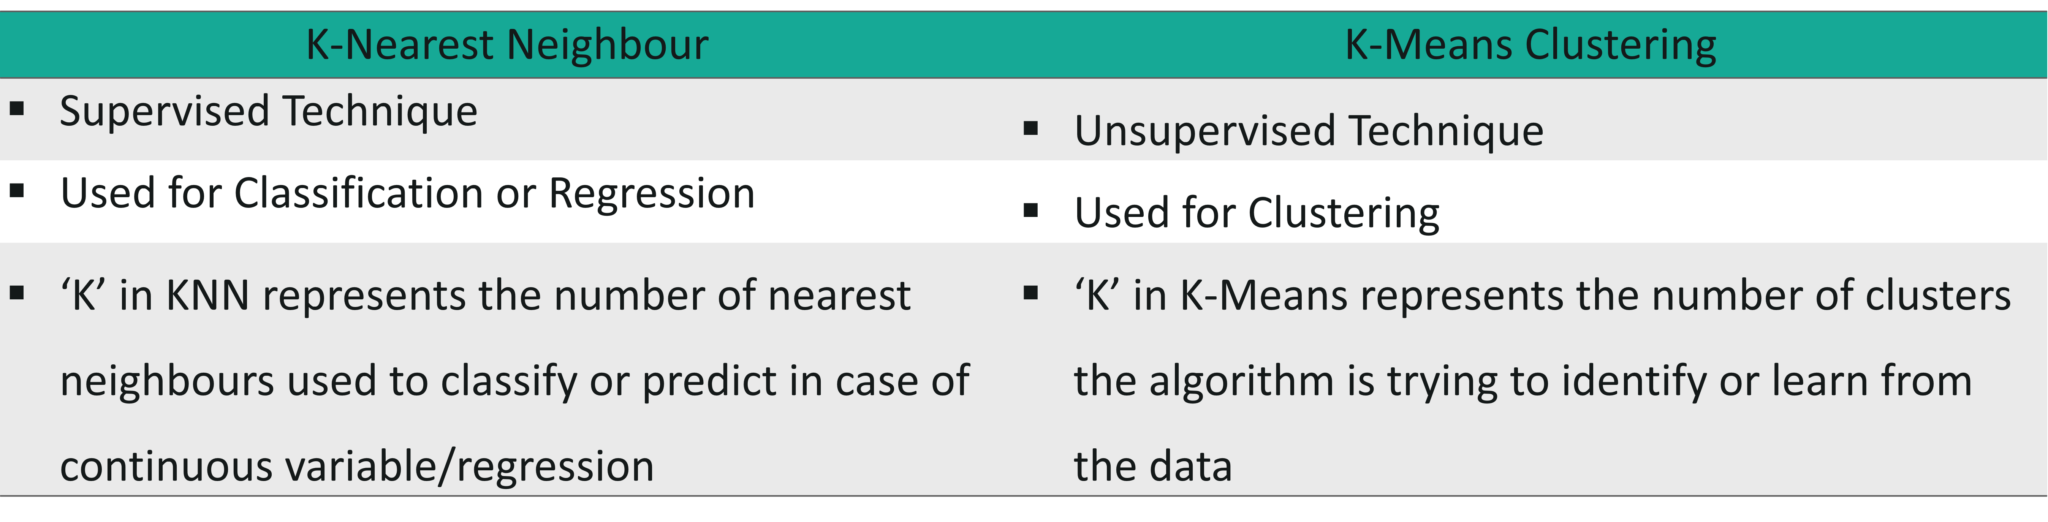
Q14. How is KNN different from K-means clustering?
K-means vs KNN – Machine Learning Interview Questions – Edureka
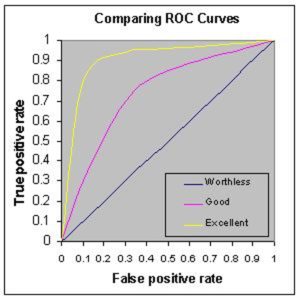
Q15. What is ROC curve and what does it represent?
Receiver Operating Characteristic curve (or ROC curve) is a fundamental tool for diagnostic test evaluation and is a plot of the true positive rate (Sensitivity) against the false positive rate (Specificity) for the different possible cut-off points of a diagnostic test.
It depends on the question as well as on the domain for which we are trying to solve the problem. If you’re using Machine Learning in the domain of medical testing, then a false negative is very risky, since the report will not show any health problem when a person is actually unwell. Similarly, if Machine Learning is used in spam detection, then a false positive is very risky because the algorithm may classify an important email as spam.
Q18. Which is more important to you – model accuracy or model performance?
Model Accuracy vs Performance – Machine Learning Interview Questions – Edureka
Well, you must know that model accuracy is only a subset of model performance. The accuracy of the model and performance of the model are directly proportional and hence better the performance of the model, more accurate are the predictions.
Q19. What is the difference between Gini Impurity and Entropy in a Decision Tree?
Gini Impurity and Entropy are the metrics used for deciding how to split a Decision Tree.
Gini measurement is the probability of a random sample being classified correctly if you randomly pick a label according to the distribution in the branch.
Entropy is a measurement to calculate the lack of information. You calculate the Information Gain (difference in entropies) by making a split. This measure helps to reduce the uncertainty about the output label.
Q20. What is the difference between Entropy and Information Gain?
Entropy is an indicator of how messy your data is. It decreases as you reach closer to the leaf node.
The Information Gain is based on the decrease in entropy after a dataset is split on an attribute. It keeps on increasing as you reach closer to the leaf node.
Q21. What is Overfitting? And how do you ensure you’re not overfitting with a model?
Over-fitting occurs when a model studies the training data to such an extent that it negatively influences the performance of the model on new data.
This means that the disturbance in the training data is recorded and learned as concepts by the model. But the problem here is that these concepts do not apply to the testing data and negatively impact the model’s ability to classify the new data, hence reducing the accuracy on the testing data.
Three main methods to avoid overfitting:
Collect more data so that the model can be trained with varied samples.
Use ensembling methods, such as Random Forest. It is based on the idea of bagging, which is used to reduce the variation in the predictions by combining the result of multiple Decision trees on different samples of the data set.
Choose the right algorithm.
Q22. What are Support Vectors in SVM?
In a Support Vector Machine (SVM) model, support vectors are the data points from the training dataset that are closest to the decision boundary (hyperplane). These are the crucial data points that affect the hyperplane’s position and orientation. The margin, which is the separation between the hyperplane and the support vectors, is largely determined by the support vectors. While ensuring that the support vectors are correctly classified, SVM aims to maximize this margin. Since they are frequently the ones where the decision boundary is closest to the data points of different classes, these are the most crucial data points.
Q23. What are Different Kernels in SVM?
Using kernel functions, SVM is capable of handling both linear and non-linear classification tasks. Data is transformed by kernels into a higher-dimensional space that allows for linear separation.
Typical kernel operations in SVM include:
Linear Kernel: It is appropriate for data that can be separated linearly and represents a linear decision boundary (hyperplane).
Polynomial Kernel: It uses polynomial functions to map data into a higher-dimensional space, which can capture non-linear relationships.
RBF Kernel: The RBF kernel is helpful for simulating intricate, non-linear decision boundaries. One of the most popular kernels in SVM is this one.
Sigmoid Kernel: SVMs that are modeled after neural networks frequently employ the sigmoid kernel.
Q24: What does cross-validation entail?
Machine learning models are assessed for their effectiveness and applicability, through a technique known as cross validation. This involves dividing the dataset into subsets with one subset used for training the model and the rest used for evaluation. Stratified cross validation leaves one out cross validation and k fold cross validation are employed methods in this process. Cross validation allows us to select a model, tune its hyperparameters and estimate how well it performs on unseen data.
Q25. What does bias in machine learning mean?
In machine learning, the term “bias” refers to the error produced when a complex real-world problem is approximated by a model that is overly simplistic. Making assumptions that are not supported by the data themselves or underfitting the data could be the issue. A high bias model performs poorly in prediction because it is oversimplified and may not be able to recognize the underlying patterns in the data. The two most common ways to reduce bias are by addressing modeling assumptions or using more complex models. To create an effective model, bias and variance must be properly balanced.
Q26: What is PCA? What circumstances do you use it in?
PCA stands for principal component analysis. It is a dimensionality reduction technique used in data analysis and machine learning. The main objective of PCA is to reduce the number of features (or variables) in a dataset while maintaining the important specifics, patterns, and connections between the data points.
When to Use PCA:
PCA is applied in a variety of circumstances, such as:
Dimensionality Reduction: This is the process of reducing the number of features in a dataset with a lot of features (high-dimensional data) in order to speed up computation, make analysis easier, or avoid overfitting. It is especially useful when features exhibit high levels of multicollinearity (multicollinearity).
Visualization: By enabling the visualization of high-dimensional data in a lower-dimensional space (such as 2D or 3D), PCA can help to preserve the most crucial information. This is useful for investigating and interpreting data.
Noise Reduction: By focusing on the most important components, PCA can help eliminate or lessen the impact of noise or uninformative features in your data.
Feature Engineering: PCA can be used to develop new features that are linear combinations of the original features. These new features may be more informative and less correlated.
Machine Learning: When you have a limited amount of data, reducing the dimensionality of the data with PCA can help machine learning models perform better.
Data compression: PCA can assist in representing data with fewer bits while maintaining essential information in data compression applications.
It’s crucial to note, though, that PCA simplifies things by assuming that linear combinations of features can capture the majority of the data’s variation. If this presumption is incorrect, PCA might not be the best option and more sophisticated dimensionality reduction techniques might be required. Additionally, you should carefully weigh the trade-offs between dimensionality reduction and the potential loss of information when using PCA.
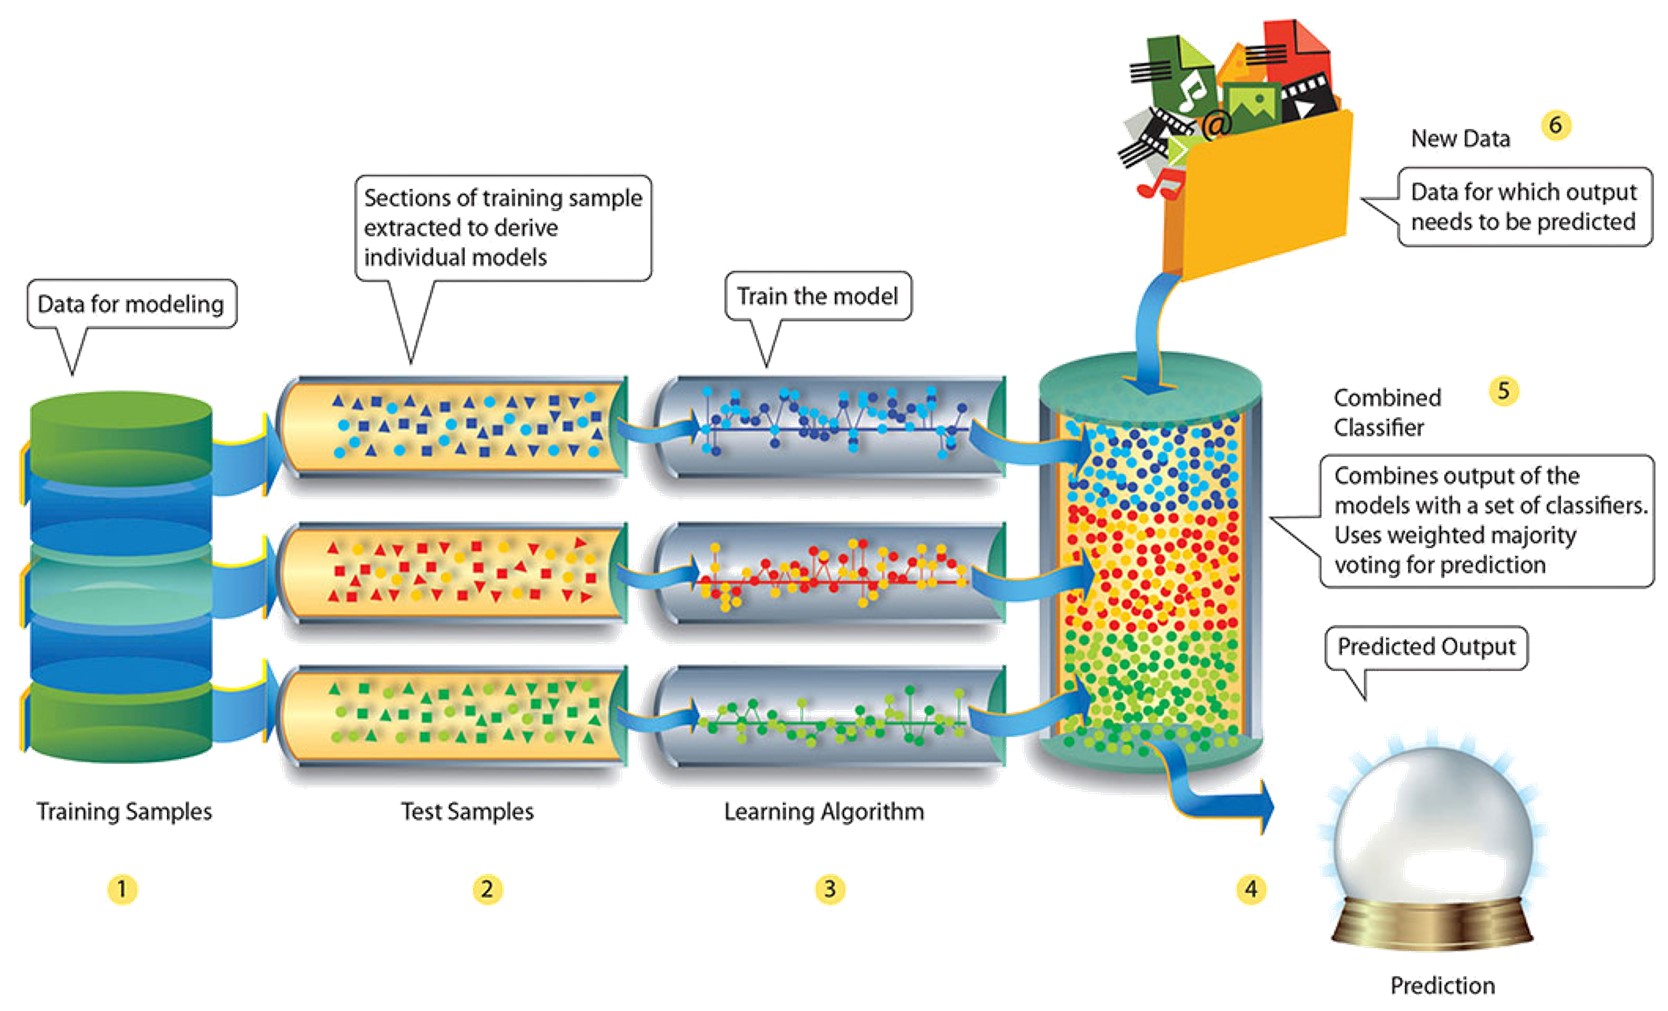
Q27.Explain Ensemble learning technique in Machine Learning.
Ensemble learning is a technique that is used to create multiple Machine Learning models, which are then combined to produce more accurate results. A general Machine Learning model is built by using the entire training data set. However, in Ensemble Learning the training data set is split into multiple subsets, wherein each subset is used to build a separate model. After the models are trained, they are then combined to predict an outcome in such a way that the variance in the output is reduced.
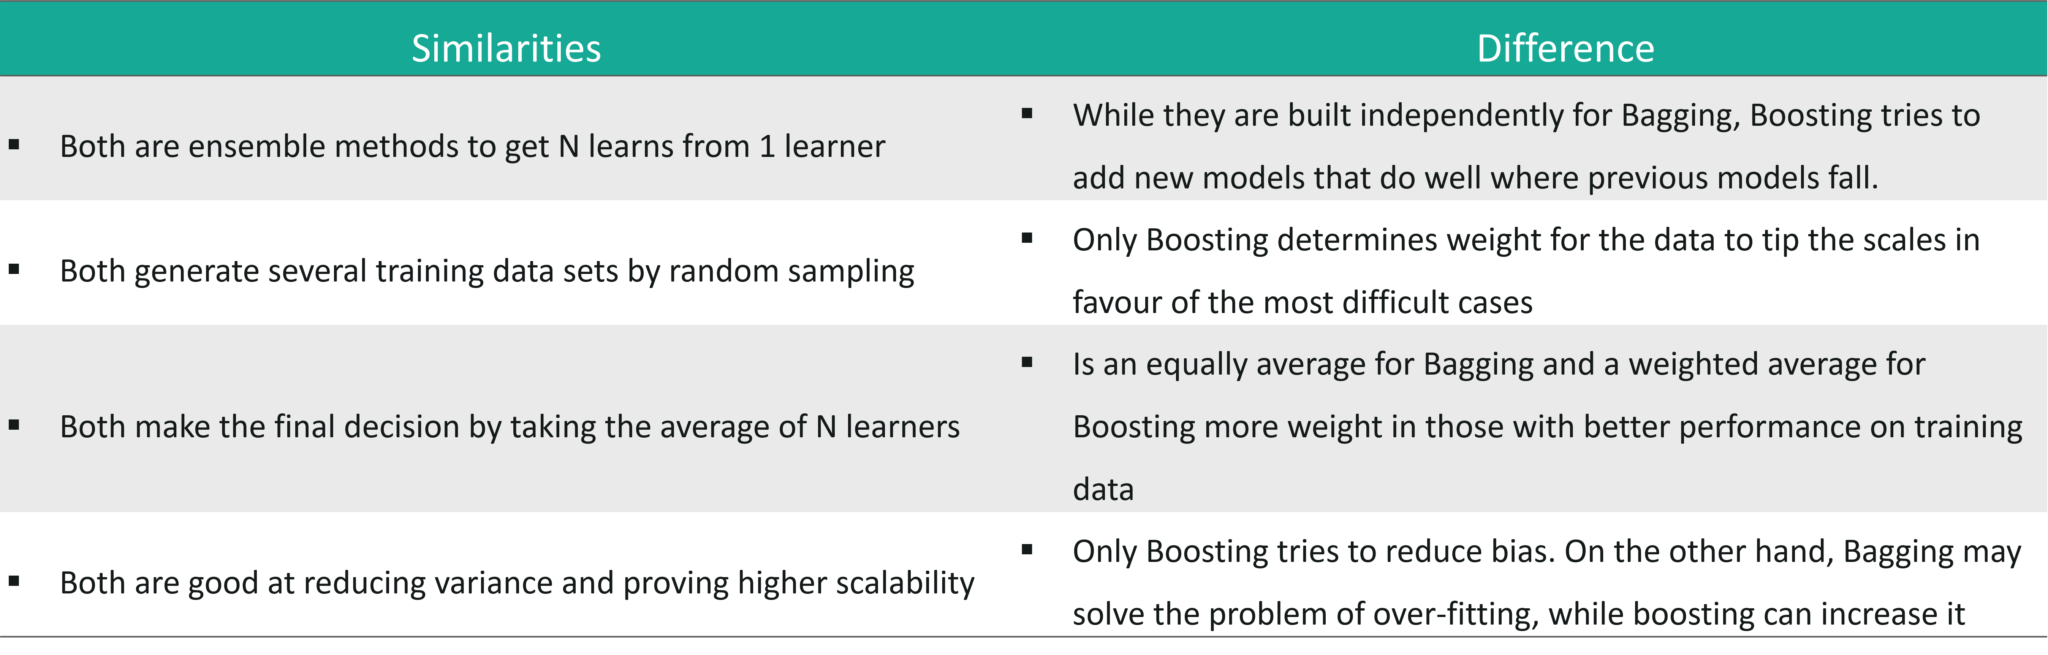
Q28. What is bagging and boosting in Machine Learning?
Q29. How would you screen for outliers and what should you do if you find one?
The following methods can be used to screen outliers:
Boxplot: A box plot represents the distribution of the data and its variability. The box plot contains the upper and lower quartiles, so the box basically spans the Inter-Quartile Range (IQR). One of the main reasons why box plots are used is to detect outliers in the data. Since the box plot spans the IQR, it detects the data points that lie outside this range. These data points are nothing but outliers.
Probabilistic and statistical models: Statistical models such as normal distribution and exponential distribution can be used to detect any variations in the distribution of data points. If any data point is found outside the distribution range, it is rendered as an outlier.
Linear models: Linear models such as logistic regression can be trained to flag outliers. In this manner, the model picks up the next outlier it sees.
Proximity-based models: An example of this kind of model is the K-means clustering model wherein, data points form multiple or ‘k’ number of clusters based on features such as similarity or distance. Since similar data points form clusters, the outliers also form their own cluster. In this way, proximity-based models can easily help detect outliers.
How do you handle these outliers?
If your data set is huge and rich then you can risk dropping the outliers.
However, if your data set is small then you can cap the outliers, by setting a threshold percentile. For example, the data points that are above the 95th percentile can be used to cap the outliers.
Lastly, based on the data exploration stage, you can narrow down some rules and impute the outliers based on those business rules.
Q30. What are collinearity and multicollinearity?
Collinearity occurs when two predictor variables (e.g., x1 and x2) in a multiple regression have some correlation.
Multicollinearity occurs when more than two predictor variables (e.g., x1, x2, and x3) are inter-correlated.
Q31. What do you understand by Eigenvectors and Eigenvalues?
Eigenvectors:Eigenvectors are those vectors whose direction remains unchanged even when a linear transformation is performed on them.
Eigenvalues: Eigenvalue is the scalar that is used for the transformation of an Eigenvector.
In the above example, 3 is an Eigenvalue, with the original vector in the multiplication problem being an eigenvector.
The Eigenvector of a square matrix A is a nonzero vector x such that for some number λ, we have the following:
Ax = λx,
where λ is an Eigenvalue So, in our example, λ = 3 and X = [1 1 2]
Q32. What is A/B Testing?
A/B is Statistical hypothesis testing for randomized experiment with two variables A and B. It is used to compare two models that use different predictor variables in order to check which variable fits best for a given sample of data.
Consider a scenario where you’ve created two models (using different predictor variables) that can be used to recommend products for an e-commerce platform.
A/B Testing can be used to compare these two models to check which one best recommends products to a customer.
It is a process of randomly selecting intact groups within a defined population, sharing similar characteristics.
Cluster Sample is a probability sample where each sampling unit is a collection or cluster of elements.
For example, if you’re clustering the total number of managers in a set of companies, in that case, managers (samples) will represent elements and companies will represent clusters.
Q34.Running a binary classification tree algorithm is quite easy. But do you know how the tree decides on which variable to split at the root node and its succeeding child nodes?
Measures such as, Gini Index and Entropy can be used to decide which variable is best fitted for splitting the Decision Tree at the root node.
We can calculate Gini as following: Calculate Gini for sub-nodes, using the formula – sum of square of probability for success and failure (p^2+q^2).
Calculate Gini for split using weighted Gini score of each node of that split
Entropy is the measure of impurity or randomness in the data, (for binary class):
Here p and q is the probability of success and failure respectively in that node.
Entropy is zero when a node is homogeneous and is maximum when both the classes are present in a node at 50% – 50%. To sum it up, the entropy must be as low as possible in order to decide whether or not a variable is suitable as the root node.
Q35. Explain SVM Algorithm in Detail
A strong supervised machine learning algorithm used for classification and regression tasks is called the Support Vector Machine (SVM). It functions by identifying a hyperplane (a decision boundary) in a high-dimensional feature space that best categorizes data points.
The SVM algorithm is explained in detail below:
Data Preparation:
A labeled dataset of data points with corresponding class labels forms the basis of SVM. A set of features is used to represent each data point.
Feature Space:
The high-dimensional feature space in which SVM operates assigns a dimension to each feature. The goal is to identify the best hyperplane for separating data points from various classes.
Linear Separability:
The SVM makes the assumption that the data can be cleanly divided into two or more distinct classes and that the data is linearly separable. Since not all datasets can be separated linearly in practice, SVM can be extended to handle non-linear data using methods like kernel functions (discussed in more detail below).
Margin and Support Vectors:
SVM attempts to locate a hyperplane that maximizes margin, which is the separation between the hyperplane and the closest data points from each class. “Support vectors” are the nearest data points. The margin is a measure of the model’s perceived accuracy in classifying new data.
Objective Function:
In the SVM optimization problem, the margin is maximized while the classification error is minimized. This is accomplished by solving an optimization problem under constraints with a cost parameter (C) that manages the trade-off between maximizing the margin and reducing classification errors.
Kernel Functions:
SVM can use kernel functions to map data into a higher-dimensional space where linear separation is possible when the data cannot be separated in a linear fashion. The linear kernel, polynomial kernel, radial basis function (RBF) kernel, and others are typical kernel functions.
Training:
Finding the hyperplane and its parameters that satisfy the optimization problem is the first step in the SVM training process. Usually, optimization methods like the Sequential Minimal Optimization (SMO) algorithm are used for this.
Classification:
The SVM model can classify fresh, unlabeled data points by figuring out which side of the hyperplane they fall on after it has been trained. Data points are categorized based on the decision function’s sign, which calculates how far they are from the hyperplane.
Hyperparameter Tuning:
To get the best model performance, SVM has hyperparameters that need to be adjusted, such as the kernel selection, C parameter, and kernel-specific parameters. Cross-validation techniques are frequently used for this.
Multi-Class Classification:
SVM is a binary classification algorithm by nature.For multi-class problems, SVM is extended to handle multiple classes using methods like one-vs-all (OvA) or one-vs-one (OvO).
SVM is renowned for its proficiency with high-dimensional data, robustness to outliers, and efficiency in both linear and non-linear classification tasks.
Machine Learning With Python Questions
This set of Machine Learning interview questions deal with Python-related Machine Learning questions.
Q1. Name a few libraries in Python used for Data Analysis and Scientific Computations.
Here is a list of Python libraries mainly used for Data Analysis:
NumPy
SciPy
Pandas
SciKit
Matplotlib
Seaborn
Bokeh
Q2. Which library would you prefer for plotting in Python language: Seaborn or Matplotlib or Bokeh?
It depends on the visualization you’re trying to achieve. Each of these libraries is used for a specific purpose:
Matplotlib: Used for basic plotting like bars, pies, lines, scatter plots, etc
Seaborn: Is built on top of Matplotlib and Pandas to ease data plotting. It is used for statistical visualizations like creating heatmaps or showing the distribution of your data
Bokeh: Used for interactive visualization. In case your data is too complex and you haven’t found any “message” in the data, then use Bokeh to create interactive visualizations that will allow your viewers to explore the data themselves
Q3. How are NumPy and SciPy related?
NumPy is part of SciPy.
NumPy defines arrays along with some basic numerical functions like indexing, sorting, reshaping, etc.
SciPy implements computations such as numerical integration, optimization and machine learning using NumPy’s functionality.
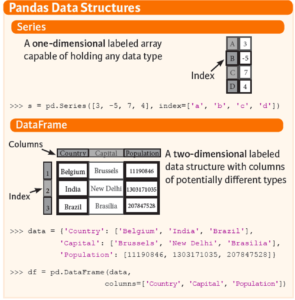
Q4. What is the main difference between a Pandas series and a single-column DataFrame in Python?
Pandas Series vs DataFrame – Machine Learning Interview Questions – Edureka
Q5. How can you handle duplicate values in a dataset for a variable in Python?
Consider the following Python code:
bill_data=pd.read_csv("datasetsTelecom Data AnalysisBill.csv")
bill_data.shape
#Identify duplicates records in the data
Dupes = bill_data.duplicated()
sum(dupes)
#Removing Duplicates
bill_data_uniq = bill_data.drop_duplicates()
Q6. Write a basic Machine Learning program to check the accuracy of a model, by importing any dataset using any classifier?
#importing dataset
import sklearn
from sklearn import datasets
iris = datasets.load_iris()
X = iris.data
Y = iris.target

#splitting the dataset
from sklearn.cross_validation import train_test_split
X_train, Y_train, X_test, Y_test = train_test_split(X,Y, test_size = 0.5)

#Selecting Classifier
my_classifier = tree.DecisionTreeClassifier()
My_classifier.fit(X_train, Y_train)
predictions = my_classifier(X_test)
#check accuracy
From sklear.metrics import accuracy_score
print accuracy_score(y_test, predictions)
Advanced Machine Learning Interview Questions
Q1.What is the F1 score? How might you employ it?
The F1 score is a well-liked metric in statistics and machine learning, particularly for binary classification problems. It combines precision into one score that strikes a balance between the two metrics of recall and additional metrics. When you want to strike a balance between being able to predict favorable outcomes with accuracy (high precision) and making sure you can name as many favorable instances as you can (high recall), the F1 score is especially helpful.
The following formula is used to determine the F1 score:
f1 score = 2.precision.recall/precision+recall
Where:
Precision:
Precision is the ratio of true positives to the total number of positive predictions. It measures the accuracy of positive predictions.
Recall, also known as sensitivity or true positive rate, is the ratio of true positives to the total number of actual positive instances. It measures the model’s ability to identify all positive instances.
The F1 score is particularly useful when you want to strike a balance between the metrics precision and recall.
You can use the F1 score to find a compromise that minimizes both types of errors when the effects of false positives and false negatives have different consequences.
When comparing different models or classifiers, the F1 score can help you evaluate their performance on binary classification tasks.
As it takes into account false positives and false negatives, it is frequently used in situations where there is a class imbalance (i.e., one class has significantly more examples than the other).
Q2.How do you define a neural network?
A machine learning model called a “neural network” takes its cues from how the human brain is organized and operates. In order to process and learn from data, it is made up of interconnected artificial neurons or nodes arranged into layers. A subset of machine learning called deep learning has recently gained a lot of popularity. A crucial component of this branch of learning is neural networks.
A neural network’s essential elements are as follows:
1. Input Layer: The neural network’s first layer, known as the input layer, takes in the initial data or features for processing.
2. Hidden Layers: The information you provide goes through layers, which are located between the input and output layers. The complexity of the task and the structure of the network determine the number of layers and neurons within them.
3. Output Layer: The final output of the network is produced by this layer, which may take the form of predictions, classifications, or any other desired output.
4. Weights and Biases: Each synaptic (neuronal connection) link has a weight that determines how strong the link is. To alter each neuron’s activation threshold, biases are added to the neuron.
5. Activation Function: Neurons in hidden and output layers often apply an activation function to their inputs. Common activation functions include sigmoid, ReLU (Rectified Linear Unit), and softmax, among others. These functions introduce non-linearity into the network, enabling it to model complex relationships in data.
6. Loss Function: The loss function measures the error or difference between the network’s predictions and the actual target values. The goal during training is to minimize this loss function.
7. Backpropagation: This method of training neural networks is iterative and based on optimization. The network modifies its weights and biases during backpropagation using gradient descent or other optimization techniques to reduce the loss.
Neural networks have proven to be extremely adaptable allowing them to excel in tasks such as speech and image recognition, natural language processing, autonomous driving, recommendation systems and more. The technical terms ” networks” or “deep learning models” are commonly used when referring to neural networks with multiple hidden layers. These deep architectures have shown effectiveness in handling multi dimensional data playing a significant role in the advancements of artificial intelligence in recent times.
Q3: What do Cost Functions and Loss Functions mean? Describe their main differences.
In the context of developing machine learning models, loss functions and cost functions are both utilized, but their functions are slightly different. The details of each and their primary distinctions are as follows:
Function of Loss:
Goal: A loss function, also referred to as an error function or objective function, assesses the error, or the discrepancy between the predicted values (output) and the actual target values (ground truth), for a single data point.
Application During Training: During training, the loss function is used to assess how well a machine learning model is performing on particular data points. It quantifies the model’s performance on a per-sample basis.
Optimization: To minimize the loss function, the goal of model training is to find the model’s parameters (weights and biases) that result in the least amount of error for each and every data point.
Illustration: For a classification task, the cross-entropy loss gauges how closely predicted class probabilities and actual class labels diverge for a single data point.
Cost-Based Function:
Objective: A cost function, also known as an objective function or loss function, determines the overall cost or error of the entire dataset by averaging the individual losses from all data points. It frequently acts as a gauge of the model’s effectiveness across the entire dataset.
Use during Training: During the training phase, the cost function is used to direct the model toward parameter values that minimize the overall error across the entire dataset.
Optimization: The objective is to minimize the cost function, which entails identifying the model parameters that produce the smallest overall dataset error.
Illustration: In linear regression, the mean squared error (MSE) is a typical cost function that computes the average squared difference between predicted and actual values for all data points.
Important variations
Scope: While the cost function combines these losses across the entire dataset, the loss function calculates the error for a single data point.
Application: During training, the loss function directs parameter updates for the model for a single data point, whereas the cost function directs parameter updates for the entire dataset. A model’s overall ability to fit the data is evaluated using the cost function.
Optimization: Loss function and cost function minimization is the aim of training. While minimizing the loss function ensures that the model makes accurate predictions for particular data points, minimizing the cost function ensures that the model performs well overall.
In summary, the cost function measures the overall error across the entire dataset, whereas the loss function measures the error at each individual data point.
Q4. How do you choose which machine learning algorithm to use?
Selecting the most effective machine learning algorithm for a task requires a combination of domain knowledge, data comprehension, experimentation, and a clear understanding of the problem you are trying to solve.
Picking the best machine learning algorithm is made easier by taking the steps below:
Recognize the Problem: Gain a firm understanding of the problem you’re attempting to fix. A problem’s type (classification, regression, clustering, etc.) and specific project goals or objectives should be determined.
Understand Your Data: Carefully review your dataset. Take into account elements like the size of your data, the number of features, and the data’s quality. Knowing your data will enable you to choose the best algorithms.
Consider Data Characteristics:
Think about the nature of your data:
Is it structured (tabular data) or unstructured (text, images, audio)?
Are there categorical or numerical features?
Does the data have outliers or missing values?
Are there complex relationships or non-linearity?
Evaluation of the problem’s complexity:
Is the relationship straightforward and linear, or do complicated, non-linear patterns play a role? Simple problems can often be solved using fundamental algorithms, whereas complex ones may call for more sophisticated methods.
Algorithm Selection:
Consider the following types of algorithms based on your problem and data:
Linear Models: Useful for linear relationships in regression or classification tasks.
Tree-Based Models: Decision trees, random forests, and gradient boosting are effective for structured data and can handle non-linear patterns.
Neural Networks: Ideal for complex, high-dimensional data, such as images or text.
Clustering Algorithms: Used for unsupervised tasks like grouping similar data points.
Anomaly Detection: Algorithms like Isolation Forest or One-Class SVM can be used to detect anomalies.
Dimensionality Reduction: PCA or t-SNE are helpful when dealing with high-dimensional data.
Time Series Models: When working with time series data, consider models like ARIMA or LSTM.
Experiment and Evaluate:
It’s essential to experiment with multiple algorithms. Split your data into training and testing sets, train different models, and evaluate their performance using appropriate metrics. Consider using techniques like cross-validation.
Hyperparameter Tuning:
Fine-tune the hyperparameters of the selected algorithm(s) to optimize their performance. Grid search or randomized search can help identify the best hyperparameters.
Ensemble Methods: To enhance model performance, think about using ensemble methods like bagging (such as Random Forest) or boosting (such as Gradient Boosting).
Iterate: The process of machine learning frequently involves iteration. If the first algorithm doesn’t work out, try a different one and adjust your strategy in light of the results.
Domain Expertise:
Domain knowledge can provide valuable insights. You may need to choose algorithms that are well-suited to the specifics of your domain.
Evaluate Model Complexity:
Keep in mind the trade-off between model complexity and interpretability. Simpler models are often easier to interpret and can be preferred in certain situations.
Consider Data Size:
The size of your dataset can impact your choice of algorithms. Deep learning models may require large datasets to perform effectively.
Resource and Time Constraints:
Consider your available computational resources and time constraints. For large datasets, some algorithms may not be practical due to their high computational costs.
In conclusion, choosing the best machine learning algorithm entails understanding your problem, your data, and experimenting with different models while taking domain expertise and practical constraints into account. The process of trial and error is frequently used to identify the best algorithm for a given task.
Q5. What exactly is a Random Forest? What is the mechanism?
The decision-making experts on a Random Forest team collaborate to find solutions to issues. Imagine a large group of friends who are all incredibly good at solving puzzles. Each friend receives a piece of a puzzle, and they each work on it independently.
Instead of just one puzzle, several are now being solved simultaneously. Every friend’s contribution to the solution is different. You combine your friends’ responses once they have all finished to come up with the best answer.
This is accomplished with a Random Forest. Decision trees are a collection of “experts” in decision-making who analyze various aspects of a problem and produce their own solutions. After that, a vote is taken on the choice. In some cases, they might even be able to tell you which aspects of the problem are most important.
The magic of a Random Forest is that even if one “expert” gets it wrong, the others can still correct it, making mistakes less likely to occur. It’s similar to having a group of friends who enjoy solving puzzles and collaborate to come up with the best answer.
What a Random Forest does is as follows:
Decision Trees: Decision trees make up a majority of a Random Forest. Every decision tree resembles a straightforward set of rules. Based on the data it has, it can decide things like “Is the sky cloudy?” and “Is the temperature above 70 degrees?”
Bootstrapping (Random Sampling):
To create these decision trees, the Random Forest doesn’t use the entire set of data. It randomly selects some of the data (with replacement), which means some data points might be used more than once, and others might not be used at all. This makes each decision tree a bit different.
Random Feature Selection:
It also doesn’t use all the available information (features) to make decisions. For each tree, it randomly picks a subset of the features. So, one tree might consider only temperature and humidity, while another looks at wind speed and time of day. This randomness adds diversity to the decision-making.
Growing Decision Trees:
Each decision tree is grown independently using its own subset of data and features. These trees make decisions by splitting their way through the data. They keep asking questions based on their selected features, like “Is the humidity high?” or “Is the wind strong?”
Voting (Classification) or Averaging (Regression):
When it’s time to make a prediction for a new data point, the Random Forest asks each decision tree for its opinion. If it’s a classification problem (like identifying animals as cats or dogs), each tree “votes” for a class. The class with the most votes becomes the final prediction. In a regression problem (like predicting the price of a house), the predictions from each tree are averaged to get the final answer.
Reducing Overfitting:
Because the Random Forest uses many different decision trees, it’s good at reducing overfitting. Overfitting is when a model becomes too focused on the training data and doesn’t generalize well to new data. By combining the opinions of many trees, the Random Forest makes more balanced and accurate predictions.
Feature Importance:
The Random Forest can also tell you which features—in our example, like temperature or humidity—are most crucial for making predictions. This aids in your comprehension of the crucial aspects of your issue.
Q6. What is Collaborative Filtering? And Content-Based Filtering?
Collaborative Filtering:
In recommendation systems, collaborative filtering is a method for giving users tailored suggestions. It is predicated on the notion that users who have agreed on one issue also frequently agree on related issues.
There are primarily two kinds:
User-Based Collaborative Filtering: It recommends items to a user that similar users have liked. It finds users with similar preferences and suggests items they have liked but the user hasn’t seen yet.
Item-Based Collaborative Filtering: It recommends items similar to the ones a user has liked in the past. It finds items that are similar to the ones the user has shown interest in.
Content-Based Filtering:
Content-based filtering recommends items to users based on the characteristics of items and a profile of the user’s preferences. It suggests items that are similar in content to those a user has previously shown interest in.
For example, in a movie recommendation system, it might suggest movies with similar genres, actors, or directors to the ones the user has liked.
Q7. How can you select K for K-means Clustering?
Selecting the right value of K (the number of clusters) in K-means clustering is an essential but sometimes challenging task. There are several methods to help you choose the optimal K:
Elbow Method: The Elbow Method is one of the most common techniques to select K. It involves plotting the sum of squared distances (inertia) from data points to their assigned cluster’s centroid for a range of K values. The idea is to look for the “elbow” point on the plot, where the rate of decrease in inertia sharply changes. The K at the elbow point is often a good choice.
Silhouette Score: The Silhouette Score measures how similar each data point in one cluster is to other data points in the same cluster compared to other clusters. A higher Silhouette Score indicates that the data points are well-clustered. You can calculate the Silhouette Score for different K values and choose the one with the highest score.
Gap Statistics: Gap Statistics compare the performance of your clustering (inertia) to that of a random clustering. You compute the gap statistic for various K values and select the K that results in the largest gap between the actual data and random data.
Davies-Bouldin Index: The Davies-Bouldin Index measures the average similarity between each cluster and its most similar cluster. A lower Davies-Bouldin Index suggests better clustering. This index can be calculated for various K values, and the one with the lowest index should be chosen.
Cross-Validation: To evaluate the quality of clustering for various K values, you can also use cross-validation techniques, such as k-fold cross-validation. By splitting your data into training and validation sets multiple times, you can choose K that results in the most stable and accurate clusters.
Visual Inspection: Visualizing the clusters can also help. You can create scatter plots or other visualizations to see how data points are grouped for different K values. This approach can provide insights into whether the clusters make sense.
Q8. What are Recommender Systems?
Recommender systems, also referred to as recommendation systems, are a category of software program made to offer users individualized suggestions or recommendations. They are widely used to assist users in finding interesting objects, such as products, movies, or articles, in a variety of industries, including e-commerce, streaming services, and content platforms. Collaborative filtering, content-based filtering, or hybrid strategies that combine both can be the foundation of recommender systems.
Q9. How do you check the Normality of a dataset?
There are numerous ways to examine a dataset’s normality, including:
Visual Evaluation:
Visually evaluate the data distribution to see if it resembles a normal (bell-shaped) curve by creating a histogram or a Q-Q plot.
Tests of Statistics: If the data significantly deviates from a normal distribution, use tests like the Shapiro-Wilk, Anderson-Darling, or Kolmogorov-Smirnov tests to ascertain this.
Detailed Statistics: Calculate summary statistics like the mean, median, and standard deviation, then contrast them with what you might anticipate from a normal distribution. Data that are kurtotic or extremely skewed may not be normal.
Q10. Can logistic regression be applied to more than two classes?
Yes, more than two classes can be considered when using logistic regression. When you need to predict values for multiple classes, use “Multinomial Logistic Regression” or “Softmax Regression” (a specific instance of multinomial logistic regression). In multinomial logistic regression, the predicted class is the one with the highest probability after the model estimates probabilities for each class. It is frequently used for multi-class classification problems, such as the classification of images into multiple categories.
Top 10 Trending Technologies to Learn in 2025 | Edureka
This video talks about the Top 10 Trending Technologies in 2025 that you must learn.
Machine Learning Scenario Based Questions
This set of Machine Learning interview questions deal with scenario-based Machine Learning questions.
Q1. You are given a data set consisting of variables having more than 30% missing values? Let’s say, out of 50 variables, 8 variables have missing values higher than 30%. How will you deal with them?
Assign a unique category to the missing values, who knows the missing values might uncover some trend.
We can remove them blatantly.
Or, we can sensibly check their distribution with the target variable, and if found any pattern we’ll keep those missing values and assign them a new category while removing others.
Q2. Write an SQL query that makes recommendations using the pages that your friends liked. Assume you have two tables: a two-column table of users and their friends, and a two-column table of users and the pages they liked. It should not recommend pages you already like.
SELECT f.user_id, l.page_id
FROM friend f JOIN like l
ON f.friend_id = l.user_id
WHERE l.page_id NOT IN (SELECT page_id FROM like
WHERE user_id = f.user_id)
Q3. There’s a game where you are asked to roll two fair six-sided dice. If the sum of the values on the dice equals seven, then you win $21. However, you must pay $5 to play each time you roll both dice. Do you play this game? And in the follow-up: If he plays 6 times what is the probability of making money from this game?
The first condition states that if the sum of the values on the 2 dices is equal to 7, then you win $21. But for all the other cases you must pay $5.
First, let’s calculate the number of possible cases. Since we have two 6-sided dices, the total number of cases => 6*6 = 36.
Out of 36 cases, we must calculate the number of cases that produces a sum of 7 (in such a way that the sum of the values on the 2 dices is equal to 7)
Possible combinations that produce a sum of 7 is, (1,6), (2,5), (3,4), (4,3), (5,2) and (6,1). All these 6 combinations generate a sum of 7.
This means that out of 36 chances, only 6 will produce a sum of 7. On taking the ratio, we get: 6/36 = 1/6
So this suggests that we have a chance of winning $21, once in 6 games.
So to answer the question if a person plays 6 times, he will win one game of $21, whereas for the other 5 games he will have to pay $5 each, which is $25 for all five games. Therefore, he will face a loss because he wins $21 but ends up paying $25.
Q4. We have two options for serving ads within Newsfeed: 1 – out of every 25 stories, one will be an ad 2 – every story has a 4% chance of being an ad
For each option, what is the expected number of ads shown in 100 news stories? If we go with option 2, what is the chance a user will be shown only a single ad in 100 stories? What about no ads at all?
The expected number of ads shown in 100 new stories for option 1 is equal to 4 (100/25 = 4).
Similarly, for option 2, the expected number of ads shown in 100 new stories is also equal to 4 (4/100 = 1/25 which suggests that one out of every 25 stories will be an ad, therefore in 100 new stories there will be 4 ads)
Therefore for each option, the total number of ads shown in 100 new stories is 4.
The second part of the question can be solved by using Binomial distribution. Binomial distribution takes three parameters:
The probability of success and failure, which in our case is 4%.
The total number of cases, which is 100 in our case.
The probability of the outcome, which is a chance that a user will be shown only a single ad in 100 stories
p(single ad) = (0.96)^99*(0.04)^1
(note: here 0.96 denotes the chance of not seeing an ad in 100 stories, 99 denotes the possibility of seeing only 1 ad, 0.04 is the probability of seeing an ad once in 100 stories )
In total, there are 100 positions for the ad. Therefore, 100 * p(single ad) = 7.03%
Q5. How would you predict who will renew their subscription next month? What data would you need to solve this? What analysis would you do? Would you build predictive models? If so, which algorithms?
Let’s assume that we’re trying to predict renewal rate for Netflix subscription. So our problem statement is to predict which users will renew their subscription plan for the next month.
Next, we must understand the data that is needed to solve this problem. In this case, we need to check the number of hours the channel is active for each household, the number of adults in the household, number of kids, which channels are streamed the most, how much time is spent on each channel, how much has the watch rate varied from last month, etc. Such data is needed to predict whether or not a person will continue the subscription for the upcoming month.
After collecting this data, it is important that you find patterns and correlations. For example, we know that if a household has kids, then they are more likely to subscribe. Similarly, by studying the watch rate of the previous month, you can predict whether a person is still interested in a subscription. Such trends must be studied.
The next step is analysis. For this kind of problem statement, you must use a classification algorithm that classifies customers into 2 groups:
Customers who are likely to subscribe next month
Customers who are not likely to subscribe next month
Would you build predictive models? Yes, in order to achieve this you must build a predictive model that classifies the customers into 2 classes like mentioned above.
Which algorithms to choose? You can choose classification algorithms such as Logistic Regression, Random Forest, Support Vector Machine, etc.
Once you’ve opted the right algorithm, you must perform model evaluation to calculate the efficiency of the algorithm. This is followed by deployment.
Q6. How do you map nicknames (Pete, Andy, Nick, Rob, etc) to real names?
This problem can be solved in n number of ways. Let’s assume that you’re given a data set containing 1000s of twitter interactions. You will begin by studying the relationship between two people by carefully analyzing the words used in the tweets.
This kind of problem statement can be solved by implementing Text Mining using Natural Language Processing techniques, wherein each word in a sentence is broken down and co-relations between various words are found.
NLP is actively used in understanding customer feedback, performing sentimental analysis on Twitter and Facebook. Thus, one of the ways to solve this problem is through Text Mining and Natural Language Processing techniques.
Q7. A jar has 1000 coins, of which 999 are fair and 1 is double headed. Pick a coin at random, and toss it 10 times. Given that you see 10 heads, what is the probability that the next toss of that coin is also a head?
There are two ways of choosing a coin. One is to pick a fair coin and the other is to pick the one with two heads.
Probability of selecting fair coin = 999/1000 = 0.999 Probability of selecting unfair coin = 1/1000 = 0.001
Selecting 10 heads in a row = Selecting fair coin * Getting 10 heads + Selecting an unfair coin
P (A) = 0.999 * (1/2)^10 = 0.999 * (1/1024) = 0.000976 P (B) = 0.001 * 1 = 0.001 P( A / A + B ) = 0.000976 / (0.000976 + 0.001) = 0.4939 P( B / A + B ) = 0.001 / 0.001976 = 0.5061
Probability of selecting another head = P(A/A+B) * 0.5 + P(B/A+B) * 1 = 0.4939 * 0.5 + 0.5061 = 0.7531
Q8. Suppose you are given a data set which has missing values spread along 1 standard deviation from the median. What percentage of data would remain unaffected and Why?
Since the data is spread across the median, let’s assume it’s a normal distribution. As you know, in a normal distribution, ~68% of the data lies in 1 standard deviation from mean (or mode, median), which leaves ~32% of the data unaffected. Therefore, ~32% of the data would remain unaffected by missing values.
Q9. You are given a cancer detection data set. Let’s suppose when you build a classification model you achieved an accuracy of 96%. Why shouldn’t you be happy with your model performance? What can you do about it?
You can do the following:
Add more data
Treat missing outlier values
Feature Engineering
Feature Selection
Multiple Algorithms
Algorithm Tuning
Ensemble Method
Cross-Validation
Q10. You are working on a time series data set. Your manager has asked you to build a high accuracy model. You start with the decision tree algorithm since you know it works fairly well on all kinds of data. Later, you tried a time series regression model and got higher accuracy than the decision tree model. Can this happen? Why?
Time series data is based on linearity while a decision tree algorithm is known to work best to detect non-linear interactions
Decision tree fails to provide robust predictions. Why?
The reason is that it couldn’t map the linear relationship as good as a regression model did.
We also know that a linear regression model can provide a robust prediction only if the data set satisfies its linearity assumptions.
Q11. Suppose you found that your model is suffering from low bias and high variance. Which algorithm you think could tackle this situation and Why?
Type 1: How to tackle high variance?
Low bias occurs when the model’s predicted values are near to actual values.
In this case, we can use the bagging algorithm (eg: Random Forest) to tackle high variance problem.
Bagging algorithm will divide the data set into its subsets with repeated randomized sampling.
Once divided, these samples can be used to generate a set of models using a single learning algorithm. Later, the model predictions are combined using voting (classification) or averaging (regression).
Type 2: How to tackle high variance?
Lower the model complexity by using regularization technique, where higher model coefficients get penalized.
You can also use top n features from variable importance chart. It might be possible that with all the variable in the data set, the algorithm is facing difficulty in finding the meaningful signal.
Q12. You are given a data set. The data set contains many variables, some of which are highly correlated and you know about it. Your manager has asked you to run PCA. Would you remove correlated variables first? Why?
Possibly, you might get tempted to say no, but that would be incorrect. Discarding correlated variables will have a substantial effect on PCA because, in the presence of correlated variables, the variance explained by a particular component gets inflated.
Q13. You are asked to build a multiple regression model but your model R² isn’t as good as you wanted. For improvement, you remove the intercept term now your model R² becomes 0.8 from 0.3. Is it possible? How?
Yes, it is possible.
The intercept term refers to model prediction without any independent variable or in other words, mean prediction R² = 1 – ∑(Y – Y´)²/∑(Y – Ymean)² where Y´ is the predicted value.
In the presence of the intercept term, R² value will evaluate your model with respect to the mean model.
In the absence of the intercept term (Ymean), the model can make no such evaluation,
With large denominator, Value of ∑(Y – Y´)²/∑(Y)² equation becomes smaller than actual, thereby resulting in a higher value of R².
Q14. You’re asked to build a random forest model with 10000 trees. During its training, you got training error as 0.00. But, on testing the validation error was 34.23. What is going on? Haven’t you trained your model perfectly?
The model is overfitting the data.
Training error of 0.00 means that the classifier has mimicked the training data patterns to an extent.
But when this classifier runs on the unseen sample, it was not able to find those patterns and returned the predictions with more number of errors.
In Random Forest, it usually happens when we use a larger number of trees than necessary. Hence, to avoid such situations, we should tune the number of trees using cross-validation.
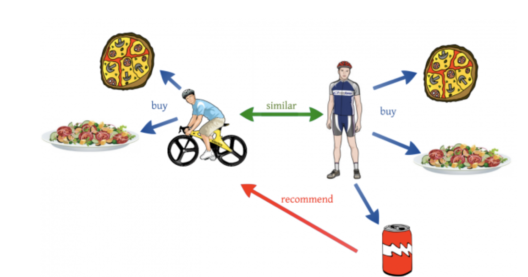
Q15. ‘People who bought this also bought…’ recommendations seen on Amazon is based on which algorithm?
E-commerce websites like Amazon make use of Machine Learning to recommend products to their customers. The basic idea of this kind of recommendation comes from collaborative filtering. Collaborative filtering is the process of comparing users with similar shopping behaviors in order to recommend products to a new user with similar shopping behavior.
To better understand this, let’s look at an example. Let’s say a user A who is a sports enthusiast bought, pizza, pasta, and a coke. Now a couple of weeks later, another user B who rides a bicycle buys pizza and pasta. He does not buy the coke, but Amazon recommends a bottle of coke to user B since his shopping behaviors and his lifestyle is quite similar to user A. This is how collaborative filtering works.
So these are the most frequently asked questions in a Machine Learning Interview. However, if you wish to brush up more on your knowledge, you can go through these blogs:
With this, we come to an end to this blog. I hope these Machine Learning Interview Questions will help you ace your Machine Learning Interview.
Learn the fundamentals of Machine Learning, machine learning steps and methods that include unsupervised and supervised learning, mathematical and heuristic aspects, and hands-on modeling to create algorithms. You will be prepared for the position of Machine Learning engineer. The Machine Learning Course Masters Program will provide you with the most in-depth and practical information on machine-learning applications in real-world situations. Additionally, you’ll learn the essentials needed to be successful in the field of machine learning, such as statistical analysis, Python, and data science.
Also, If you want to become a successful Deep Learning Engineer, you can take up the Deep Learning Course Training using Tensoflow from Edureka.


 Copy Link!
_1648290501.jpg)
 Deep Learning is a form of machine learning that is inspired by the structure of the human brain and is particularly effective in feature detection.


 Thank you for registering Join Edureka Meetup community for 100+ Free Webinars each month JOIN MEETUP GROUP