
Data Science with Python Certification Course
- 132k Enrolled Learners
- Weekend/Weekday
- Live Class
(49300)


 Copy Link!
In this Data Science Interview Questions blog, I will introduce you to the most frequently asked data science Interview questions and answers, Analytics and Machine Learning interviews. This blog is the perfect guide for learning all the concepts required to clear a Data Science interview. To get in-depth knowledge of Data Science, you can enroll for live Data Science with Python Course Training by Edureka with 24/7 support and lifetime access.
The following are the topics covered in our interview questions:
Before moving ahead, you may go through the recording of the Data Science Interview Question and answers where our instructor has shared his experience and expertise that will help you to crack any Data Science.
Basic Data Science Interview Questions for Freshers
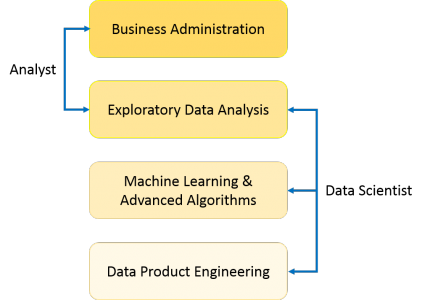
Data Science is a blend of various tools, algorithms, and machine learning principles with the goal to discover hidden patterns from the raw data. How is this different from what statisticians have been doing for years?
The answer lies in the difference between explaining and predicting.
The differences between supervised and unsupervised learning are as follows;
Supervised Learning | Unsupervised Learning |
Input data is labelled. | Input data is unlabelled. |
Uses a training data set. | Uses the input data set. |
Used for prediction. | Used for analysis. |
Enables classification and regression. | Enables Classification, Density Estimation, & Dimension Reduction |
Selection bias is a kind of error that occurs when the researcher decides who is going to be studied. It is usually associated with research where the selection of participants isn’t random. It is sometimes referred to as the selection effect. It is the distortion of statistical analysis, resulting from the method of collecting samples. If the selection bias is not taken into account, then some conclusions of the study may not be accurate.
The types of selection bias include:
Sampling bias: It is a systematic error due to a non-random sample of a population causing some members of the population to be less likely to be included than others resulting in a biased sample.
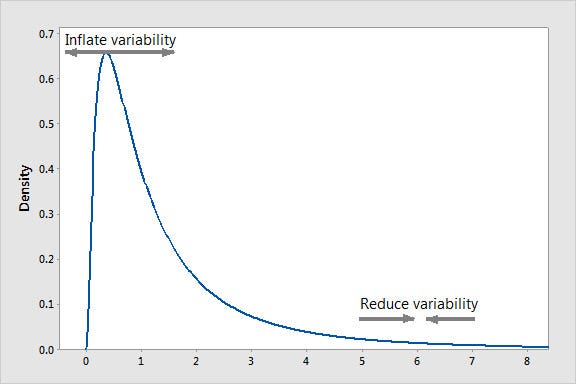
Time interval: A trial may be terminated early at an extreme value (often for ethical reasons), but the extreme value is likely to be reached by the variable with the largest variance, even if all variables have a similar mean.
Data: When specific subsets of data are chosen to support a conclusion or rejection of bad data on arbitrary grounds, instead of according to previously stated or generally agreed criteria.
Attrition: Attrition bias is a kind of selection bias caused by attrition (loss of participants) discounting trial subjects/tests that did not run to completion.
Bias: Bias is an error introduced in your model due to the oversimplification of the machine learning algorithm. It can lead to underfitting. When you train your model at that time model makes simplified assumptions to make the target function easier to understand.
Low bias machine learning algorithms — Decision Trees, k-NN and SVM High bias machine learning algorithms — Linear Regression, Logistic Regression
Variance: Variance is error introduced in your model due to a complex machine learning algorithm, your model learns noise also from the training data set and performs badly on test data set. It can lead to high sensitivity and overfitting.
Normally, as you increase the complexity of your model, you will see a reduction in error due to lower bias in the model. However, this only happens until a particular point. As you continue to make your model more complex, you end up over-fitting your model and hence your model will start suffering from high variance.
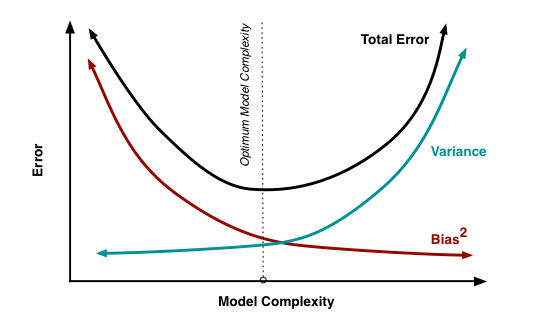
Bias-Variance trade-off: The goal of any supervised machine learning algorithm is to have low bias and low variance to achieve good prediction performance.
The k-nearest neighbour algorithm has low bias and high variance, but the trade-off can be changed by increasing the value of k which increases the number of neighbours that contribute to the prediction and in turn increases the bias of the model.
The support vector machine algorithm has low bias and high variance, but the trade-off can be changed by increasing the C parameter that influences the number of violations of the margin allowed in the training data which increases the bias but decreases the variance.
There is no escaping the relationship between bias and variance in machine learning. Increasing the bias will decrease the variance. Increasing the variance will decrease bias.
Q4. In your choice of language, write a program that prints the numbers ranging from one to 50
The python code to print numbers ranging from 1 to 50 is as follows-
For i in range(1,51):

print(i)
The output of the above code will be-
1
2
3
4
5
6
7
8
9
10
11
12
13
14
15
16
17
18
19
20
21
22
23
24
25
26
27
28
29
30
31
32
33
34
35
36
37
38
39
40
41
42
43
44
45
46
47
48
49
50
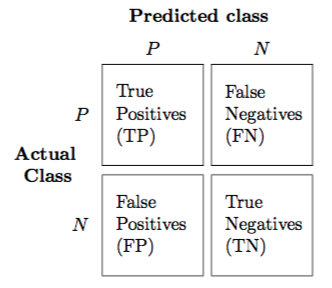
The confusion matrix is a 2X2 table that contains 4 outputs provided by the binary classifier. Various measures, such as error-rate, accuracy, specificity, sensitivity, precision and recall are derived from it. Confusion Matrix
A data set used for performance evaluation is called a test data set. It should contain the correct labels and predicted labels.
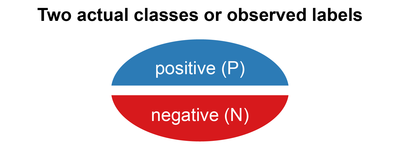
The predicted labels will exactly the same if the performance of a binary classifier is perfect.
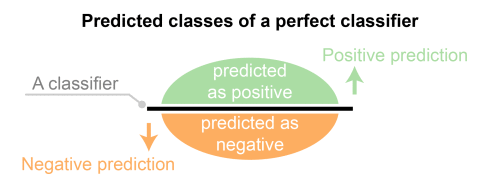
The predicted labels usually match with part of the observed labels in real-world scenarios.
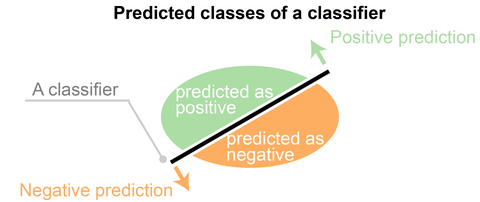
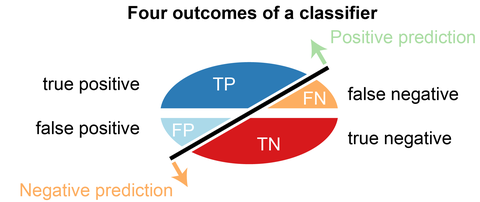
A binary classifier predicts all data instances of a test data set as either positive or negative. This produces four outcomes-
True-positive(TP) — Correct positive prediction
False-positive(FP) — Incorrect positive prediction
True-negative(TN) — Correct negative prediction
False-negative(FN) — Incorrect negative prediction
Basic measures derived from the confusion matrix-
Error Rate = (FP+FN)/(P+N)
Accuracy = (TP+TN)/(P+N)
Sensitivity(Recall or True positive rate) = TP/P
Specificity(True negative rate) = TN/N
Precision(Positive predicted value) = TP/(TP+FP)
F-Score(Harmonic mean of precision and recall) = (1+b)(PREC.REC)/(b²PREC+REC) where b is commonly 0.5, 1, 2.
This Data Science Interview Questions and Answers video will help you to prepare yourself for Data Science and Big Data Analytics interviews.
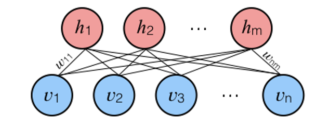
Q6. Describe Markov chains?
Markov chain is a type of stochastic process. In Markov chains, the future probability of any state depends only on the current state.
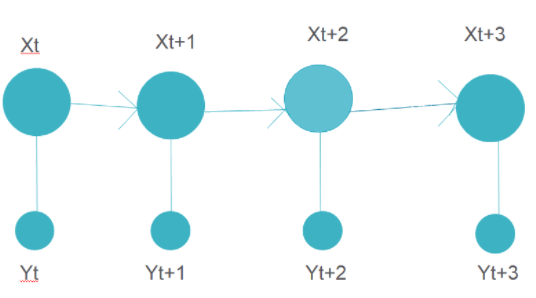
The above figure represents a Markov chain model where each step has an output that depends on the current state only.
An example can be word recommendation. When we type a paragraph, the next word is suggested by the model which depends only on the previous word and not on anything before it. The Markov chain model is trained previously on a similar paragraph where the next word to a given word is stored for all the words in the training data. Based on this training data output, the next words are suggested.
Q7. What do you understand by true positive rate and false-positive rate?
True Positive rate(TPR) is the ratio of True Positives to True Positives and False Negatives. It is the probability that an actual positive will test as positive.
TPR=TP/TP+FN
The False Positive Rate(FPR) is the ratio of the False Positives to all the positives(True positives and false positives). It is the probability of a false alarm, i.e., a positive result will be given when it is actually negative.
FPR=FP/TP+FP
Q8. Why R is used in Data Visualization?
R is used in data visualization as it has many inbuilt functions and libraries that help in data visualizations. These libraries include ggplot2, leaflet, lattice, etc.
R helps in exploratory data analysis as well as feature engineering. Using R, almost any type of graph can be created. Customizing graphics is easier in R than using python.
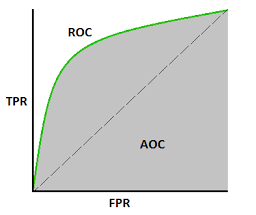
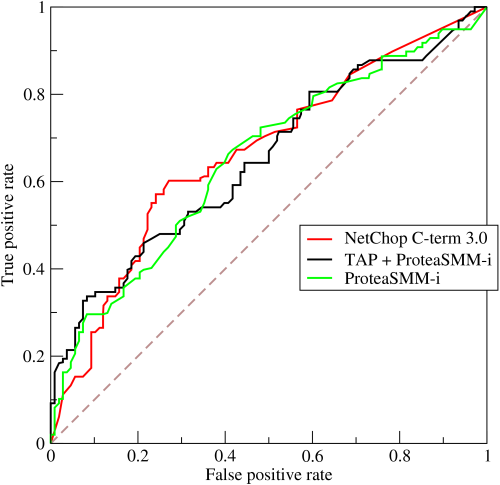
Q9. What is the ROC curve?
The ROC curve is a graph between False positive rate on the x axis and True positive rate on the y axis. True positive rate is the ratio of True positives to the total number of positive samples. False positive rate is the ratio of False positives to the total number of negative samples. The FPR and TPR are plotted on several threshold values to construct the ROC curve. The area under the ROC curve ranges from 0 to 1. A completely random model has an ROC of 0.5, which is represented by a straight line. The more the ROC curve deviates from this straight line, the better the model is. ROC curves are used for binary classification. The below image shows an example of an ROC curve.
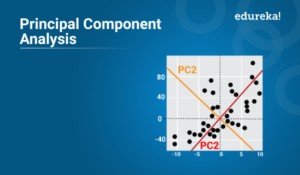
Q10. What are dimensionality reduction and its benefits?
Reducing the number of features for a given dataset is known as dimensionality reduction. There are many techniques used to reduce dimensionality such as-
One of the main reasons for dimensionality reduction is the curse of dimensionality. When the number of features increases, the model becomes more complex. But if the number of datapoints is less, the model will start learning or overfitting the data. The model will not generalize the data. This is known as the curse of dimensionality.
Other benefits of dimensionality reduction include-
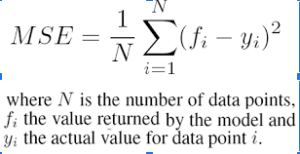
Q11. How do you find RMSE and MSE in a linear regression model?
Root Mean Squared Error(RMSE) is used to test the performance of the linear regression model. It evaluates how much the data is spread around the line of best fit. Its formula is-

Where,
y_hat is the predicted value
y_i is the actual value of the output variable.
N is the number of data points
Mean Squared Error(MSE) tells how close the line is to the actual data. The difference of the line from the data points is taken and squared. The MSE value should be low for a good model. This means that the error between actual and predicted output values should be low. It is calculated as-
Q12. How to deal with unbalanced binary classification?
While doing binary classification, if the data set is imbalanced, the accuracy of the model can’t be predicted correctly using only the R2 score. For example, if the data belonging to one of the two classes is very less in quantity as compared to the other class, the traditional accuracy will take a very small percentage of the smaller class. If only 5% of the examples are belonging to the smaller class, and the model classifies all outputs belonging to the other class, the accuracy would still be around 95%. But this will be wrong. To deal with this, we can do the following-
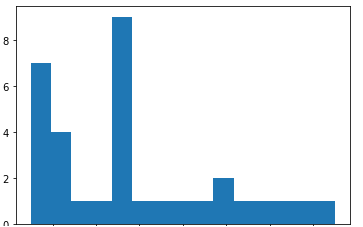
Q13. What is the difference between a box plot and a histogram
Both histograms and box plots are used to visually represent the frequency of values of a certain feature. The figure below shows a histogram.
While the figure below shows a boxplot for the same data.
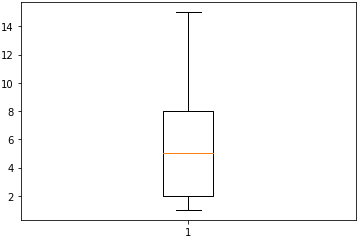
Histogram is used to know the underlying probability distribution of data. While boxplots are used more to compare several datasets. Boxplots have fewer details and take up less space than histograms.
Q14. What does NLP stand for?
NLP stands for Natural language processing. It is the study of programming computers to learn large amounts of textual data. Examples of NLP include tokenization, stop words removal, stemming, sentiment analysis, etc.
Q15. Walkthrough the probability fundamentals
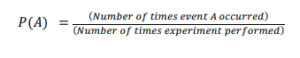
The possibility of the occurrence of an event, among all the possible outcomes, is known as its probability. The probability of an event always lies between(including) 0 and 1.
Factorial -it is used to find the total number of ways n number of things can be arranged in n places without repetition. Its value is n multiplied by all natural numbers till n-1.eg. 5!=5X4X3X2X1=120
Permutation– It is used when replacement is not allowed, and the order of items is important. Its formula is-
![]()
Where,
n is the total number of items
R is the number of ways items are being selected
Combination– It is used when replacement is not allowed, and the order of items is not important. Its formula is-
![]()
Some rules for probability are-
Addition Rule
P(A or B)= P(A) + P(B) – P(A and B)
Conditional probability
It is the probability of event B occurring, assuming that event A has already occurred.
P(A and B)= P(A) . P(B|A)
Central Limit theorem
It states that when we draw random samples from a large population, and take the mean of these samples, they form a normal distribution.
Q16. Describe different regularization methods, such as L1 and L2 regularization
There are 3 important regularization methods as follows-
L2 regularization-(Ridge regression)– In L2 regularization, we add the sum of the squares of all the weights, multiplied by a value lambda, to the loss function. The formula for Ridge regression is as follows-
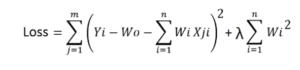
As you can see, if the value of the weights multiplied by the data value for a particular data point and feature becomes very large, the original loss will become small. But the added value of lambda multiplied with the sum of squares of weights will become large as well. Similarly, if the original loss value becomes very large, the added value will become small. Thus it will control the final value from becoming too large or too small.
L1 Regularization-(Lasso regression)– In L1 regularization, we add the sum of the absolute values of all the weights, multiplied by a value lambda, to the loss function. The formula for Lasso regression is as follows-
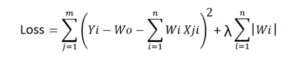
The loss function along with the optimization algorithm brings parameters near to zero but not actually zero, while lasso eliminates less important features and sets respective weight values to zero.
This is used for regularization in neural networks. Fully connected layers are more prone to overfitting. Dropout leaves out some neurons with 1-p probability in neural networks. Dropout reduces overfitting, improves training speed, and makes the model more robust.
Q17. How should you maintain a deployed model?
After a model has been deployed, it needs to be maintained. The data being fed may change over time. For example, in the case of a model predicting house prices, the prices of houses may rise over time or fluctuate due to some other factor. The accuracy of the model on new data can be recorded. Some common ways to ensure accuracy include-
If the model shows good prediction accuracy with new data, it means that the new data follows the pattern or the generalization learned by the model on old data. So, the model can be retrained on the new data. If the accuracy on new data is not that good, the model can be retrained on the new data with feature engineering on the data features along with the old data.
If the accuracy is not good, the model may need to be trained from scratch.
Q18. Write the equation and calculate the precision and recall rate.
Precision quantifies the number of correct positive predictions made. Precision is calculated as the number of true positives divided by the total number of true positives and false positives.
Precision = True Positives / (True Positives + False Positives)
Precision is defined as the number of correct positive predictions made out of all positive predictions that could have been made. Recall is calculated as the number of true positives divided by the total number of true positives and false negatives.
Recall = True Positives / (True Positives + False Negatives)
Q19. Why do we use the summary function?
Summary functions are used to give the summary of all the numeric values in a dataframe. Eg. The describe() function can be used to provide the summary of all the data values given to it.
column_name.describe() will give the following values of all the numeric data in the column-
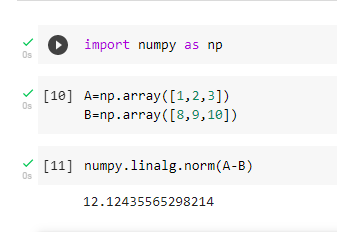
Q20. How will you measure the Euclidean distance between the two arrays in NumPy?
The Euclidean distance between 2 arrays A[1,2,3,] andB[8,9,10] can be calculated by taking the Euclidean distance of each point respectively. The built-in function numpy.linalg.norm()can be used as follows-
Q21. What is the difference between an error and a residual error?
An error refers to the difference between the predicted value and the actual value. The most popular means for calculating errors in data science are Mean Absolute Error(MAE), Mean Squared Error(MSE), and Root Mean Squared Error(RMSE). While residual is the difference between a group of values observed and their arithmetical mean. An error is generally unobservable while a residual error can be visualized on a graph. Error represents how observed data differs from the actual population. While a residual represents the way observed data differs from the sample population data.
Q22. Difference between Normalisation and Standardization?
Normalization, also known as min-max scaling, is a technique where all the data values are converted such that they lie between 0 and 1.
The formula for Normalization is-
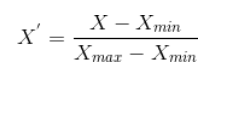
Where,
X_max is the maximum value of the feature
X_min is the minimum value of the feature
Standardization refers to converting our data such that the data has normal distribution with its mean as 0 and standard deviation as 1.
The formula for Standardization is-
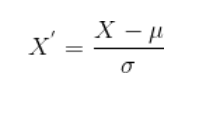
So, while normalization rescales the data into the range from 0 to 1 only, standardization ensures data follows the standard normal distribution.
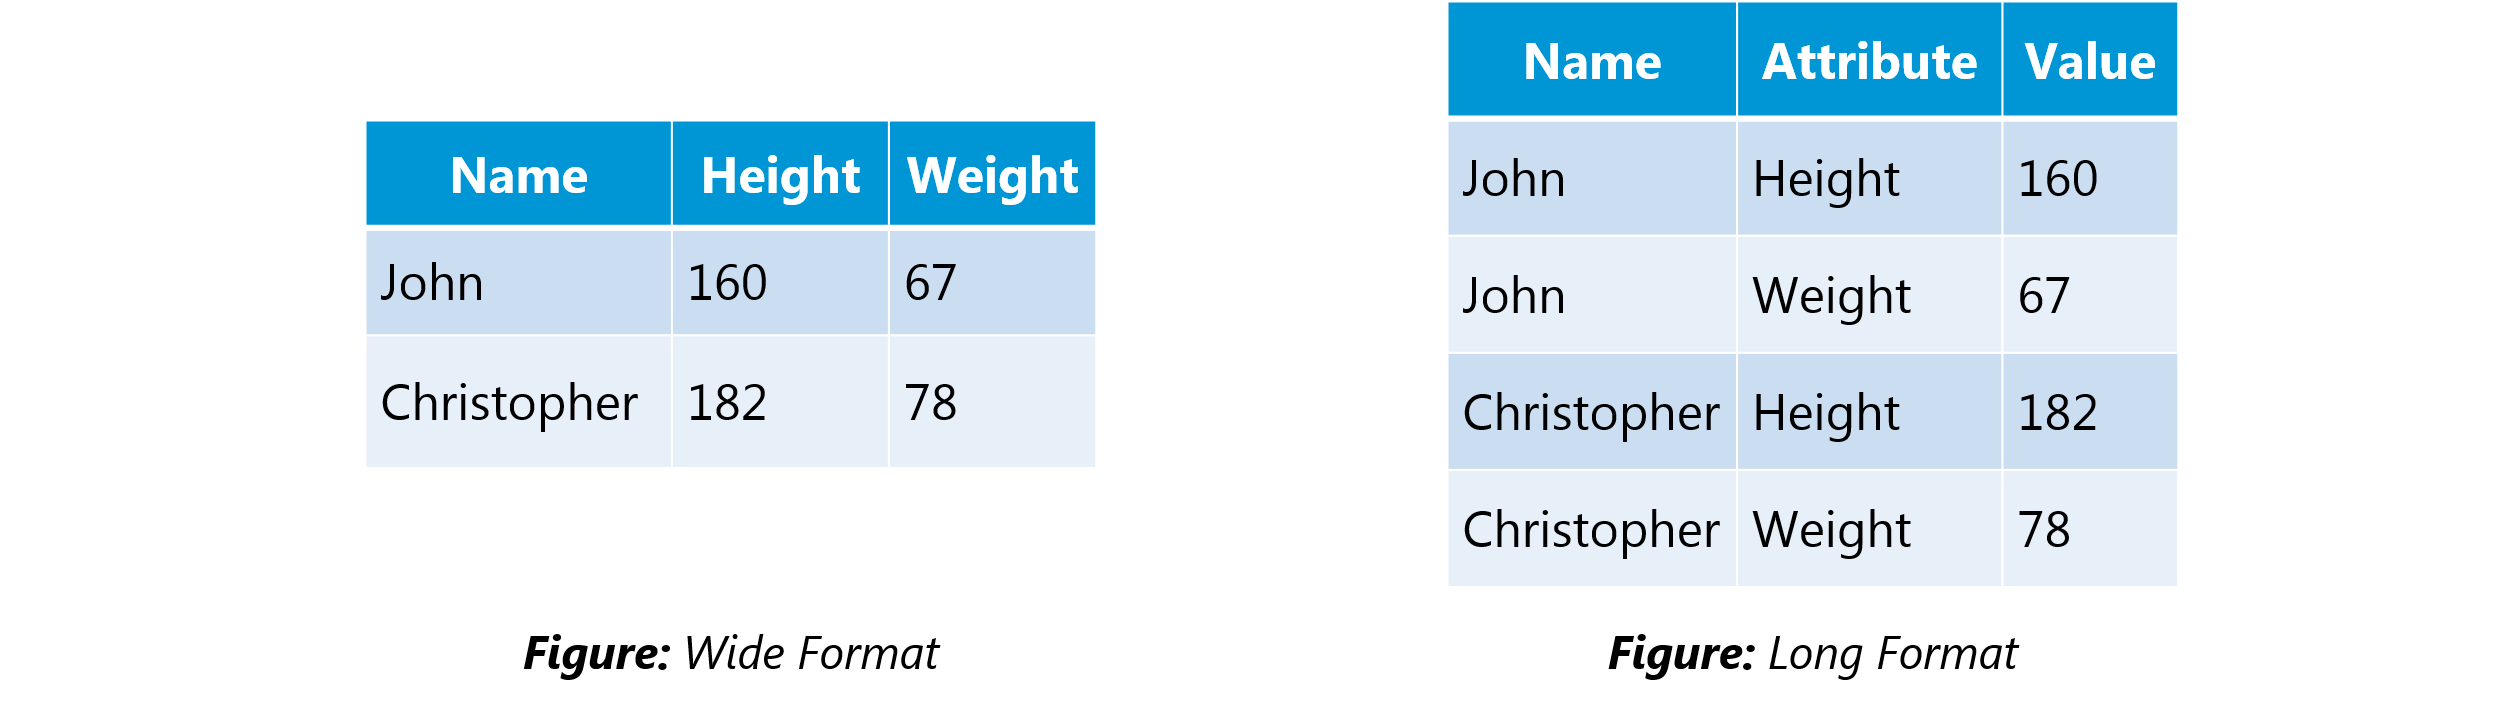
In the wide-format, a subject’s repeated responses will be in a single row, and each response is in a separate column. In the long-format, each row is a one-time point per subject. You can recognize data in wide format by the fact that columns generally represent groups.
Data is usually distributed in different ways with a bias to the left or to the right or it can all be jumbled up.
However, there are chances that data is distributed around a central value without any bias to the left or right and reaches normal distribution in the form of a bell-shaped curve.
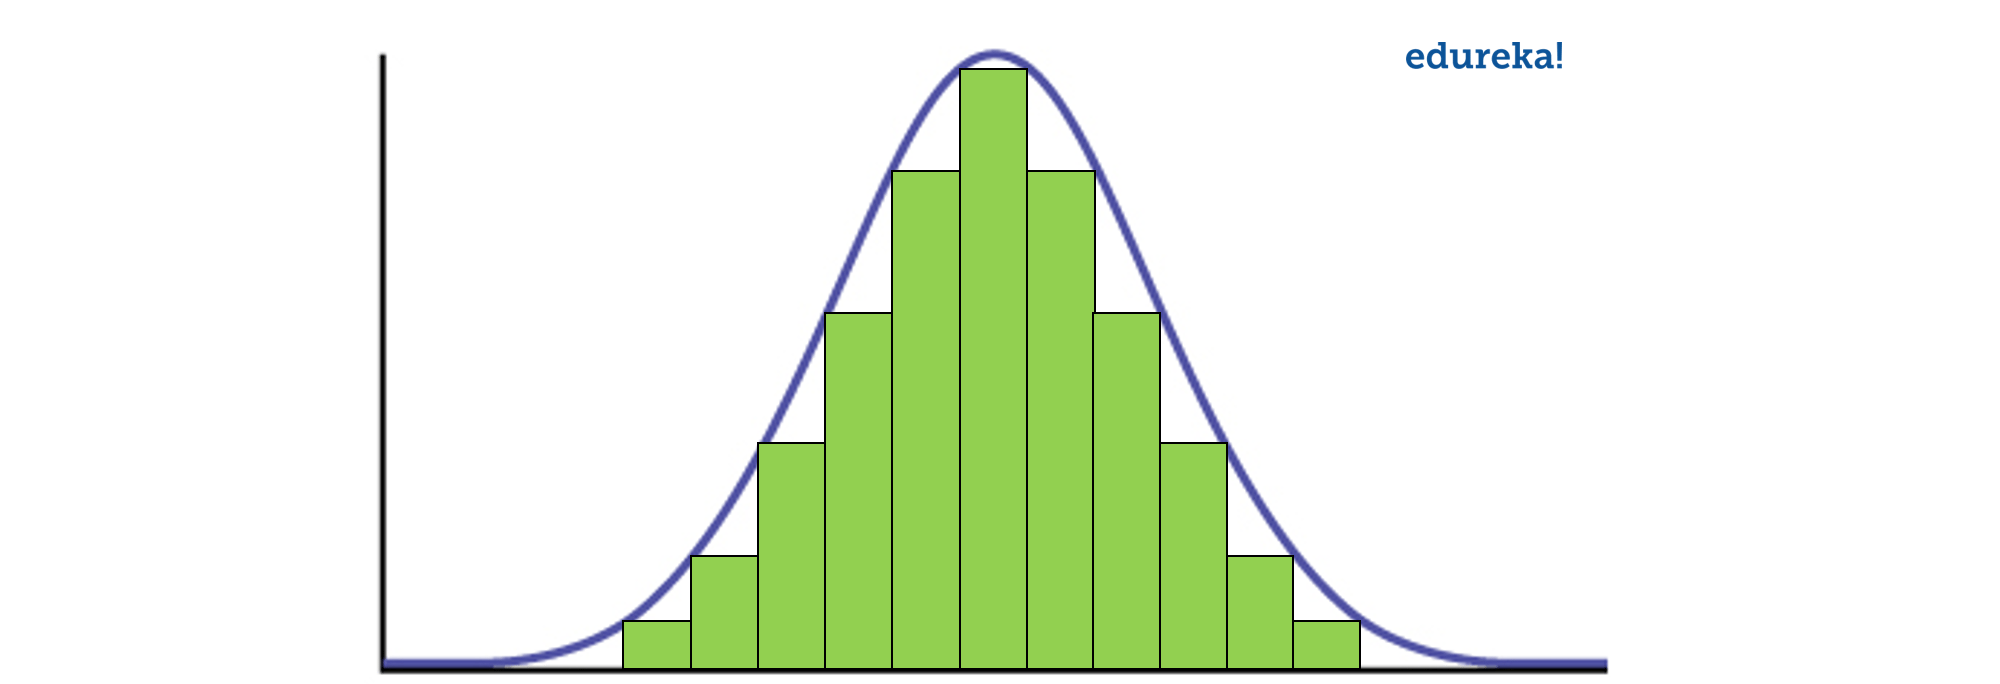
Figure: Normal distribution in a bell curve
The random variables are distributed in the form of a symmetrical, bell-shaped curve.
Properties of Normal Distribution are as follows;
Unimodal -one mode
Symmetrical -left and right halves are mirror images
Bell-shaped -maximum height (mode) at the mean
Mean, Mode, and Median are all located in the center
Asymptotic
Covariance and Correlation are two mathematical concepts; these two approaches are widely used in statistics. Both Correlation and Covariance establish the relationship and also measure the dependency between two random variables. Though the work is similar between these two in mathematical terms, they are different from each other.
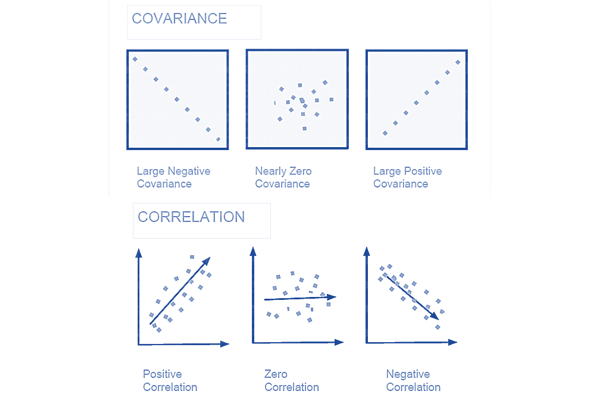 Correlation: Correlation is considered or described as the best technique for measuring and also for estimating the quantitative relationship between two variables. Correlation measures how strongly two variables are related.
Covariance: In covariance two items vary together and it’s a measure that indicates the extent to which two random variables change in cycle. It is a statistical term; it explains the systematic relation between a pair of random variables, wherein changes in one variable reciprocal by a corresponding change in another variable.
Point Estimation gives us a particular value as an estimate of a population parameter. Method of Moments and Maximum Likelihood estimator methods are used to derive Point Estimators for population parameters.
A confidence interval gives us a range of values which is likely to contain the population parameter. The confidence interval is generally preferred, as it tells us how likely this interval is to contain the population parameter. This likeliness or probability is called Confidence Level or Confidence coefficient and represented by 1 — alpha, where alpha is the level of significance.
Q27. What is the goal of A/B Testing?
It is a hypothesis testing for a randomized experiment with two variables A and B.
The goal of A/B Testing is to identify any changes to the web page to maximize or increase the outcome of interest. A/B testing is a fantastic method for figuring out the best online promotional and marketing strategies for your business. It can be used to test everything from website copy to sales emails to search ads
An example of this could be identifying the click-through rate for a banner ad.
Q28. What is p-value?
When you perform a hypothesis test in statistics, a p-value can help you determine the strength of your results. p-value is a number between 0 and 1. Based on the value it will denote the strength of the results. The claim which is on trial is called the Null Hypothesis.
Low p-value (≤ 0.05) indicates strength against the null hypothesis which means we can reject the null Hypothesis. High p-value (≥ 0.05) indicates strength for the null hypothesis which means we can accept the null Hypothesis p-value of 0.05 indicates the Hypothesis could go either way. To put it in another way,
High P values: your data are likely with a true null. Low P values: your data are unlikely with a true null.
Q29. In any 15-minute interval, there is a 20% probability that you will see at least one shooting star. What is the probability that you see at least one shooting star in the period of an hour?
Probability of not seeing any shooting star in 15 minutes is
= 1 – P( Seeing one shooting star )
= 1 – 0.2 = 0.8
Probability of not seeing any shooting star in the period of one hour
= (0.8) ^ 4 = 0.4096
Probability of seeing at least one shooting star in the one hour
= 1 – P( Not seeing any star )
= 1 – 0.4096 = 0.5904
Q30. How can you generate a random number between 1 – 7 with only a die?
Any die has six sides from 1-6. There is no way to get seven equal outcomes from a single rolling of a die. If we roll the die twice and consider the event of two rolls, we now have 36 different outcomes.
To get our 7 equal outcomes we have to reduce this 36 to a number divisible by 7. We can thus consider only 35 outcomes and exclude the other one.
A simple scenario can be to exclude the combination (6,6), i.e., to roll the die again if 6 appears twice.
All the remaining combinations from (1,1) till (6,5) can be divided into 7 parts of 5 each. This way all the seven sets of outcomes are equally likely.
Q31. A certain couple tells you that they have two children, at least one of which is a girl. What is the probability that they have two girls?
In the case of two children, there are 4 equally likely possibilities
BB, BG, GB and GG;
where B = Boy and G = Girl and the first letter denotes the first child.
From the question, we can exclude the first case of BB. Thus from the remaining 3 possibilities of BG, GB & BB, we have to find the probability of the case with two girls.
Thus, P(Having two girls given one girl) = 1 / 3
Q32. A jar has 1000 coins, of which 999 are fair and 1 is double headed. Pick a coin at random, and toss it 10 times. Given that you see 10 heads, what is the probability that the next toss of that coin is also a head?
There are two ways of choosing the coin. One is to pick a fair coin and the other is to pick the one with two heads.
Probability of selecting fair coin = 999/1000 = 0.999
Probability of selecting unfair coin = 1/1000 = 0.001
Selecting 10 heads in a row = Selecting fair coin * Getting 10 heads + Selecting an unfair coin
P (A) = 0.999 * (1/2)^5 = 0.999 * (1/1024) = 0.000976
P (B) = 0.001 * 1 = 0.001
P( A / A + B ) = 0.000976 / (0.000976 + 0.001) = 0.4939
P( B / A + B ) = 0.001 / 0.001976 = 0.5061
Probability of selecting another head = P(A/A+B) * 0.5 + P(B/A+B) * 1 = 0.4939 * 0.5 + 0.5061 = 0.7531
Q33. What do you understand by statistical power of sensitivity and how do you calculate it?
Sensitivity is commonly used to validate the accuracy of a classifier (Logistic, SVM, Random Forest etc.).
Sensitivity is nothing but “Predicted True events/ Total events”. True events here are the events which were true and model also predicted them as true.
Calculation of seasonality is pretty straightforward.
Seasonality = ( True Positives ) / ( Positives in Actual Dependent Variable )
Q34. Why Is Re-sampling Done?
Resampling is done in any of these cases:
Estimating the accuracy of sample statistics by using subsets of accessible data or drawing randomly with replacement from a set of data points
Substituting labels on data points when performing significance tests
Validating models by using random subsets (bootstrapping, cross-validation)
Q35. What are the differences between over-fitting and under-fitting?
In statistics and machine learning, one of the most common tasks is to fit a model to a set of training data, so as to be able to make reliable predictions on general untrained data.
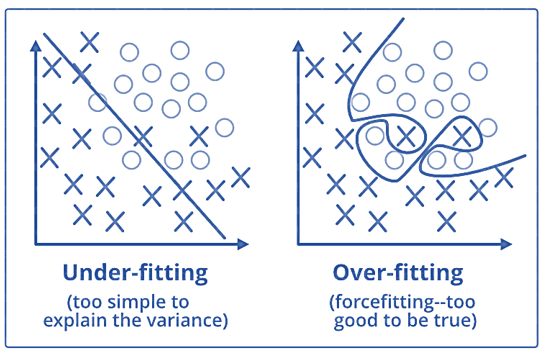
In overfitting, a statistical model describes random error or noise instead of the underlying relationship. Overfitting occurs when a model is excessively complex, such as having too many parameters relative to the number of observations. A model that has been overfitted, has poor predictive performance, as it overreacts to minor fluctuations in the training data.
Underfitting occurs when a statistical model or machine learning algorithm cannot capture the underlying trend of the data. Underfitting would occur, for example, when fitting a linear model to non-linear data. Such a model too would have poor predictive performance.
Q36. How to combat Overfitting and Underfitting?
To combat overfitting and underfitting, you can resample the data to estimate the model accuracy (k-fold cross-validation) and by having a validation dataset to evaluate the model.
Q37. What is regularisation? Why is it useful?
Regularisation is the process of adding tuning parameter to a model to induce smoothness in order to prevent overfitting. This is most often done by adding a constant multiple to an existing weight vector. This constant is often the L1(Lasso) or L2(ridge). The model predictions should then minimize the loss function calculated on the regularized training set.
Q38. What Is the Law of Large Numbers?
It is a theorem that describes the result of performing the same experiment a large number of times. This theorem forms the basis of frequency-style thinking. It says that the sample means, the sample variance and the sample standard deviation converge to what they are trying to estimate.
Q39. What Are Confounding Variables?
In statistics, a confounder is a variable that influences both the dependent variable and independent variable.
For example, if you are researching whether a lack of exercise leads to weight gain,
lack of exercise = independent variable
weight gain = dependent variable.
A confounding variable here would be any other variable that affects both of these variables, such as the age of the subject.
Q40. What Are the Types of Biases That Can Occur During Sampling?
Selection bias
Under coverage bias
Survivorship bias
Q41. What is Survivorship Bias?
It is the logical error of focusing aspects that support surviving some process and casually overlooking those that did not work because of their lack of prominence. This can lead to wrong conclusions in numerous different means.
Q42. What is selection Bias?
Selection bias occurs when the sample obtained is not representative of the population intended to be analysed.
Q43. Explain how a ROC curve works?
The ROC curve is a graphical representation of the contrast between true positive rates and false-positive rates at various thresholds. It is often used as a proxy for the trade-off between the sensitivity(true positive rate) and false-positive rate.
Q44. What is TF/IDF vectorization?
TF–IDF is short for term frequency-inverse document frequency, is a numerical statistic that is intended to reflect how important a word is to a document in a collection or corpus. It is often used as a weighting factor in information retrieval and text mining.
The TF–IDF value increases proportionally to the number of times a word appears in the document but is offset by the frequency of the word in the corpus, which helps to adjust for the fact that some words appear more frequently in general.
Q45. Why we generally use Softmax non-linearity function as last operation in-network?
It is because it takes in a vector of real numbers and returns a probability distribution. Its definition is as follows. Let x be a vector of real numbers (positive, negative, whatever, there are no constraints).
Then the i’th component of Softmax(x) is —
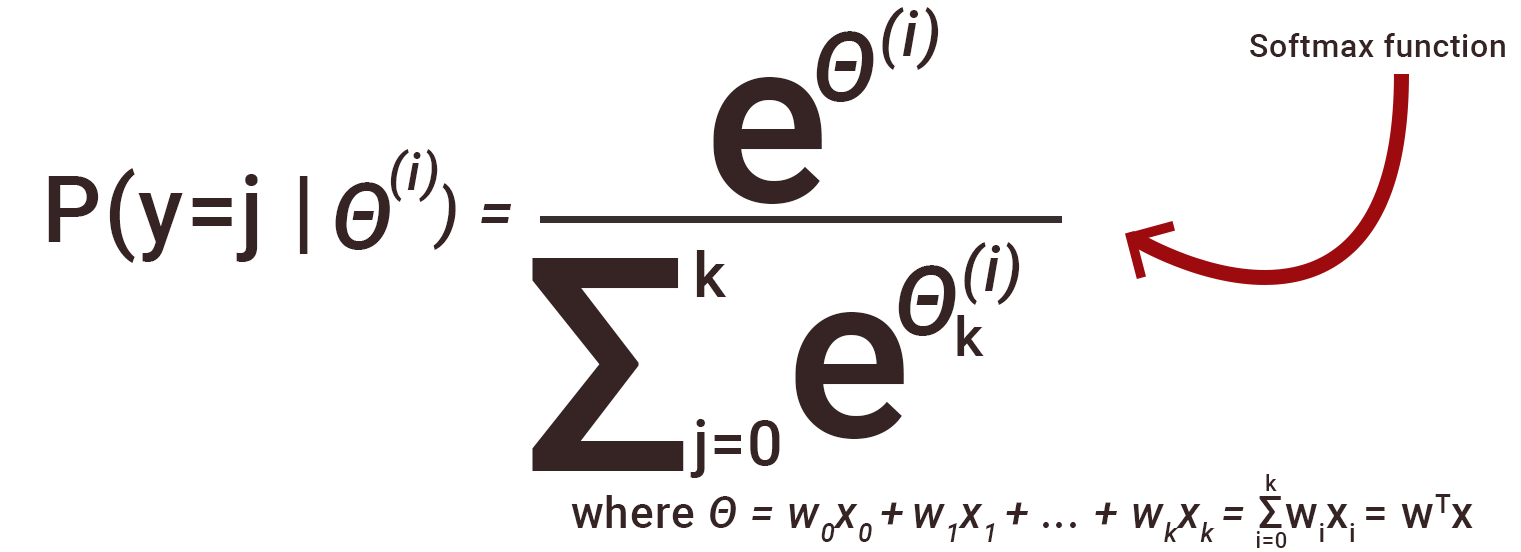
It should be clear that the output is a probability distribution: each element is non-negative and the sum over all components is 1.
Q46. Python or R – Which one would you prefer for text analytics?
We will prefer Python because of the following reasons:
Python would be the best option because it has Pandas library that provides easy to use data structures and high-performance data analysis tools.
R is more suitable for machine learning than just text analysis.
Python performs faster for all types of text analytics.
Q47. How does data cleaning plays a vital role in the analysis?
Data cleaning can help in analysis because:
Cleaning data from multiple sources helps to transform it into a format that data analysts or data scientists can work with.
Data Cleaning helps to increase the accuracy of the model in machine learning.
It is a cumbersome process because as the number of data sources increases, the time taken to clean the data increases exponentially due to the number of sources and the volume of data generated by these sources.
It might take up to 80% of the time for just cleaning data making it a critical part of the analysis task.
Q48. Differentiate between univariate, bivariate and multivariate analysis.
Univariate analyses are descriptive statistical analysis techniques which can be differentiated based on the number of variables involved at a given point of time. For example, the pie charts of sales based on territory involve only one variable and can the analysis can be referred to as univariate analysis.
The bivariate analysis attempts to understand the difference between two variables at a time as in a scatterplot. For example, analyzing the volume of sale and spending can be considered as an example of bivariate analysis.
Multivariate analysis deals with the study of more than two variables to understand the effect of variables on the responses.
Q49. Explain Star Schema.
It is a traditional database schema with a central table. Satellite tables map IDs to physical names or descriptions and can be connected to the central fact table using the ID fields; these tables are known as lookup tables and are principally useful in real-time applications, as they save a lot of memory. Sometimes star schemas involve several layers of summarization to recover information faster.
Q50. What is Cluster Sampling?
Cluster sampling is a technique used when it becomes difficult to study the target population spread across a wide area and simple random sampling cannot be applied. Cluster Sample is a probability sample where each sampling unit is a collection or cluster of elements.
For eg., A researcher wants to survey the academic performance of high school students in Japan. He can divide the entire population of Japan into different clusters (cities). Then the researcher selects a number of clusters depending on his research through simple or systematic random sampling.
Let’s continue our Data Science Interview Questions blog with some more statistics questions.
Q51. What is Systematic Sampling?
Systematic sampling is a statistical technique where elements are selected from an ordered sampling frame. In systematic sampling, the list is progressed in a circular manner so once you reach the end of the list, it is progressed from the top again. The best example of systematic sampling is equal probability method.
Q52. What are Eigenvectors and Eigenvalues?
Eigenvectors are used for understanding linear transformations. In data analysis, we usually calculate the eigenvectors for a correlation or covariance matrix. Eigenvectors are the directions along which a particular linear transformation acts by flipping, compressing or stretching.
Eigenvalue can be referred to as the strength of the transformation in the direction of eigenvector or the factor by which the compression occurs.
Q53. Can you cite some examples where a false positive is important than a false negative?
Let us first understand what false positives and false negatives are.
False Positives are the cases where you wrongly classified a non-event as an event a.k.a Type I error.
False Negatives are the cases where you wrongly classify events as non-events, a.k.a Type II error.
Example 1: In the medical field, assume you have to give chemotherapy to patients. Assume a patient comes to that hospital and he is tested positive for cancer, based on the lab prediction but he actually doesn’t have cancer. This is a case of false positive. Here it is of utmost danger to start chemotherapy on this patient when he actually does not have cancer. In the absence of cancerous cell, chemotherapy will do certain damage to his normal healthy cells and might lead to severe diseases, even cancer.
Example 2: Let’s say an e-commerce company decided to give $1000 Gift voucher to the customers whom they assume to purchase at least $10,000 worth of items. They send free voucher mail directly to 100 customers without any minimum purchase condition because they assume to make at least 20% profit on sold items above $10,000. Now the issue is if we send the $1000 gift vouchers to customers who have not actually purchased anything but are marked as having made $10,000 worth of purchase.
Q54. Can you cite some examples where a false negative important than a false positive?
Example 1: Assume there is an airport ‘A’ which has received high-security threats and based on certain characteristics they identify whether a particular passenger can be a threat or not. Due to a shortage of staff, they decide to scan passengers being predicted as risk positives by their predictive model. What will happen if a true threat customer is being flagged as non-threat by airport model?
Example 2: What if Jury or judge decides to make a criminal go free?
Example 3: What if you rejected to marry a very good person based on your predictive model and you happen to meet him/her after a few years and realize that you had a false negative?
Q55. Can you cite some examples where both false positive and false negatives are equally important?
In the Banking industry giving loans is the primary source of making money but at the same time if your repayment rate is not good you will not make any profit, rather you will risk huge losses.
Banks don’t want to lose good customers and at the same point in time, they don’t want to acquire bad customers. In this scenario, both the false positives and false negatives become very important to measure.
Q56. Can you explain the difference between a Validation Set and a Test Set?
A Validation set can be considered as a part of the training set as it is used for parameter selection and to avoid overfitting of the model being built.
On the other hand, a Test Set is used for testing or evaluating the performance of a trained machine learning model.
In simple terms, the differences can be summarized as; training set is to fit the parameters i.e. weights and test set is to assess the performance of the model i.e. evaluating the predictive power and generalization.
Q57. Explain cross-validation.
Cross-validation is a model validation technique for evaluating how the outcomes of statistical analysis will generalize to an independent dataset. Mainly used in backgrounds where the objective is forecast and one wants to estimate how accurately a model will accomplish in practice.
The goal of cross-validation is to term a data set to test the model in the training phase (i.e. validation data set) in order to limit problems like overfitting and get an insight on how the model will generalize to an independent data set.
Machine Learning explores the study and construction of algorithms that can learn from and make predictions on data. Closely related to computational statistics. Used to devise complex models and algorithms that lend themselves to a prediction which in commercial use is known as predictive analytics. Given below, is an image representing the various domains Machine Learning lends itself to.

Supervised learning is the machine learning task of inferring a function from labeled training data. The training data consist of a set of training examples.
Algorithms: Support Vector Machines, Regression, Naive Bayes, Decision Trees, K-nearest Neighbor Algorithm and Neural Networks
E.g. If you built a fruit classifier, the labels will be “this is an orange, this is an apple and this is a banana”, based on showing the classifier examples of apples, oranges and bananas.
Unsupervised learning is a type of machine learning algorithm used to draw inferences from datasets consisting of input data without labelled responses.
Algorithms: Clustering, Anomaly Detection, Neural Networks and Latent Variable Models
E.g. In the same example, a fruit clustering will categorize as “fruits with soft skin and lots of dimples”, “fruits with shiny hard skin” and “elongated yellow fruits”.
The diagram lists the most important classification algorithms.
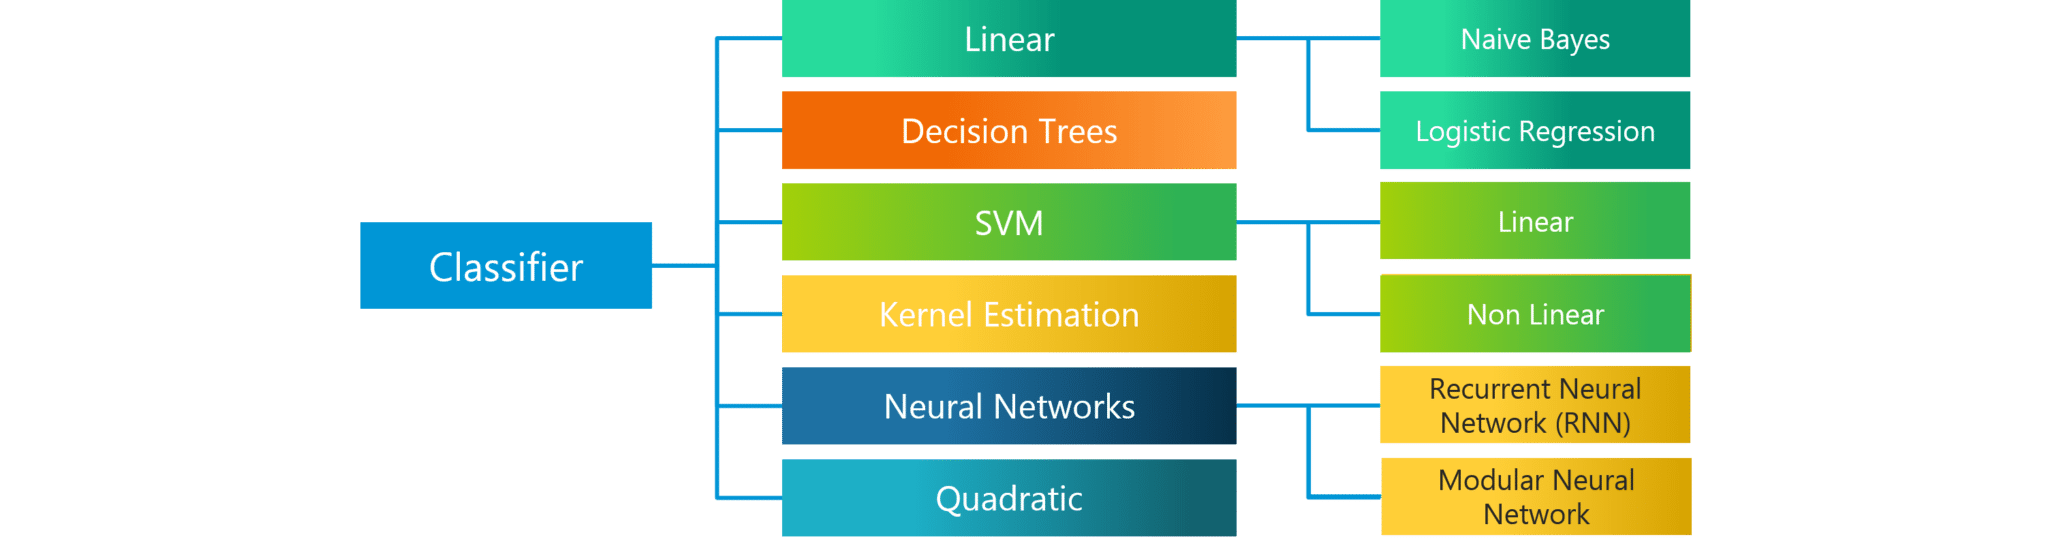
The Naive Bayes Algorithm is based on the Bayes Theorem. Bayes’ theorem describes the probability of an event, based on prior knowledge of conditions that might be related to the event.
The Algorithm is ‘naive’ because it makes assumptions that may or may not turn out to be correct.
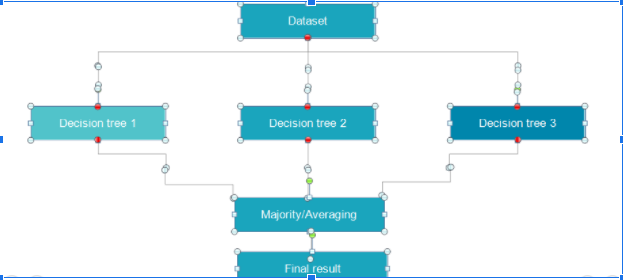
Q63. How do you build a random forest model?
A random forest model combines many decision tree models together. The decision trees chosen have high bias and low variance. These decision trees are placed parallelly. Each decision tree takes a sample subset of rows and columns with replacement. The result of each decision tree is noted and the majority, which is mode in case of classification problem, or mean and median in case of a regression problem is taken as the answer.
SVM stands for support vector machine, it is a supervised machine learning algorithm which can be used for both Regression and Classification. If you have n features in your training data set, SVM tries to plot it in n-dimensional space with the value of each feature being the value of a particular coordinate. SVM uses hyperplanes to separate out different classes based on the provided kernel function.
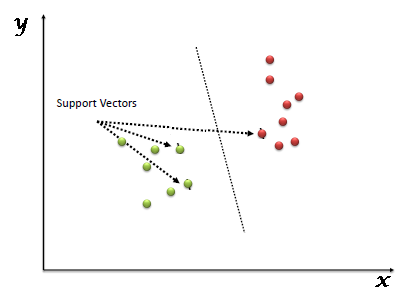
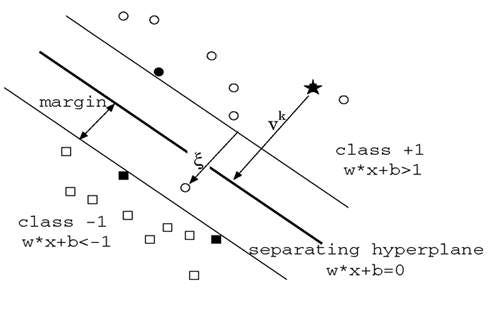
In the diagram, we see that the thinner lines mark the distance from the classifier to the closest data points called the support vectors (darkened data points). The distance between the two thin lines is called the margin.
There are four types of kernels in SVM.
Linear Kernel
Polynomial kernel
Radial basis kernel
Sigmoid kernel
A decision tree is a supervised machine learning algorithm mainly used for Regression and Classification. It breaks down a data set into smaller and smaller subsets while at the same time an associated decision tree is incrementally developed. The final result is a tree with decision nodes and leaf nodes. A decision tree can handle both categorical and numerical data.
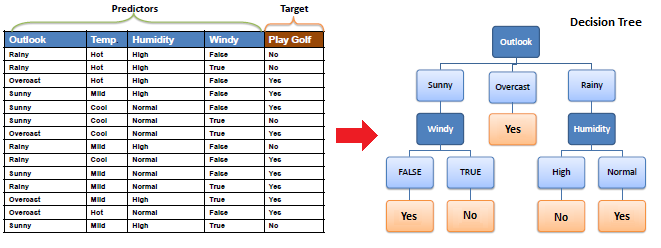
The core algorithm for building a decision tree is called ID3. ID3 uses Entropy and Information Gain to construct a decision tree.
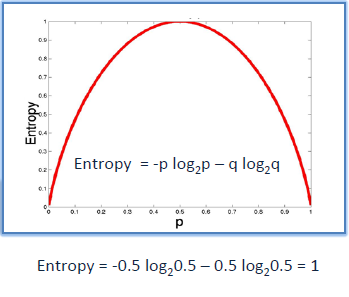
Entropy
A decision tree is built top-down from a root node and involve partitioning of data into homogenious subsets. ID3 uses enteropy to check the homogeneity of a sample. If the sample is completely homogenious then entropy is zero and if the sample is an equally divided it has entropy of one.
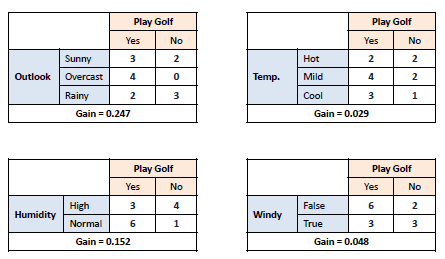
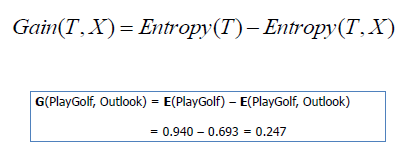
Information Gain
The Information Gain is based on the decrease in entropy after a dataset is split on an attribute. Constructing a decision tree is all about finding attributes that return the highest information gain.
Pruning is a technique in machine learning and search algorithms that reduces the size of decision trees by removing sections of the tree that provide little power to classify instances. So, when we remove sub-nodes of a decision node, this process is called pruning or opposite process of splitting.
Logistic Regression often referred to as the logit model is a technique to predict the binary outcome from a linear combination of predictor variables.
For example, if you want to predict whether a particular political leader will win the election or not. In this case, the outcome of prediction is binary i.e. 0 or 1 (Win/Lose). The predictor variables here would be the amount of money spent for election campaigning of a particular candidate, the amount of time spent in campaigning, etc.
Linear regression is a statistical technique where the score of a variable Y is predicted from the score of a second variable X. X is referred to as the predictor variable and Y as the criterion variable.
Some drawbacks of the linear model are:
The assumption of linearity of the errors.
It can’t be used for count outcomes or binary outcomes
There are overfitting problems that it can’t solve
Both Regression and classification machine learning techniques come under Supervised machine learning algorithms. In Supervised machine learning algorithm, we have to train the model using labelled data set, While training we have to explicitly provide the correct labels and algorithm tries to learn the pattern from input to output. If our labels are discrete values then it will a classification problem, e.g A,B etc. but if our labels are continuous values then it will be a regression problem, e.g 1.23, 1.333 etc.
Recommender Systems are a subclass of information filtering systems that are meant to predict the preferences or ratings that a user would give to a product. Recommender systems are widely used in movies, news, research articles, products, social tags, music, etc.
Examples include movie recommenders in IMDB, Netflix & BookMyShow, product recommenders in e-commerce sites like Amazon, eBay & Flipkart, YouTube video recommendations and game recommendations in Xbox.
The process of filtering used by most of the recommender systems to find patterns or information by collaborating viewpoints, various data sources and multiple agents.
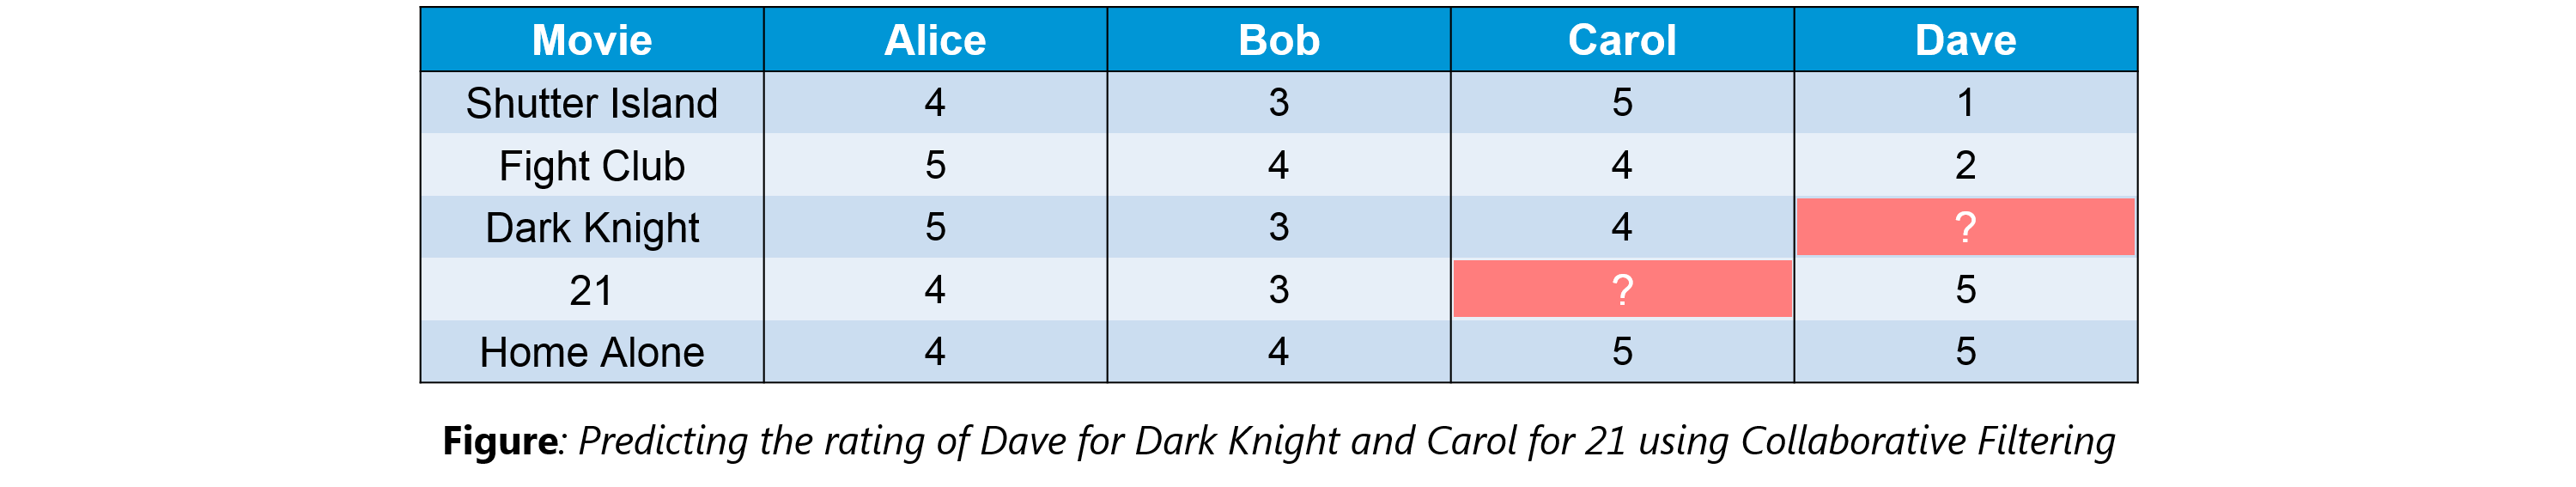
An example of collaborative filtering can be to predict the rating of a particular user based on his/her ratings for other movies and others’ ratings for all movies. This concept is widely used in recommending movies in IMDB, Netflix & BookMyShow, product recommenders in e-commerce sites like Amazon, eBay & Flipkart, YouTube video recommendations and game recommendations in Xbox.
Outlier values can be identified by using univariate or any other graphical analysis method. If the number of outlier values is few then they can be assessed individually but for a large number of outliers, the values can be substituted with either the 99th or the 1st percentile values.
All extreme values are not outlier values. The most common ways to treat outlier values
To change the value and bring it within a range.
To just remove the value.
The following are the various steps involved in an analytics project:
Understand the Business problem
Explore the data and become familiar with it.
Prepare the data for modelling by detecting outliers, treating missing values, transforming variables, etc.
After data preparation, start running the model, analyze the result and tweak the approach. This is an iterative step until the best possible outcome is achieved.
Validate the model using a new data set.
Start implementing the model and track the result to analyze the performance of the model over the period of time.
The extent of the missing values is identified after identifying the variables with missing values. If any patterns are identified the analyst has to concentrate on them as it could lead to interesting and meaningful business insights.
If there are no patterns identified, then the missing values can be substituted with mean or median values (imputation) or they can simply be ignored. Assigning a default value which can be mean, minimum or maximum value. Getting into the data is important.
If it is a categorical variable, the default value is assigned. The missing value is assigned a default value. If you have a distribution of data coming, for normal distribution give the mean value.
If 80% of the values for a variable are missing then you can answer that you would be dropping the variable instead of treating the missing values.
Though the Clustering Algorithm is not specified, this question is mostly in reference to K-Means clustering where “K” defines the number of clusters. The objective of clustering is to group similar entities in a way that the entities within a group are similar to each other but the groups are different from each other.
For example, the following image shows three different groups.
 Within Sum of squares is generally used to explain the homogeneity within a cluster. If you plot WSS for a range of number of clusters, you will get the plot shown below.

The Graph is generally known as Elbow Curve.
Red circled a point in above graph i.e. Number of Cluster =6 is the point after which you don’t see any decrement in WSS.
This point is known as the bending point and taken as K in K – Means.
This is the widely used approach but few data scientists also use Hierarchical clustering first to create dendrograms and identify the distinct groups from there.
Ensemble Learning is basically combining a diverse set of learners(Individual models) together to improvise on the stability and predictive power of the model.
Ensemble learning has many types but two more popular ensemble learning techniques are mentioned below.
Bagging
Bagging tries to implement similar learners on small sample populations and then takes a mean of all the predictions. In generalised bagging, you can use different learners on different population. As you expect this helps us to reduce the variance error.
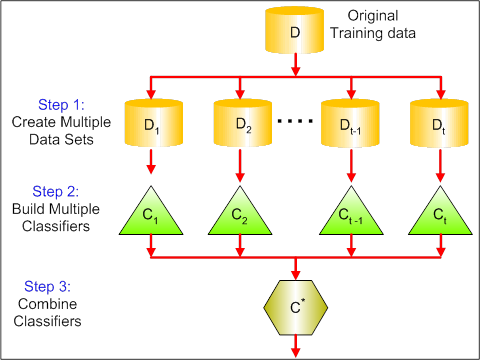
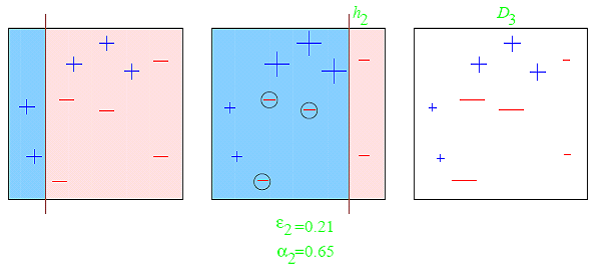
Boosting
Boosting is an iterative technique which adjusts the weight of an observation based on the last classification. If an observation was classified incorrectly, it tries to increase the weight of this observation and vice versa. Boosting in general decreases the bias error and builds strong predictive models. However, they may over fit on the training data.
Q82. What is a Random Forest? How does it work?
Random forest is a versatile machine learning method capable of performing both regression and classification tasks. It is also used for dimensionality reduction, treats missing values, outlier values. It is a type of ensemble learning method, where a group of weak models combine to form a powerful model.
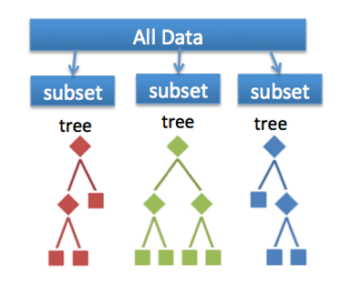 In Random Forest, we grow multiple trees as opposed to a single tree. To classify a new object based on attributes, each tree gives a classification. The forest chooses the classification having the most votes(Overall the trees in the forest) and in case of regression, it takes the average of outputs by different trees.
The underlying principle of this technique is that several weak learners combined to provide a keen learner. The steps involved are
Instead of using k-fold cross-validation, you should be aware of the fact that a time series is not randomly distributed data — It is inherently ordered by chronological order.
In case of time series data, you should use techniques like forward=chaining — Where you will be model on past data then look at forward-facing data.
fold 1: training[1], test[2]
fold 1: training[1 2], test[3]
fold 1: training[1 2 3], test[4]
fold 1: training[1 2 3 4], test[5]
The dependent variable for a regression analysis might not satisfy one or more assumptions of an ordinary least squares regression. The residuals could either curve as the prediction increases or follow the skewed distribution. In such scenarios, it is necessary to transform the response variable so that the data meets the required assumptions. A Box cox transformation is a statistical technique to transform non-normal dependent variables into a normal shape. If the given data is not normal then most of the statistical techniques assume normality. Applying a box cox transformation means that you can run a broader number of tests.
A Box-Cox transformation is a way to transform non-normal dependent variables into a normal shape. Normality is an important assumption for many statistical techniques, if your data isn’t normal, applying a Box-Cox means that you are able to run a broader number of tests. The Box-Cox transformation is named after statisticians George Box and Sir David Roxbee Cox who collaborated on a 1964 paper and developed the technique.
You will want to update an algorithm when:
You want the model to evolve as data streams through infrastructure
The underlying data source is changing
There is a case of non-stationarity
First of all, you have to ask which ML model you want to train.
For Neural networks: Batch size with Numpy array will work.
Steps:
Load the whole data in the Numpy array. Numpy array has a property to create a mapping of the complete data set, it doesn’t load complete data set in memory.
You can pass an index to Numpy array to get required data.
Use this data to pass to the Neural network.
Have a small batch size.
For SVM: Partial fit will work
Steps:
Divide one big data set in small size data sets.
Use a partial fit method of SVM, it requires a subset of the complete data set.
Repeat step 2 for other subsets.
However, you could actually face such an issue in reality. So, you could check out the best laptop for Machine Learning to prevent that. Having said that, let’s move on to some questions on deep learning.
Deep Learning is nothing but a paradigm of machine learning which has shown incredible promise in recent years. This is because of the fact that Deep Learning shows a great analogy with the functioning of the human brain.
Machine learning is a field of computer science that gives computers the ability to learn without being explicitly programmed. Machine learning can be categorised in the following three categories.
Supervised machine learning,
Unsupervised machine learning,
Reinforcement learning
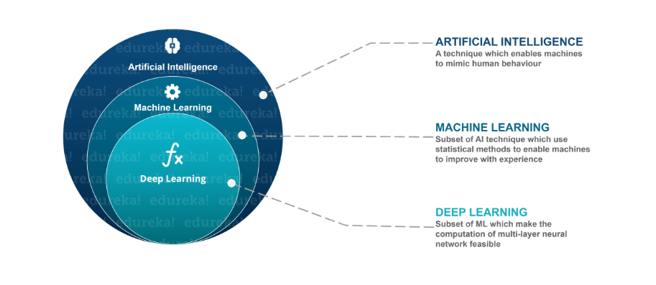 Deep Learning is a subfield of machine learning concerned with algorithms inspired by the structure and function of the brain called artificial neural networks.
Now although Deep Learning has been around for many years, the major breakthroughs from these techniques came just in recent years. This is because of two main reasons:
The increase in the amount of data generated through various sources
The growth in hardware resources required to run these models
GPUs are multiple times faster and they help us build bigger and deeper deep learning models in comparatively less time than we required previously.
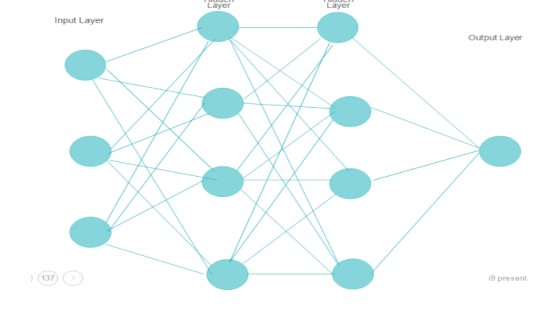
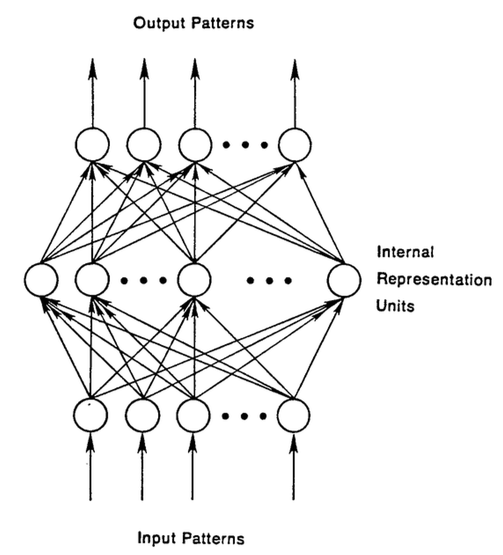
Q91. Explain Neural Network Fundamentals
A neural network in data science aims to imitate a human brain neuron, where different neurons combine together and perform a task. It learns the generalizations or patterns from data and uses this knowledge to predict output for new data, without any human intervention.
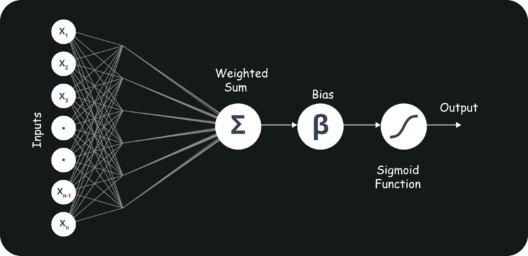
The simplest neural network can be a perceptron. It contains a single neuron, which performs the 2 operations, a weighted sum of all the inputs, and an activation function.
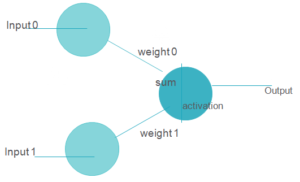
More complicated neural networks consist of the following 3 layers-
The figure below shows a neural network-
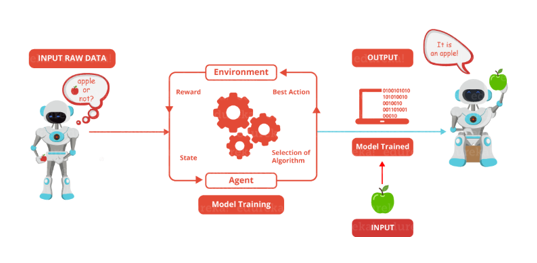 Reinforcement Learning is learning what to do and how to map situations to actions. The end result is to maximise the numerical reward signal. The learner is not told which action to take but instead must discover which action will yield the maximum reward. Reinforcement learning is inspired by the learning of human beings, it is based on the reward/penalty mechanism.
Artificial Neural networks are a specific set of algorithms that have revolutionized machine learning. They are inspired by biological neural networks. Neural Networks can adapt to changing the input so the network generates the best possible result without needing to redesign the output criteria.
Artificial Neural Networks works on the same principle as a biological Neural Network. It consists of inputs which get processed with weighted sums and Bias, with the help of Activation Functions.
There are two methods here: we can either initialize the weights to zero or assign them randomly.
Initializing all weights to 0: This makes your model similar to a linear model. All the neurons and every layer perform the same operation, giving the same output and making the deep net useless.
Initializing all weights randomly: Here, the weights are assigned randomly by initializing them very close to 0. It gives better accuracy to the model since every neuron performs different computations. This is the most commonly used method.
Q96. What Is the Cost Function?
Also referred to as “loss” or “error,” cost function is a measure to evaluate how good your model’s performance is. It’s used to compute the error of the output layer during backpropagation. We push that error backwards through the neural network and use that during the different training functions.
Q97. What Are Hyperparameters?
With neural networks, you’re usually working with hyperparameters once the data is formatted correctly. A hyperparameter is a parameter whose value is set before the learning process begins. It determines how a network is trained and the structure of the network (such as the number of hidden units, the learning rate, epochs, etc.).
Q98. What Will Happen If the Learning Rate Is Set inaccurately (Too Low or Too High)?
When your learning rate is too low, training of the model will progress very slowly as we are making minimal updates to the weights. It will take many updates before reaching the minimum point.
If the learning rate is set too high, this causes undesirable divergent behaviour to the loss function due to drastic updates in weights. It may fail to converge (model can give a good output) or even diverge (data is too chaotic for the network to train).
Epoch – Represents one iteration over the entire dataset (everything put into the training model).
Batch – Refers to when we cannot pass the entire dataset into the neural network at once, so we divide the dataset into several batches.
Iteration – if we have 10,000 images as data and a batch size of 200. then an epoch should run 50 iterations (10,000 divided by 50).
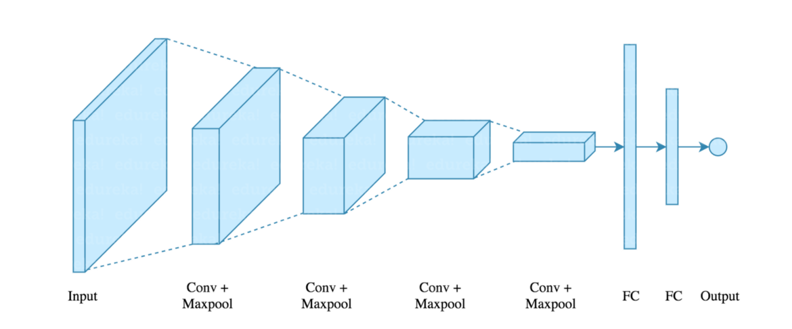
There are four layers in CNN:
Convolutional Layer – the layer that performs a convolutional operation, creating several smaller picture windows to go over the data.
ReLU Layer – it brings non-linearity to the network and converts all the negative pixels to zero. The output is a rectified feature map.
Pooling Layer – pooling is a down-sampling operation that reduces the dimensionality of the feature map.
Fully Connected Layer – this layer recognizes and classifies the objects in the image.
 Q101. What Is Pooling on CNN, and How Does It Work?
Pooling is used to reduce the spatial dimensions of a CNN. It performs down-sampling operations to reduce the dimensionality and creates a pooled feature map by sliding a filter matrix over the input matrix.
RNNs are a type of artificial neural networks designed to recognise the pattern from the sequence of data such as Time series, stock market and government agencies etc. To understand recurrent nets, first, you have to understand the basics of feedforward nets.
Both these networks RNN and feed-forward named after the way they channel information through a series of mathematical orations performed at the nodes of the network. One feeds information through straight(never touching the same node twice), while the other cycles it through a loop, and the latter are called recurrent.
Recurrent networks, on the other hand, take as their input, not just the current input example they see, but also the what they have perceived previously in time.
The decision a recurrent neural network reached at time t-1 affects the decision that it will reach one moment later at time t. So recurrent networks have two sources of input, the present and the recent past, which combine to determine how they respond to new data, much as we do in life.
The error they generate will return via backpropagation and be used to adjust their weights until error can’t go any lower. Remember, the purpose of recurrent nets is to classify sequential input accurately. We rely on the backpropagation of error and gradient descent to do so.
Long-Short-Term Memory (LSTM) is a special kind of recurrent neural network capable of learning long-term dependencies, remembering information for long periods as its default behaviour. There are three steps in an LSTM network:
As in Neural Networks, MLPs have an input layer, a hidden layer, and an output layer. It has the same structure as a single layer perceptron with one or more hidden layers. A single layer perceptron can classify only linear separable classes with binary output (0,1), but MLP can classify nonlinear classes.
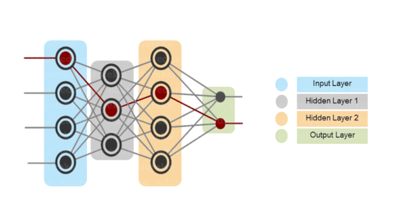 Except for the input layer, each node in the other layers uses a nonlinear activation function. This means the input layers, the data coming in, and the activation function is based upon all nodes and weights being added together, producing the output. MLP uses a supervised learning method called “backpropagation.” In backpropagation, the neural network calculates the error with the help of cost function. It propagates this error backward from where it came (adjusts the weights to train the model more accurately).
Q105. How can time-series data be declared as stationery?
When the key parameters of the time series data don’t vary with time, the time series is declared as stationary. These parameters may be mean or variance. There are no trends or seasonal effects in stationary times series. The Data science models need stationary time series data. The below figure shows a stationary time series.
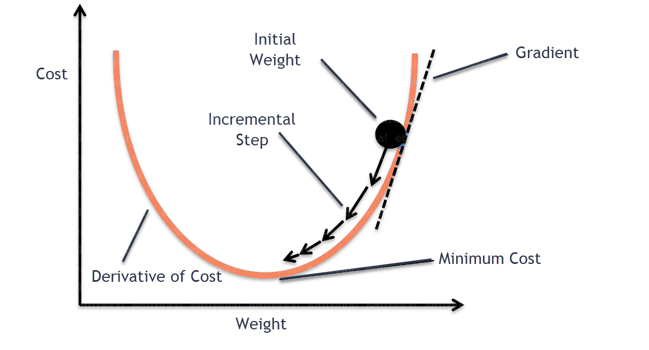
To Understand Gradient Descent, Let’s understand what is a Gradient first.
A gradient measures how much the output of a function changes if you change the inputs a little bit. It simply measures the change in all weights with regard to the change in error. You can also think of a gradient as the slope of a function.
Gradient Descent can be thought of climbing down to the bottom of a valley, instead of climbing up a hill. This is because it is a minimization algorithm that minimizes a given function (Activation Function).
 Q107. What is exploding gradients?
While training an RNN, if you see exponentially growing (very large) error gradients which accumulate and result in very large updates to neural network model weights during training, they’re known as exploding gradients. At an extreme, the values of weights can become so large as to overflow and result in NaN values.
This has the effect of your model is unstable and unable to learn from your training data.
While training an RNN, your slope can become either too small; this makes the training difficult. The problem is known as a Vanishing Gradient when the slope is too small. It leads to long training times, poor performance, and low accuracy.
Backpropagation is a training algorithm used for multilayer neural network. In this method, we move the error from an end of the network to all weights inside the network, thus allowing efficient gradient computation.
It has the following steps:
Forward Propagation of Training Data
Derivatives are computed using output and target
Back Propagate for computing derivative of error wrt output activation
Using previously calculated derivatives for output
Update the Weights
Stochastic Gradient Descent: We use only a single training example for calculation of gradient and update parameters.
Batch Gradient Descent: We calculate the gradient for the whole dataset and perform the update at each iteration.
Mini-batch Gradient Descent: It’s one of the most popular optimization algorithms. It’s a variant of Stochastic Gradient Descent and here instead of single training example, mini-batch of samples is used.
Microsoft Cognitive Toolkit
Keras
Caffe
Chainer
The Activation function is used to introduce non-linearity into the neural network helping it to learn more complex function. Without which the neural network would be only able to learn linear function which is a linear combination of its input data. An activation function is a function in an artificial neuron that delivers an output based on inputs.
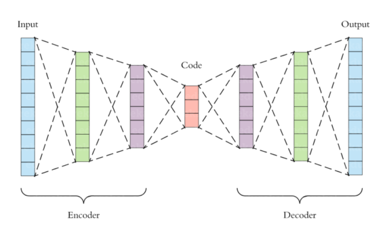
Auto-encoders are simple learning networks that aim to transform inputs into outputs with the minimum possible error. This means that we want the output to be as close to input as possible. We add a couple of layers between the input and the output, and the sizes of these layers are smaller than the input layer. The auto-encoder receives unlabelled input which is then encoded to reconstruct the input.
 Q115. What is a Boltzmann Machine?
 Boltzmann machines have a simple learning algorithm that allows them to discover interesting features that represent complex regularities in the training data. The Boltzmann machine is basically used to optimise the weights and the quantity for the given problem. The learning algorithm is very slow in networks with many layers of feature detectors. “Restricted Boltzmann Machines” algorithm has a single layer of feature detectors which makes it faster than the rest.
 Q116. What Is Dropout and Batch Normalization?
Dropout is a technique of randomly dropping out hidden and visible units of a network to prevent overfitting of data (typically dropping 20 per cent of the nodes). It doubles the number of iterations needed to converge the network.
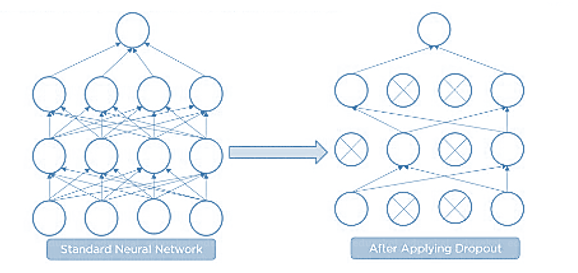
Batch normalization is the technique to improve the performance and stability of neural networks by normalizing the inputs in every layer so that they have mean output activation of zero and standard deviation of one.
Batch Gradient Descent | Stochastic Gradient Descent |
The batch gradient computes the gradient using the entire dataset. | The stochastic gradient computes the gradient using a single sample. |
It takes time to converge because the volume of data is huge, and weights update slowly. | It converges much faster than the batch gradient because it updates weight more frequently. |
Tensorflow provides both C++ and Python APIs, making it easier to work on and has a faster compilation time compared to other Deep Learning libraries like Keras and Torch. Tensorflow supports both CPU and GPU computing devices.
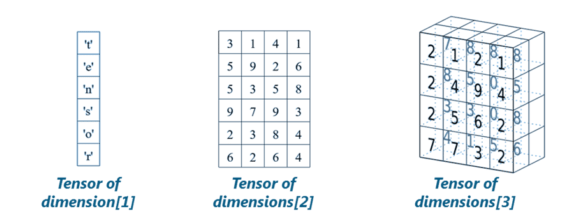
Q119. What Do You Mean by Tensor in Tensorflow?
A tensor is a mathematical object represented as arrays of higher dimensions. These arrays of data with different dimensions and ranks fed as input to the neural network are called “Tensors.”
 Q120. What is the Computational Graph?
Everything in a tensorflow is based on creating a computational graph. It has a network of nodes where each node operates, Nodes represent mathematical operations, and edges represent tensors. Since data flows in the form of a graph, it is also called a “DataFlow Graph.”
Suppose there is a wine shop purchasing wine from dealers, which they resell later. But some dealers sell fake wine. In this case, the shop owner should be able to distinguish between fake and authentic wine.
The forger will try different techniques to sell fake wine and make sure specific techniques go past the shop owner’s check. The shop owner would probably get some feedback from wine experts that some of the wine is not original. The owner would have to improve how he determines whether a wine is fake or authentic.
The forger’s goal is to create wines that are indistinguishable from the authentic ones while the shop owner intends to tell if the wine is real or not accurately
Let us understand this example with the help of an image.
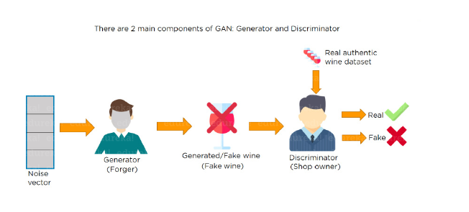 There is a noise vector coming into the forger who is generating fake wine.
Here the forger acts as a Generator.
The shop owner acts as a Discriminator.
The Discriminator gets two inputs; one is the fake wine, while the other is the real authentic wine. The shop owner has to figure out whether it is real or fake.
So, there are two primary components of Generative Adversarial Network (GAN) named:
Generator
Discriminator
The generator is a CNN that keeps keys producing images and is closer in appearance to the real images while the discriminator tries to determine the difference between real and fake images The ultimate aim is to make the discriminator learn to identify real and fake images.
Apart from the very technical questions, your interviewer could even hit you up with a few simple ones to check your overall confidence, in the likes of the following.
The following are some of the important skills to possess which will come handy when performing data analysis using Python.
Good understanding of the built-in data types especially lists, dictionaries, tuples, and sets.
Mastery of N-dimensional NumPy Arrays.
Mastery of Pandas dataframes.
Ability to perform element-wise vector and matrix operations on NumPy arrays.
Knowing that you should use the Anaconda distribution and the conda package manager.
Familiarity with Scikit-learn. **Scikit-Learn Cheat Sheet**
Ability to write efficient list comprehensions instead of traditional for loops.
Ability to write small, clean functions (important for any developer), preferably pure functions that don’t alter objects.
Knowing how to profile the performance of a Python script and how to optimize bottlenecks.
The following will help to tackle any problem in data analytics and machine learning.
I hope this set of Data Science Interview Questions and Answers will help you in preparing for your interviews. All the best!
Got a question for us? Please mention it in the comments section and we will get back to you soon.
Edureka has a specially curated Data Science Course that helps you gain expertise in Machine Learning Algorithms like K-Means Clustering, Decision Trees, Random Forest, Naive Bayes. You’ll also learn the concepts of Statistics, Time Series, Text Mining and an introduction to Deep Learning. You’ll solve real-life case studies on Media, Healthcare, Social Media, Aviation, HR. New batches for this course are starting soon!!
Also, If you are looking for online structured training in Data Science, edureka! has a specially curated Data Science Program by IIT Guwahati that helps you gain expertise in Statistics, Data Wrangling, Exploratory Data Analysis, and Machine Learning Algorithms like K-Means Clustering, Decision Trees, Random Forest, and Naive Bayes. You’ll also learn the concepts of Time Series, Text Mining, and an introduction to Deep Learning. New batches for this course are starting soon!!


 Thank you for registering Join Edureka Meetup community for 100+ Free Webinars each month JOIN MEETUP GROUP
very well video, thanks to dedicate your time teaching us.