Data Science with Python Certification Course
- 132k Enrolled Learners
- Weekend
- Live Class
(49300)


 Copy Link!
The word ‘Data’ has been in existence for ages now. In the era of 2.5 Quintillion bytes of data being generated every day, data plays a crucial role in decision making for business operations. But how do you think we can deal with so much data? Well, there are several roles in the industry today that deal with data to gather insights, and one such vital role is a Data Analyst. A Data Analyst is a professional whose sole role is to play around with data and gather hidden insights for the benefit of a business. A Data Analyst can expect an average salary of ₹404,660 (IND)or $83,878 (US). I believe that you are already aware of these facts and this has made you land on this Data Analyst Interview Questions article.
In this article about Data Analyst Interview Questions, I will be discussing the top questions related to Data Analytics asked in your interviews. These questions are collected after consulting with Data Analytics Training experts. For your better understanding, I have divided the article into the following sections:
So, let’s get started guys.
This section of questions will consist of all the basic questions that you need to know related to Data Analytics and its terminologies.
Data analysis is the process of inspecting, cleaning, transforming, and modeling data with the goal of discovering useful information, informing conclusions, and supporting decision-making. This process has multiple facets and approaches, encompassing various techniques under a variety of names, in different business, science, and social science domains.
A Data Analyst’s responsibilities often include:
Their skills typically include knowledge of data analysis tools and programming languages (like SQL, R, Python), as well as a strong understanding of statistics
Here are some key skills usually required for a data analyst:
Data analysis can present several challenges, depending on the specific context, data, and goals of the analysis. Here are a few common ones:
Here are some popular ones:
Which validation methods are employed by data analysts?
There are several methods that data analysts can use for validation:
What is the significance of Exploratory Data Analysis (EDA)?
The significance of EDA includes:
An outlier is a data point that significantly differs from other similar points. It’s an observation that lies an abnormal distance from other values in a random sample from a population. In other words, an outlier is very much different from the “usual” data.
Depending on the context, outliers can have a significant impact on your data analysis. In statistical analysis, outliers can distort the interpretation of the data by skewing averages and inflating the standard deviation.
Outliers can be detected in several ways, including visual methods and statistical techniques:
Explain a hash table.
A hash table, also known as a hash map, is a data structure that implements an associative array abstract data type, a structure that can map keys to values. Hash tables use a hash function to compute an index into an array of buckets or slots, from which the desired value can be found.
Hash tables are widely used because they are efficient. In a well-dimensioned hash table, the average cost (in terms of time complexity) for each lookup is independent of the number of elements stored in the table. Many programming languages have built-in support for hash tables, including Python (dictionaries), JavaScript (objects), and Java (HashMap).
A collision in a hash table occurs when two different keys hash to the same index in the array. This situation arises because the number of possible keys typically greatly exceeds the number of indices available in the array. Even with a very good hash function, it’s impossible to avoid collisions entirely.
Here are some characteristics of a good data model:
| Data Mining | Data Analysis |
| Used to recognize patterns in data stored. | Used to order & organize raw data in a meaningful manner. |
| Mining is performed on clean and well-documented data. | The analysis of data involves Data Cleaning. So, data is not present in a well-documented format. |
| Results extracted from data mining are not easy to interpret. | Results extracted from data analysis are easy to interpret. |
Table 1: Data Mining vs Data Analysis
So, if you have to summarize, Data Mining is often used to identify patterns in the data stored. It is mostly used for Machine Learning, and analysts have to just recognize the patterns with the help of algorithms. Whereas, Data Analysis is used to gather insights from raw data, which has to be cleaned and organized before performing the analysis.
Data analysis is the process of collecting, cleansing, interpreting, transforming and modeling data to gather insights and generate reports to gain business profits. Refer to the image below to know the various steps involved in the process.
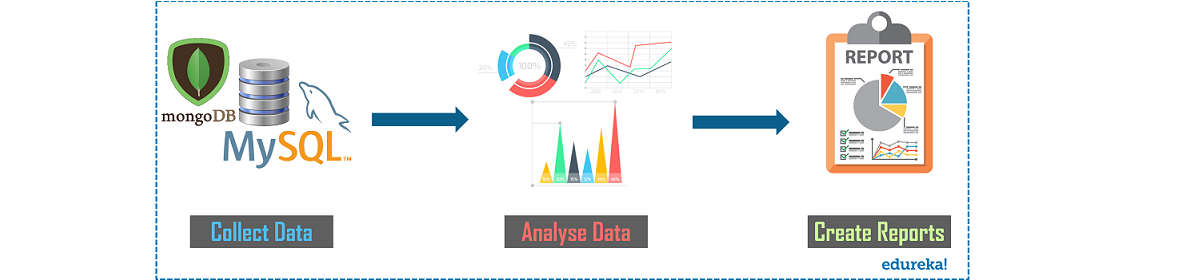 Fig 1: Process of Data Analysis
Data Mining: Data Mining refers to the analysis of data with respect to finding relations that have not been discovered earlier. It mainly focuses on the detection of unusual records, dependencies and cluster analysis.
Data Profiling: Data Profiling refers to the process of analyzing individual attributes of data. It mainly focuses on providing valuable information on data attributes such as data type, frequency etc.
Data Cleansing or Wrangling or Data Cleaning. All mean the same thing. It is the process of identifying and removing errors to enhance the quality of data. You can refer to the below image to know the various ways to deal with missing data.

Fig 2: Ways of Data Cleansing
As the name suggests Data Validation is the process of validating data. This step mainly has two processes involved in it. These are Data Screening and Data Verification.
Well, the answer to this question may vary from person to person. But below are a few criteria which I think are a must to be considered to decide whether a developed data model is good or not:
Business data keeps changing on a day-to-day basis, but the format doesn’t change. As and when a business operation enters a new market, sees a sudden rise of opposition or sees its own position rising or falling, it is recommended to retrain the model. So, as and when the business dynamics change, it is recommended to retrain the model with the changing behaviors of customers.
The following are a few problems that are usually encountered while performing data analysis.
This method is used to impute the missing attribute values which are imputed by the attribute values that are most similar to the attribute whose values are missing. The similarity of the two attributes is determined by using the distance functions.
The complete Hadoop Ecosystem was developed for processing large dataset for an application in a distributed computing environment. The Hadoop Ecosystem consists of the following Hadoop components.
Now, moving on to the next set of questions, which is the Excel Interview Questions.
Microsoft Excel is one of the simplest and most powerful software applications available out there. It lets users do quantitative analysis, statistical analysis with an intuitive interface for data manipulation, so much so that its usage spans across different domains and professional requirements. This is an important field that gives a head-start for becoming a Data Analyst. So, now let us quickly discuss the questions asked with respect to this topic.
The waterfall chart shows both positive and negative values which lead to the final result value. For example, if you are analyzing a company’s net income, then you can have all the cost values in this chart. With such kind of a chart, you can visually, see how the value from revenue to the net income is obtained when all the costs are deducted.
You can highlight cells with negative values in Excel by using the conditional formatting. Below are the steps that you can follow:

Fig 3: Snapshot of Highlighting cells in Excel
Sometimes you may want to remove all the formatting and just want to have the basic/simple data. To do this, you can use the ‘Clear Formats’ options found in the Home Tab. You can evidently see the option when you click on the ‘Clear’ drop down.

Fig 4: Snapshot of clearing all formatting in Excel
A Pivot Table is a simple feature in Microsoft Excel which allows you to quickly summarize huge datasets. It is really easy to use as it requires dragging and dropping rows/columns headers to create reports.
A Pivot table is made up of four different sections:
Yes, we can create one Pivot Table from multiple different tables when there is a connection between these tables.
If you wish to select all the blank cells in Excel, then you can use the Go To Special Dialog Box in Excel. Below are the steps that you can follow to select all the blank cells in Excel.
The final step will select all the blank cells in your dataset.
Well, the answer to this question varies on a case-to-case basis. But, here are a few common questions that you can ask while creating a dashboard in Excel.
A Print Area in Excel is a range of cells that you designate to print whenever you print that worksheet. For example, if you just want to print the first 20 rows from the entire worksheet, then you can set the first 20 rows as the Print Area.
Now, to set the Print Area in Excel, you can follow the below steps:
Well, there are various ways to handle slow Excel workbooks. But, here are a few ways in which you can handle workbooks.
Multiple sorting refers to the sorting of a column and then sorting the other column by keeping the first column intact. In Excel, you can definitely sort multiple columns at a one time.
To do multiple sorting, you need to use the Sort Dialog Box. Now, to get this, you can select the data that you want to sort and then click on the Data Tab. After that, click on the Sort icon.
Moving onto the next set of questions, which is questions asked related to Statistics.
Statistics is a branch of mathematics dealing with data collection and organization, analysis, interpretation, and presentation. Statistics can be divided into two categories: Differential and Inferential Statistics. This field is related to mathematics and thus gives a kickstart to Data Analysis career.
This is one of the most important and widely used distributions in statistics. Commonly known as the Bell Curve or Gaussian curve, normal distributions, measure how much values can differ in their means and in their standard deviations. Refer to the below image.

Fig 5: Normal Distribution
As you can see in the above image, data is usually distributed around a central value without any bias to the left or right side. Also, the random variables are distributed in the form of a symmetrical bell-shaped curve.
Q2. What is A/B Testing?
A/B testing is the statistical hypothesis testing for a randomized experiment with two variables A and B. Also known as the split testing, it is an analytical method that estimates population parameters based on sample statistics. This test compares two web pages by showing two variants A and B, to a similar number of visitors, and the variant which gives better conversion rate wins.
The goal of A/B Testing is to identify if there are any changes to the web page. For example, if you have a banner ad on which you have spent an ample amount of money. Then, you can find out the return of investment i.e. the click rate through the banner ad.
The statistical power of sensitivity is used to validate the accuracy of a classifier. This classifier can be either Logistic Regression, Support Vector Machine, Random Forest etc.
If I have to define sensitivity, then sensitivity is nothing but the ratio of Predicted True Events to Total Events. Now, True Events are the events which were true and the model also predicts them as true.
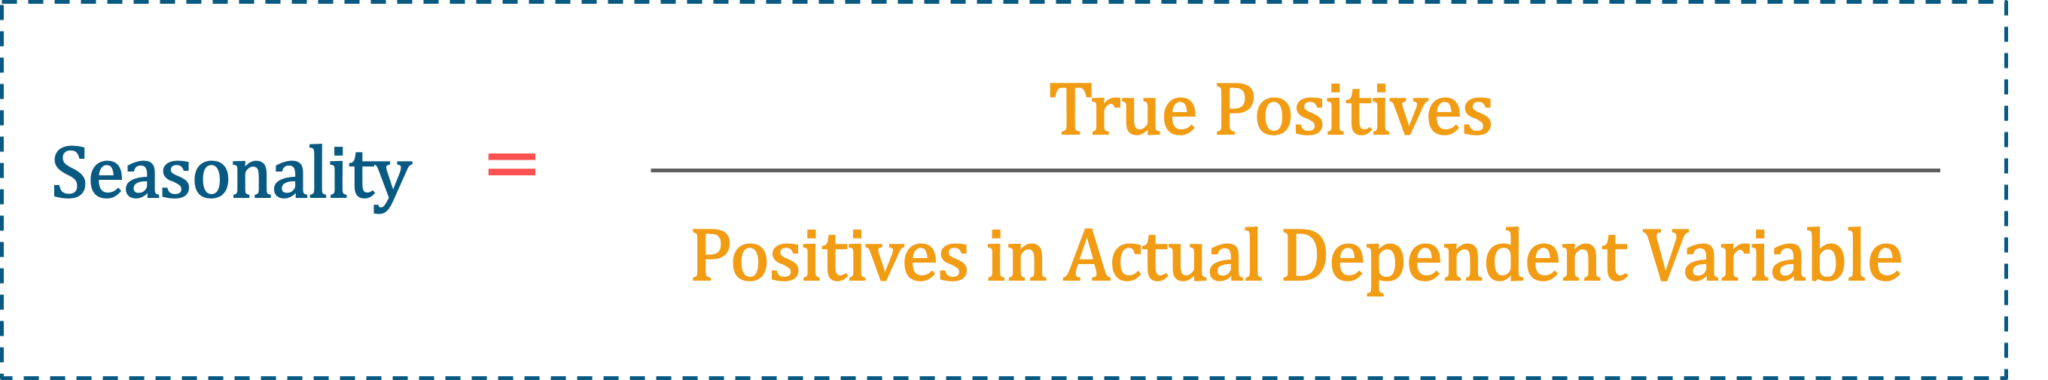
Fig 6: Seasonality Formula
To explain the Alternative Hypothesis, you can first explain what the null hypothesis is. Null Hypothesis is a statistical phenomenon that is used to test for possible rejection under the assumption that result of chance would be true.
After this, you can say that the alternative hypothesis is again a statistical phenomenon which is contrary to the Null Hypothesis. Usually, it is considered that the observations are a result of an effect with some chance of variation.
The differences between univariate, bivariate and multivariate analysis are as follows:
Eigenvectors: Eigenvectors are basically used to understand linear transformations. These are calculated for a correlation or a covariance matrix.
For definition purposes, you can say that Eigenvectors are the directions along which a specific linear transformation acts either by flipping, compressing or stretching.
Eigenvalue: Eigenvalues can be referred to as the strength of the transformation or the factor by which the compression occurs in the direction of eigenvectors.
You can answer this question, by first explaining, what exactly T-tests are. Refer below for an explanation of T-Test.
T-Tests are a type of hypothesis tests, by which you can compare means. Each test that you perform on your sample data, brings down your sample data to a single value i.e. T-value. Refer below for the formula.

Fig 7: Formula to calculate t-value
Now, to explain this formula, you can use the analogy of the signal-to-noise ratio, since the formula is in a ratio format.
Here, the numerator would be a signal and the denominator would be the noise.
So, to calculate 1-Sample T-test, you have to subtract the null hypothesis value from the sample mean. If your sample mean is equal to 7 and the null hypothesis value is 2, then the signal would be equal to 5.
So, we can say that the difference between the sample mean and the null hypothesis is directly proportional to the strength of the signal.
Now, if you observe the denominator which is the noise, in our case it is the measure of variability known as the standard error of the mean. So, this basically indicates how accurately your sample estimates the mean of the population or your complete dataset.
So, you can consider that noise is indirectly proportional to the precision of the sample.
Now, the ratio between the signal-to-noise is how you can calculate the T-Test 1. So, you can see how distinguishable your signal is from the noise.
To calculate, 2-Sample Test, you need to find out the ratio between the difference of the two samples to the null hypothesis.
So, if I have to summarize for you, the 1-Sample T-test determines how a sample set holds against a mean, while the 2-Sample T-test determines if the mean between 2 sample sets is really significant for the entire population or purely by chance.
The different types of hypothesis testing are as follows:
To represent a Bayesian Network in the form of Markov Random Fields, you can consider the following examples:
Consider two variables which are connected through an edge in a Bayesian network, then we can have a probability distribution that factorizes into a probability of A and then the probability of B. Whereas, the same network if we mention in Markov Random Field, it would be represented as a single potential function. Refer below:
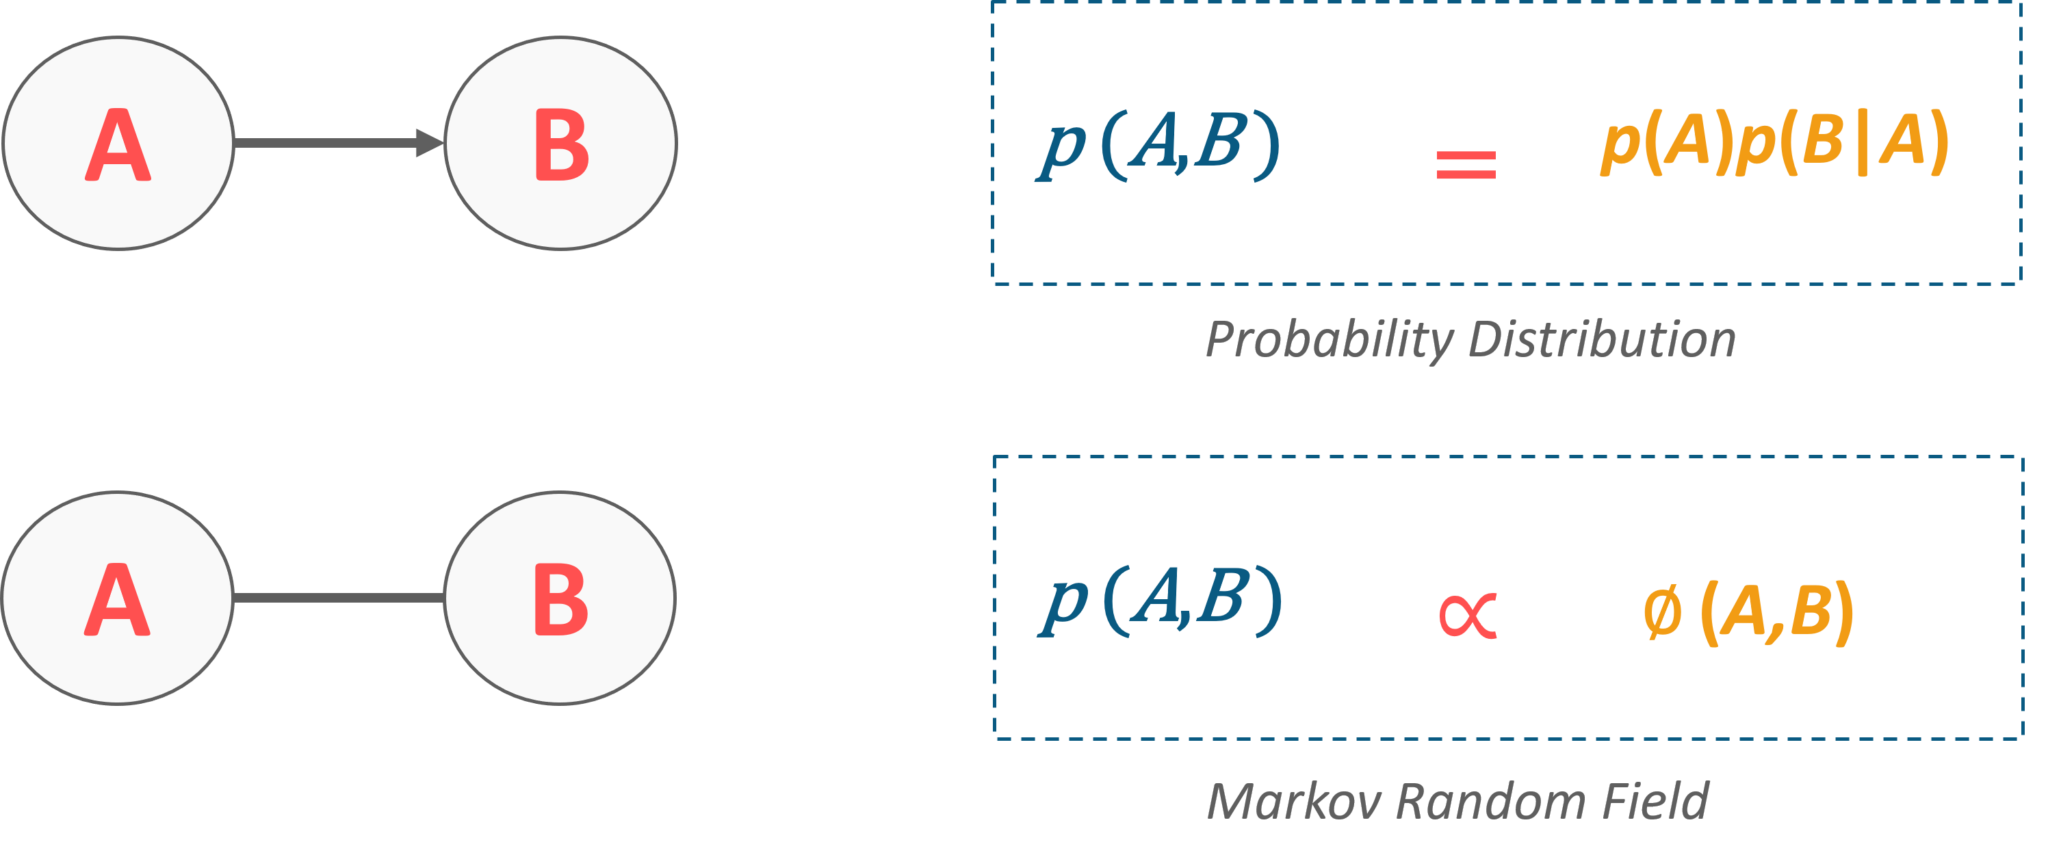
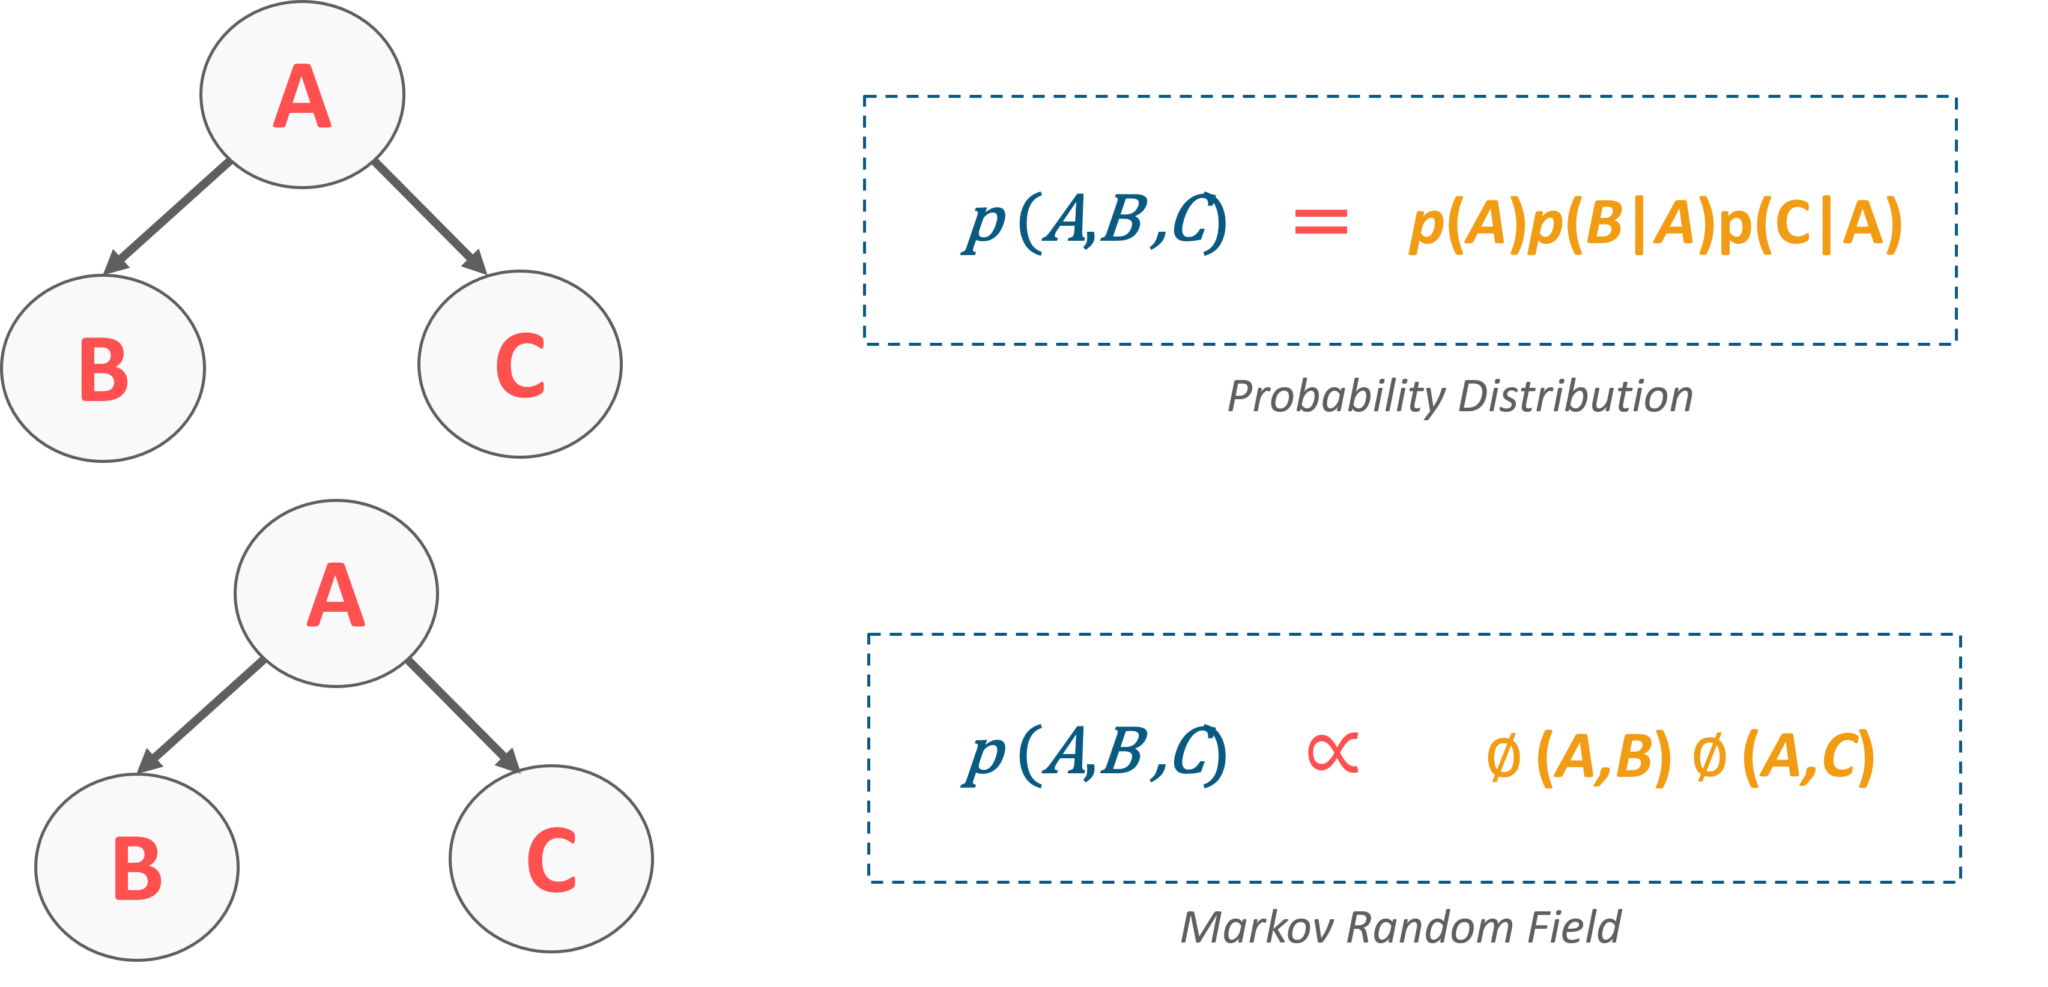
Fig 8: Representation of Bayesian Network in MRF
Variance and Covariance are two mathematical terms which are used frequently in statistics. Variance basically refers to how apart numbers are in relation to the mean. Covariance, on the other hand, refers to how two random variables will change together. This is basically used to calculate the correlation between variables.
In case you have attended any Data Analytics interview in the recent past, do paste those interview questions in the comments section and we’ll answer them ASAP. You can also comment below if you have any questions in your mind, which you might have faced in your Data Analytics interview.
Now, let us move on to the next set of questions which is the SAS Interview Questions.
Statistical Analysis System(SAS) provided by SAS Institute itself is the most popular Data Analytics tool in the market. In simple words, SAS can process complex data and generate meaningful insights that would help organizations make better decisions or predict possible outcomes in the near future. So, this lets you mine, alter, manage and retrieve data from different sources and analyze it.
Interleaving in SAS means combining individual sorted SAS data sets into one sorted data set. You can interleave data sets using a SET statement along with a BY statement.
In the example that you can see below, the data sets are sorted by the variable Age.

Fig 9: Example for Interleaving in SAS
We can sort and then join the data sets on Age by writing the following query:
data combined;
set Data1, Data2;
by Age;
run;
The basic syntax style of writing code in SAS is as follows:
To answer this question, you can first answer what exactly a Do loop is. So, a Do loop is used to execute a block of code repeatedly, based on a condition. You can refer to the image below to see the workflow of the Do loop.
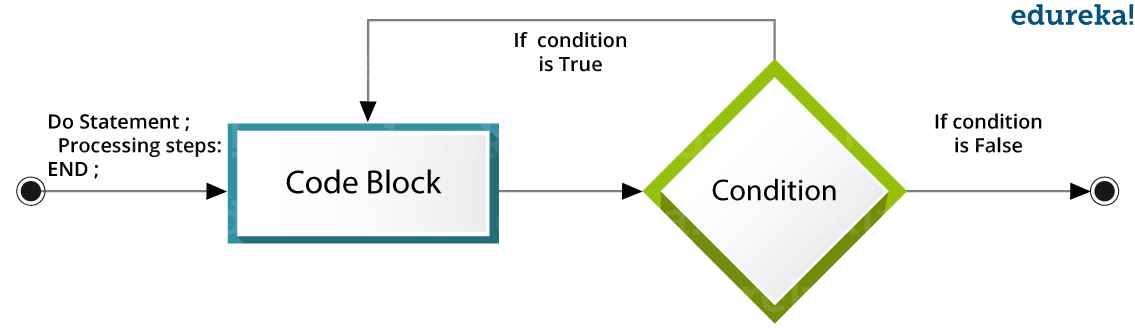
Fig 10: Workflow of Do Loop
If you have to explain with respect to the code, then let us say we want to calculate the SUM and the number of variables.
For the loops you can write the code as follows:
DATA ExampleLoop;
SUM=0;
Do VAR = 1 = 10;
SUM = SUM + VAR;
END;
PROC PRINT DATA = ExampleLoop;
Run;
The output would be:
| Obs | SUM | VAR |
| 1 | 55 | 11 |
Table 2: Output of Do Index Loop
DATA ExampleLoop;
SUM = 0;
VAR = 1;
Do While(VAR<15);
SUM = SUM + VAR;
VAR+1;
END;
PROC PRINT DATA = ExampleLoop;
Run;
| Obs | SUM | VAR |
| 1 | 105 | 15 |
Table 3: Output of Do While Loop
DATA ExampleLoop;
SUM = 0;
VAR = 1;
Do Until(VAR>15);
SUM=SUM+VAR;
VAR+1;
END;
PROC PRINT;
Run;
| Obs | SUM | VAR |
| 1 | 120 | 16 |
Table 4: Output of Do Until Loop
The ANYDIGIT function is used to search for a character string. After the string is found it will simply return the desired string.
When you specify sing dash between the variables, then that specifies consecutively numbered variables. Similarly, if you specify the Double Dash between the variables, then that would specify all the variables available within the dataset.
Consider the following data set:
Data Set: ID NAME X1 X2 Y1 X3
Then, X1 – X3 would return X1 X2 X3
and X1 — X3 would return X1 X2 Y1 X3
The trailing @ is commonly known as the column pointer. So, when we use the trailing @, in the Input statement, it gives you the ability to read a part of the raw data line, test it and decide how can the additional data be read from the same record.
An Input statement ending with @@ instructs the program to release the current raw data line only when there are no data values left to be read from that line. The @@, therefore, holds the input record even across multiple iterations of the data step.
Here, we will calculate the weeks between 31st December 2017 and 1st January 2018. 31st December 2017 was a Saturday. So 1st January 2018 will be a Sunday in the next week.
PROC SQL is nothing but a simultaneous process for all the observations. The following steps occur when a PROC SQL gets executed:
We can read the last observation to a new dataset using end = dataset option.
For example:
data example.newdataset;
set example.olddataset end=last;
If last;
run;
Where newdataset is a new data set to be created and olddataset is the existing data set. last is the temporary variable (initialized to 0) which is set to 1 when the set statement reads the last observation.
The SUM function returns the sum of non-missing arguments whereas “+” operator returns a missing value if any of the arguments are missing. Consider the following example.
Example:
data exampledata1;
input a b c;
cards;
44 4 4
34 3 4
34 3 4
. 1 2
24 . 4
44 4 .
25 3 1
;
run;
data exampledata2;
set exampledata1;
x = sum(a,b,c);
y=a+b+c;
run;
In the output, the value of y is missing for 4th, 5th, and 6th observation as we have used the “+” operator to calculate the value of y.
x y
52 52
41 41
41 41
3 .
28 .
48 .
29 29
If you wish to know more questions on SAS, then refer a full-fledged article on SAS Interview Questions.
Now, let us move on to the next set of questions which is the SQL Interview Questions.
RDBMS is one of the most commonly used databases till date, and therefore SQL skills are indispensable in most of the job roles such as a Data Analyst. Knowing Structured Query Language, boots your path on becoming a data analyst, as it will be clear in your interviews that you know how to handle databases.
The default TCP port assigned by the official Internet Number Authority(IANA) for SQL server is 1433.
A Database Management System (DBMS) is a software application that interacts with the user, applications and the database itself to capture and analyze data. The data stored in the database can be modified, retrieved and deleted, and can be of any type like strings, numbers, images etc.
There are mainly 4 types of DBMS, which are Hierarchical, Relational, Network, and Object-Oriented DBMS.
ACID is an acronym for Atomicity, Consistency, Isolation, and Durability. This property is used in the databases to ensure whether the data transactions are processed reliably in the system or not. If you have to define each of these terms, then you can refer below.
Normalization is the process of organizing data to avoid duplication and redundancy. There are many successive levels of normalization. These are called normal forms. Each consecutive normal form depends on the previous one. The first three normal forms are usually adequate.
Some of the advantages are:
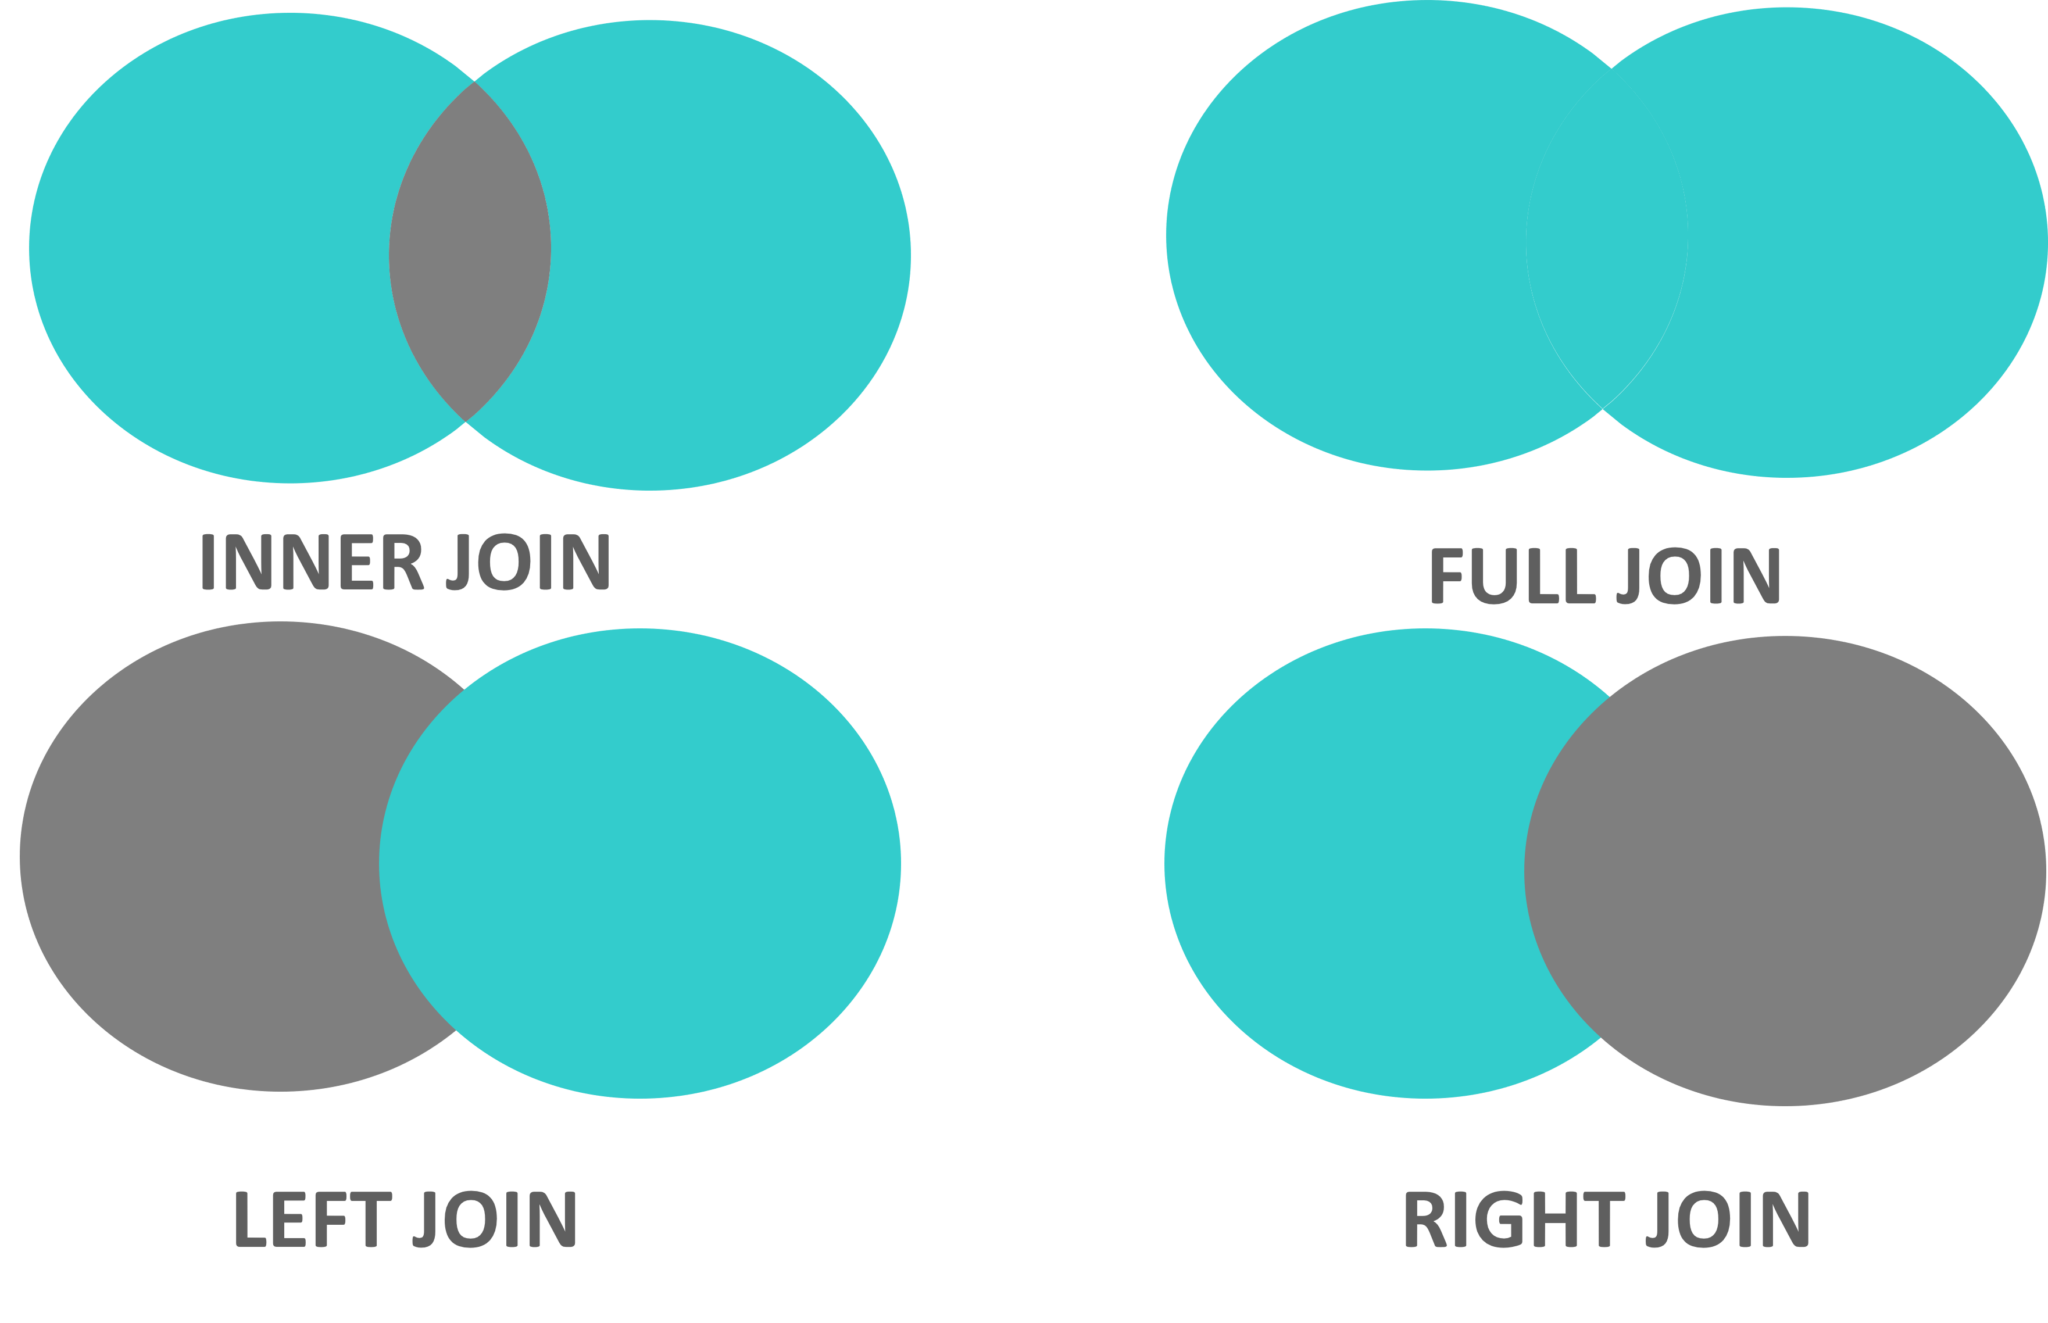
The various types of joins used to retrieve data between tables are Inner Join, Left Join, Right Join and Full Outer Join. Refer to the image on the right side.
You can fetch alternate tuples by using the row number of the tuple. Let us say if we want to display the employeeId, of even records, then you can use the mod function and simply write the following query:
Select employeeId from (Select rownumber, employeeId from employee) where mod(rownumber,2)=0
where ‘employee’ is the table name.
Similarly, if you want to display the employeeId of odd records, then you can write the following query
Select employeeId from (Select rownumber, employeeId from employee) where mod(rownumber ,2)=1

Table 5: Example Table
SELECT
c.Customer_Id,
CustomerName,
Course_Id,
Course_Date,
count(Customer_Course_Id) AS count
FROM customers c JOIN course_details d ON d.Customer_Id = c.Customer_Id
GROUP BY c.Customer_Id,
CustomerName,
Course_Id,
Course_Date
HAVING count( Customer_Course_Id ) > 1
ORDER BY Course_Date DESC;
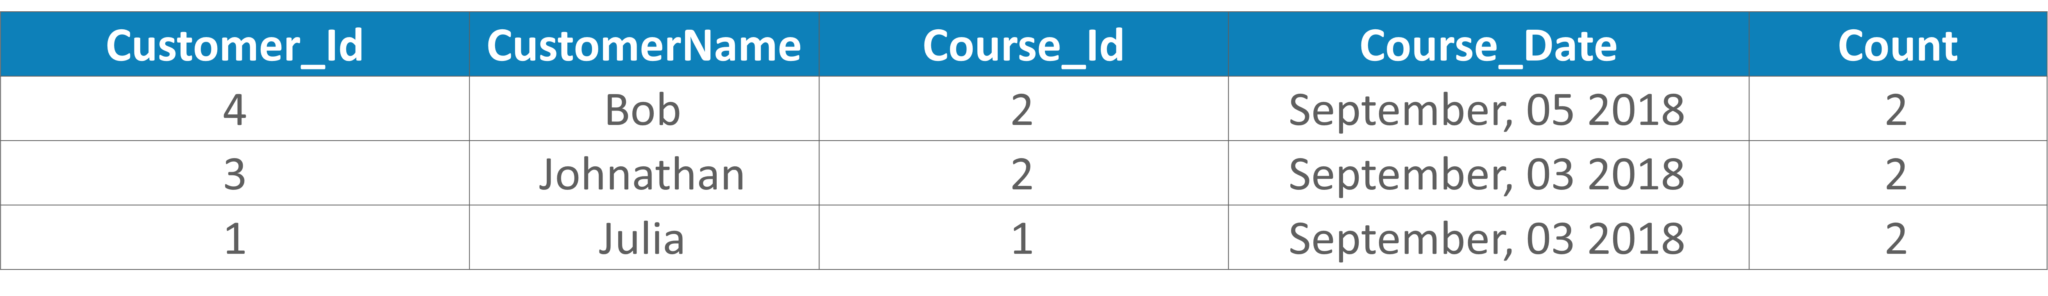
Table 6: Output Table
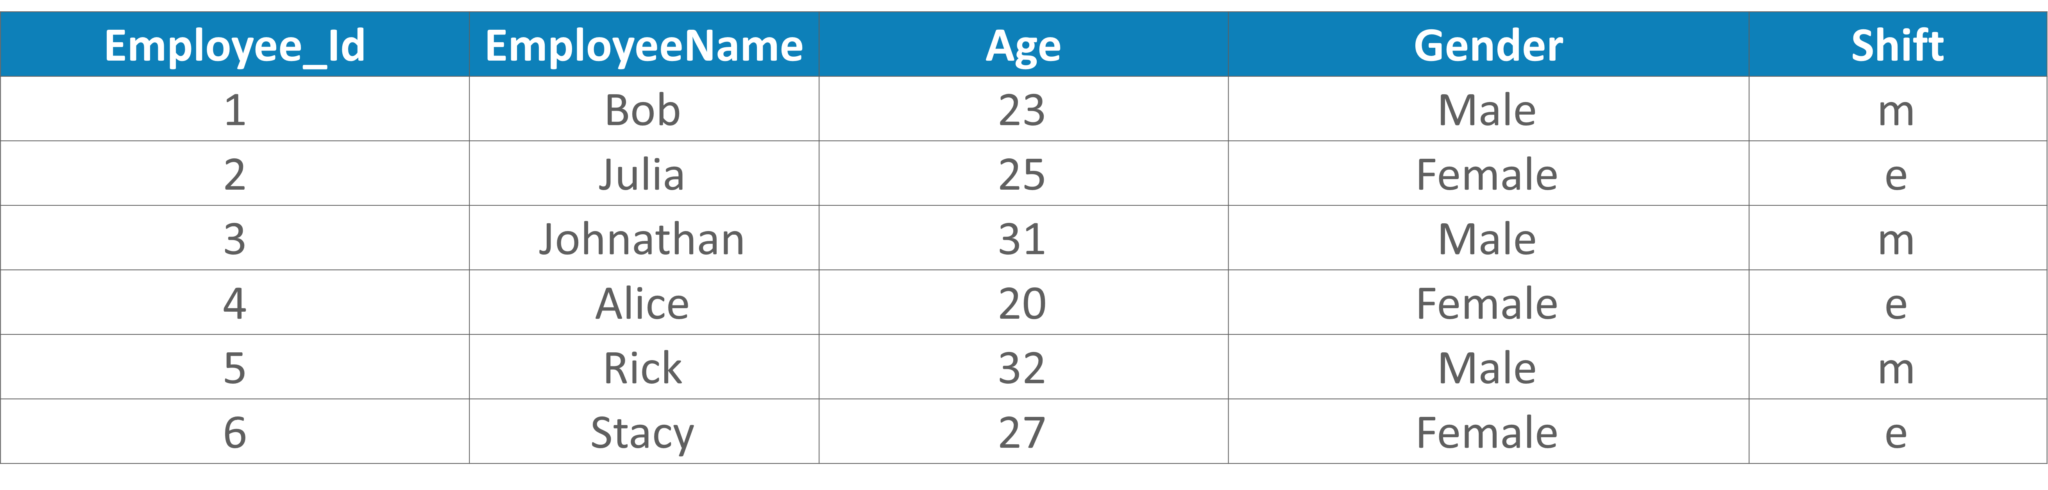
Table 7: Example Table
You can write the below query:
UPDATE Employee_Details SET Shift = CASE Shift WHEN 'm' THEN 'e' ELSE 'm' END
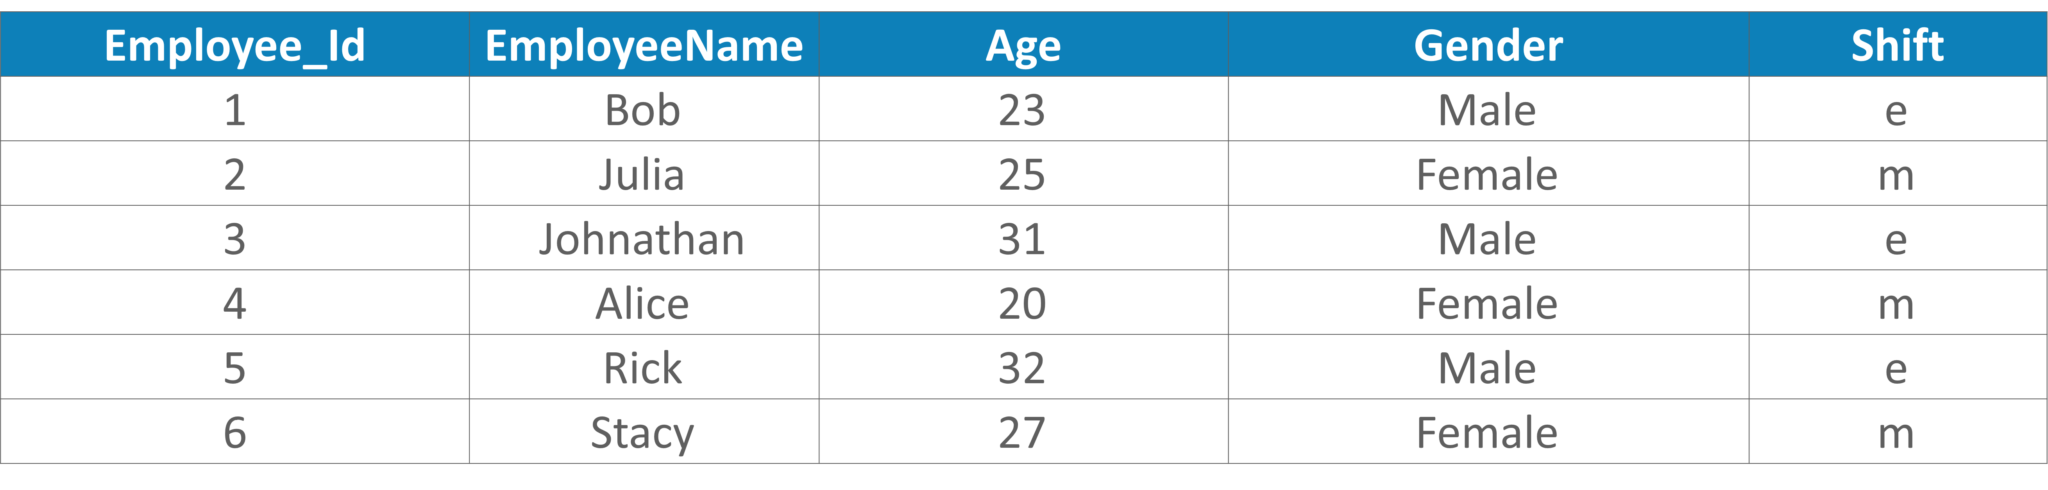
Table 8: Output Table
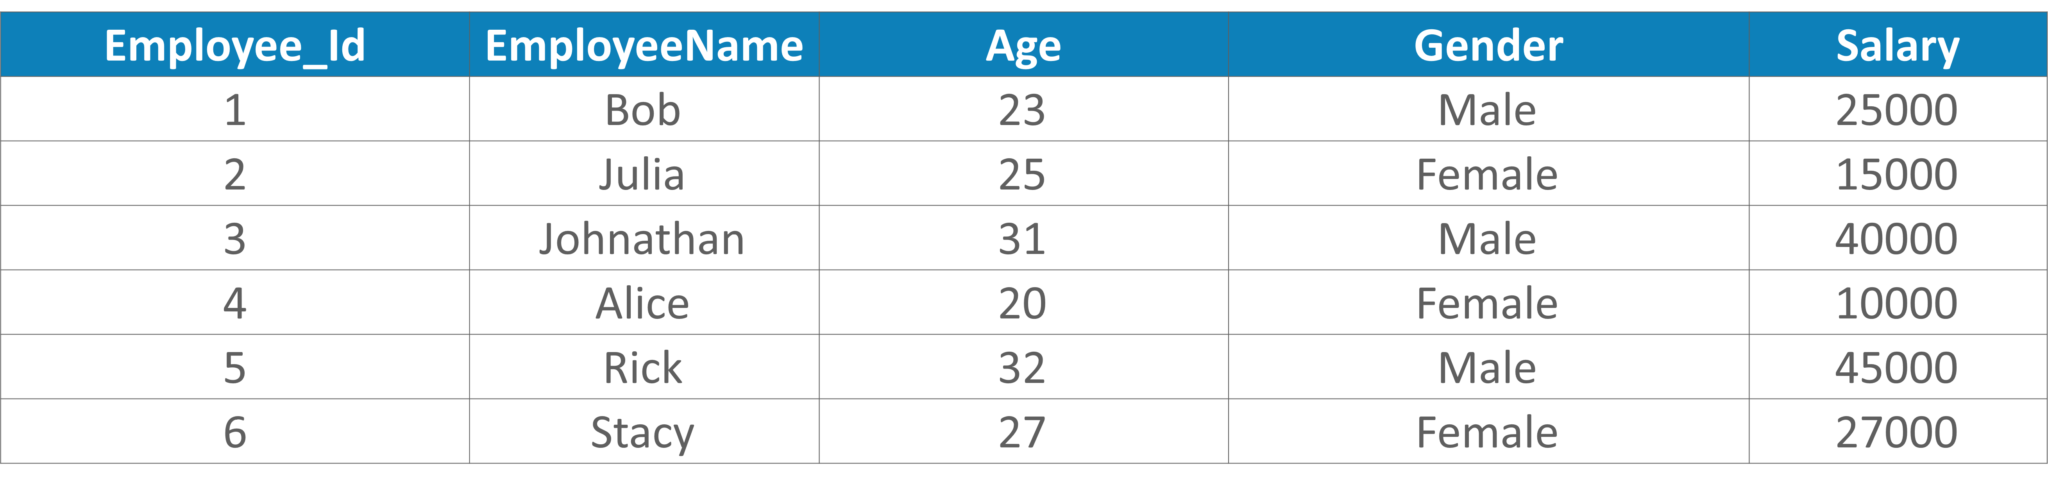
Table 9: Example Table
SELECT TOP 1 Salary
FROM(
SELECT TOP 3 Salary
FROM Employee_Details
ORDER BY salary DESC) AS emp
ORDER BY salary ASC;
NVL(exp1, exp2) and NVL2(exp1, exp2, exp3) are functions which check whether the value of exp1 is null or not.
If we use NVL(exp1,exp2) function, then if exp1 is not null, then the value of exp1 will be returned; else the value of exp2 will be returned. But, exp2 must be of the same data type of exp1.
Similarly, if we use NVL2(exp1, exp2, exp3) function, then if exp1 is not null, exp2 will be returned, else the value of exp3 will be returned.
If you wish to know more questions on SQL, then refer a full-fledged article on SQL Interview Questions.
Now, moving onto the next set of questions asked i.e. the Tableau Interview Questions.![]()
Tableau is a business intelligence software which allows anyone to connect to the respective data. It visualizes and creates interactive, shareable dashboards. knowing Tableau will enhance your understanding of Data Analysis and Data Visualization.
| Parameters | Tableau | Power BI |
| Cost | Tableau may costs you around $1000 for a yearly subscription | $100 for a yearly subscription |
| Licensing | Tableau is not free | 3 months trial period |
| Ease of use | Tableau offers variety when it comes to implementation and consulting services. | Power BI is easier to implement. |
| Visualization | scales better to larger datasets | Power BI it is easier to upload data sets |
| Year Of Establishment | 2003 | 2013 |
| Cost | High | Low |
| Application | AD-Hoc Analysis | Dashboard |
| Users | Analysts | Technical / Non-technical People |
| Support Level | High | Low |
| Scalability (Large Data-Sets) | Very Good | Good |
| Licensing | Flexible | Rigid |
| Overall functionality | Very Good | Good |
| Infrastructure | Flexible | Software as a service |
Table 10: Differences between Tableau and Power BI
If you wish to learn more about the differences between Power BI and Tableau, you can check out the following video:
This Edureka “Power BI vs Tableau” video compares two of the hottest Data visualization and Business Intelligence tools.
Dual Axis is a phenomenon provided by Tableau. This helps the users to view two scales of two measures in the same graph. Websites such as Indeed.com make use of dual axis to show the comparison between two measures and the growth of these two measures in a septic set of years. Dual axes let you compare multiple measures at once, having two independent axes layered on top of one another. Refer to the below image to see how it looks.
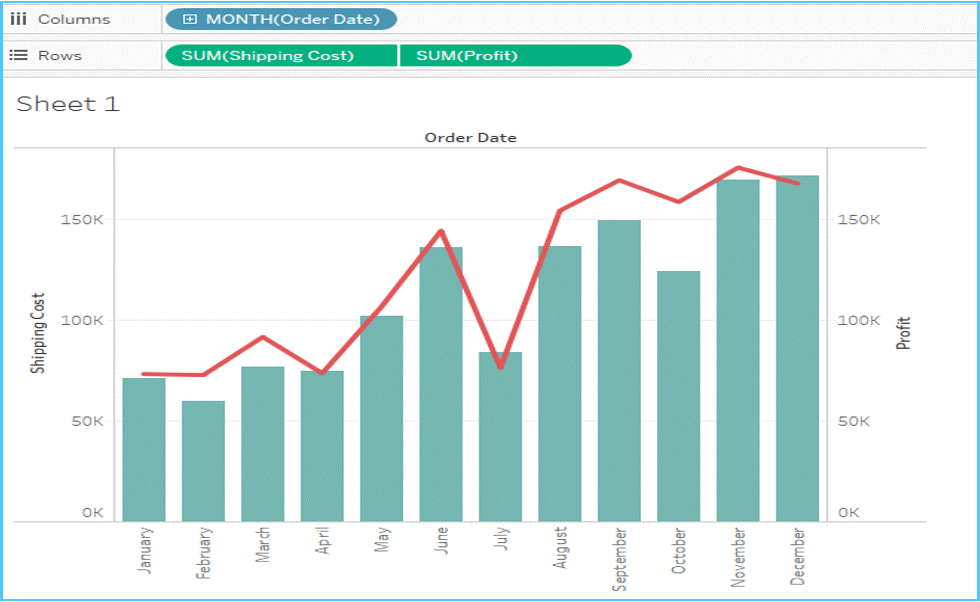
Fig 11: Representation of Dual Axis
The Joining term is used when you are combining data from the same source, for example, worksheet in an Excel file or tables in an Oracle database. While blending requires two completely defined data sources in your report.
To create a calculated field in Tableau, you can follow the below steps:
Take a look at the snapshot below:
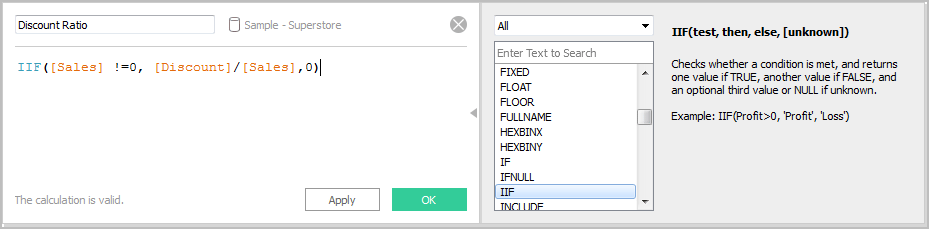
Fig 12: Snapshot of calculated fields
Learn more about this data visualization tool with Tableau certification training from industry experts.
To view the underlying SQL Queries in Tableau, we mainly have two options:
According to your question, you must have a country, state, profit and sales fields in your dataset.
A heat map is used for comparing categories with color and size. With heat maps, you can compare two different measures together. A treemap is a powerful visualization that does the same as that of the heat map. Apart from that, it is also used for illustrating hierarchical data and part-to-whole relationships.
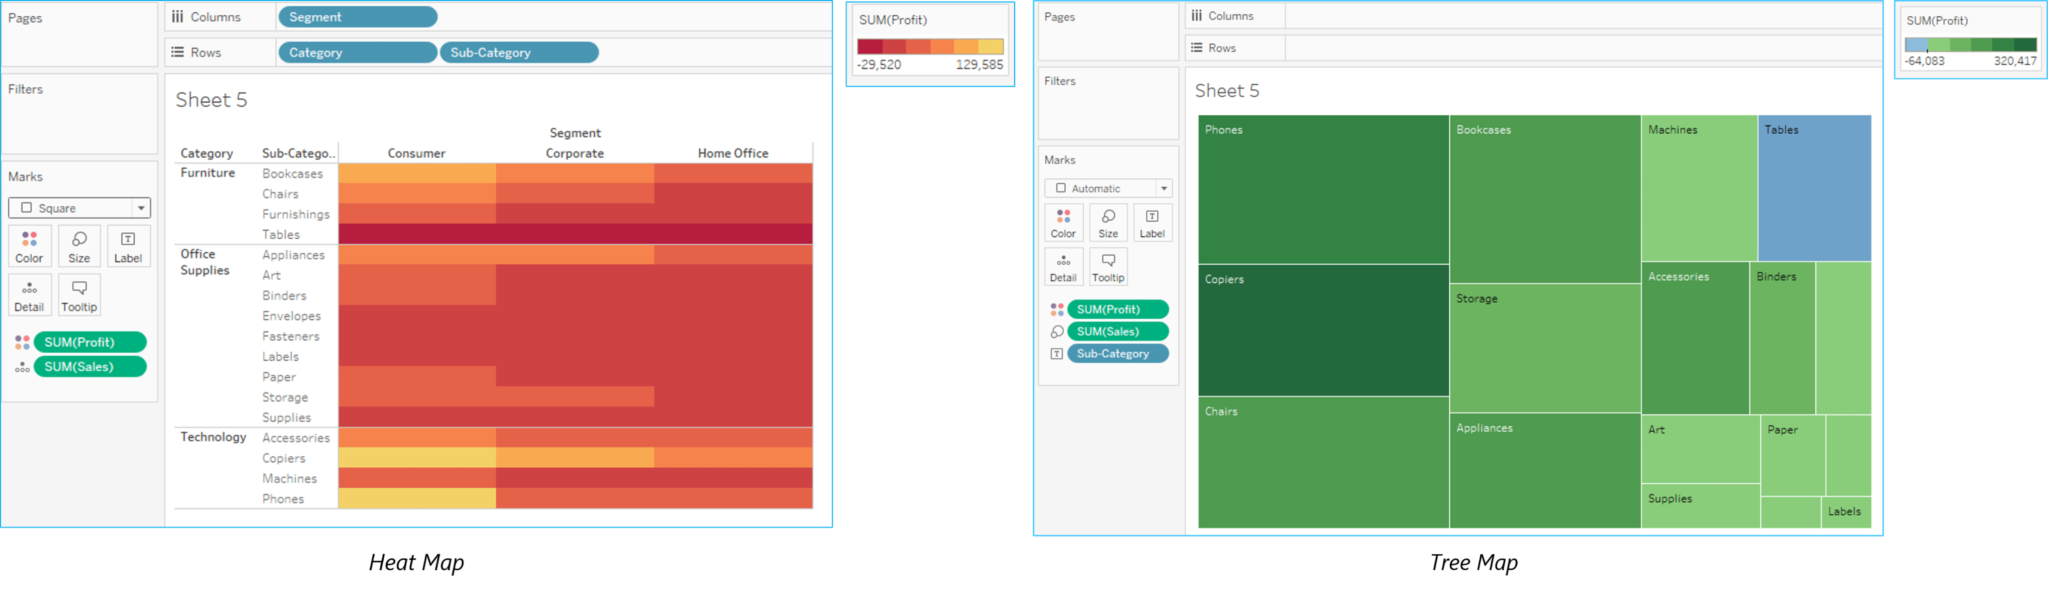
Fig 13: Difference Between Heat Map and Tree Map
Aggregation of data: Aggregation of data refers to the process of viewing numeric values or the measures at a higher and more summarized level of data. When you place a measure on a shelf, Tableau will automatically aggregate your data. You can determine whether the aggregation has been applied to a field or not, by simply looking at the function. This is because the function always appears in front of the field’s name when it is placed on a shelf.
Example: Sales field will become SUM(Sales) after aggregation.
You can aggregate measures using Tableau only for relational data sources. Multidimensional data sources contain aggregated data only. In Tableau, multidimensional data sources are supported only in Windows.
Disaggregation of data: Disaggregation of data allows you to view every row of the data source which can be useful while analyzing measures.
Example: Consider a scenario where you are analyzing results from a product satisfaction survey. Here the Age of participants is along one axis. Now, you can aggregate the Age field to determine the average age of participants, or you can disaggregate the data to determine the age at which the participants were most satisfied with their product.
Stories are used to narrate a sequence of events or make a business use-case. The Tableau Dashboard provides various options to create a story. Each story point can be based on a different view or dashboard, or the entire story can be based on the same visualization, just seen at different stages, with different marks filtered and annotations added.
To create a story in Tableau you can follow the below steps:
You can embed interactive Tableau views and dashboards into web pages, blogs, wiki pages, web applications, and intranet portals. Embedded views update as the underlying data changes, or as their workbooks are updated on Tableau Server. Embedded views follow the same licensing and permission restrictions used on Tableau Server. That is, to see a Tableau view that’s embedded in a web page, the person accessing the view must also have an account on Tableau Server.
Alternatively, if your organization uses a core-based license on Tableau Server, a Guest account is available. This allows people in your organization to view and interact with Tableau views embedded in web pages without having to sign in to the server. Contact your server or site administrator to find out if the Guest user is enabled for the site you publish to.
You can do the following to embed views and adjust their default appearance:
If you wish to know more questions on Tableau, then refer a full-fledged article on Tableau Interview Questions.
Now, moving onto something more interesting, I have planned up a set of 5 puzzles, that are most commonly asked in the Data Analyst Interviews.
The analytics industry predominantly relies on professionals who not only excel in various Data Analyzing tools available in the market but also on those professionals who have excellent problem-solving skills. The most important skill that you need to possess is the approach to the problem. Oh yes, your approach should also be in such a way that you should be able to explain to the interviewer.
So let’s get started!
If you notice the condition in the question, you will observe that there is a circular misplacement. By which I mean that, if Black is wrongly labeled as Black, Black cannot be labeled as White. So, it must be named as Back + White. If you consider that all the 3 jars are wrongly placed, that is, Black + White jar contains either the Black balls or the White balls, but not the both. Now, just assume you pick one ball from the Black + White jar and let us assume it to be a Black ball. So, obviously, you will name the jar as Black. However, the jar labeled Black cannot have Black + White. Thus, the third jar left in the process should be labeled Black + White. So, if you just pick up one ball, you can correctly label the jars.
The approach to answering this question is simple. You just must cut the pumpkin horizontally down the center, followed by making 2 other cuts vertically intersecting each other. So, this would give you your 8 equal pieces.
Now, you can start solving the problem by considering the number of cars racing. Since there are 25 cars racing with 5 lanes, there would be initially 5 races conducted, with each group having 5 cars. Next, a sixth race will be conducted between the winners of the first 5 races to determine the 3 fastest cars(let us say X1, Y1, and Z1).
Now, suppose X1 is the fastest among the three, then that means A1 is the fastest car among the 25 cars racing. But the question is how to find the 2nd and the 3rd fastest? We cannot assume that Y1 and Z1 are 2nd and 3rd since it may happen that the rest cars from the group of X1s’ cars could be faster than Y1 and Z1. So, to determine this a 7th race is conducted between cars Y1, Z1, and the cars from X1’s group(X2, X3), and the second car from Y1’s group Y2.
So, the cars that finish the 1st and 2nd is the 7th race are actually the 2nd and the 3rd fastest cars among all cars.
The solution to this puzzle is very simple. You just must pick 1 coin from the 1st stack, 2 coins from the 2nd stack, 3 coins from the 3rd stack and so on till 10 coins from the 10th stack. So, if you add the number of coins then it would be equal to 55.
So, if none of the coins are defective then the weight would 55*10 = 550 grams.
Yet, if stack 1 turns out to be defective, then the total weight would be 1 less then 550 grams, that is 549 grams. Similarly, if stack 2 was defective then the total weight would be equal to 2 less than 50 grams, that is 548 grams. Similarly, you can find for the other 8 cases.
So, just one measurement is needed to identify the defective stack.
The solution to the above problem can be as follows:
So, that’s an end to this article on Data Analyst Interview Questions.
Data Analyst Certification Course follows a set structure with 4 core courses and 7 electives spread across 15 weeks. It makes you an expert in key technologies related to Data Analytics. It is a structured learning path recommended by leading industry experts and ensures that you transform into an expert Data Analytics professional while making you learn the usage of tools such as R, SAS, Tableau, QlikView, Advanced Excel, Machine learning, etc. Individual courses focus on specialization in one or two specific skills, however, if you intend to become a Data Analyst, then this is the path for you to follow.
If you have any queries related to this article please leave them in the comments section below and we will revert as soon as possible.


 Thank you for registering Join Edureka Meetup community for 100+ Free Webinars each month JOIN MEETUP GROUP