
Advanced Executive Certificate in Supply Chai ...
- 1k Enrolled Learners
- Weekend/Weekday
- Live Class
(50)


 Copy Link!
Managing a project is not an easy task and what is more burdensome is the fact that the success of the project solely lies on the shoulders of a project manager. Thus in order to ensure the project success, Project Managers across the globe take the aid of Project Management tools. One such stable tool is the Gantt Chart in Project Management. Through this article, I will introduce you to this impressive tool along with its advantages and usage.
– Wikipedia
In layman terms, Gantt Charts are the visual representation of the project tasks/activities displayed against time. These charts typically outline all the activities that are performed in a project in a systematic order to represent critical pieces of information. This information includes who is assigned to do what, duration of each task, and overlapping activities in a project. This is why Gantt Charts are known to be the perfect allies of Project Managers as it helps them in planning, scheduling, coordinating, tracking and managing all the tasks involved in a project effortlessly.
Related Program: Project Management Masters Program!
Gantt Charts have been aiding the project managers for ages. The idea of bar charts was first introduced in 1765 by Joseph Priestly in his “Charts of Biography”. In 1786 William Playfair laid down another precursor of Gantt charts in his Commercial and Political Atlas. Later in 1896, Karol Adamiecki, a Polish engineer developed something similar to Gantt charts for his construction project. Then somewhere around 1910 to 1915, an American engineer, named Henry Gantt, introduced his version of the chart which raised to popularity as Gantt Chart, within a short period of time followed by mass adoption. During 1917-1918, Gantt Charts were used for the tracking of small arms and ammunition along with commercial shippings for World War I. With the passing of time, Gantt Chart became an official term and in 1923 it was first used in Wallace Clark’s book named “The Gantt Chart – A Working Tool of Management“. The adoption of the Gantt Chart kept on increasing and was being in a wide range of fields and domains. In the 1980s, with the development of the software industry, Gantt Charts experienced a sudden resurgence in popularity. Since then the Gantt Chart has become one of the most desired software by various project managers for monitoring and tracking the project progress.
Now that you are aware of how the Gantt chart in project management came into existence, let me now get into the details of the working of a Gantt Chart.
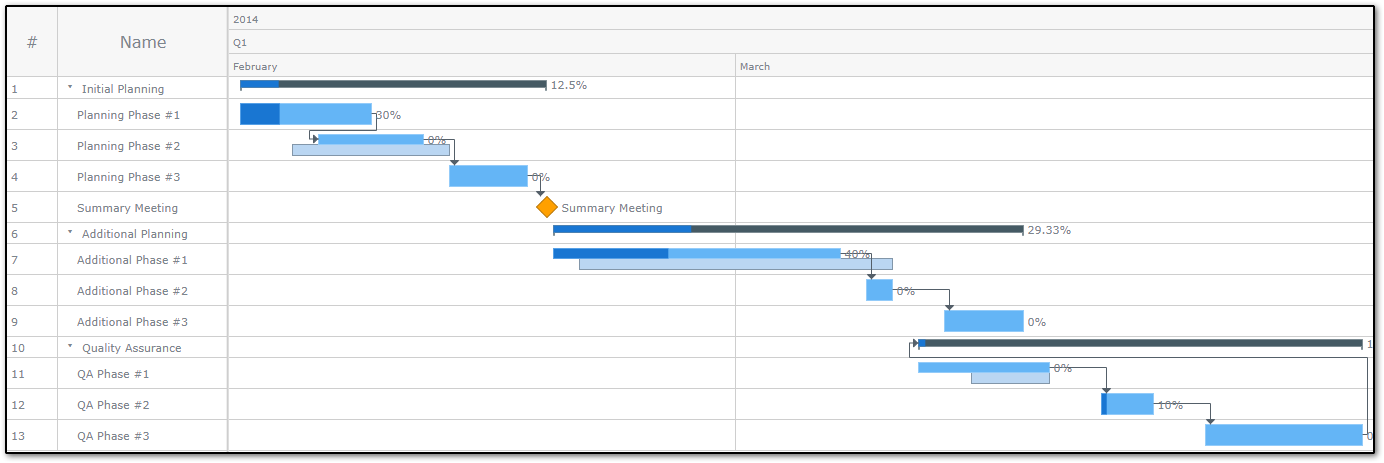
A typical Gantt chart is made up of several elements. Below I have listed down the major elements which will help you in reading the Gantt Chart with ease:
Learn about Software Project Management (SPM) here.
As I have mentioned before, Gantt Charts are great aids for Project Managers which helps them in various ways. Below I have listed down the most intriguing ways in which Gantt Charts benefits a Project manager and the Project as well:
Gantt Chart is a great visualization and prioritization tool that helps in boiling down multiple tasks and timelines into a single document. It provides a complete overview of the ongoing project along with critical information like assigned members, the order, duration and start and end date of activities, dependencies and many more. Through the Gantt Charts, stakeholders can easily track the project progress while grasping the individual processes working towards the project completion.
In any team, communication plays an integral part of project success. It is such a factor that can either make or break it. Most of the projects fail because of a lack of or improper communication. This is why project managers actively use Gantt charts which helps to replace the replace daily meetings and other status updates with a visual representation. This helps team members to easily understand the task progress and the timelines which result in improved communications and better relationship.
With a real-time timeline in view, team members become more effective. Gantt charts help the team members to focus on their assigned tasks. It also helps the teams, on the whole, to concentrate on the work at the front of a task timeline, as well as, at the tail end of a chart segment. Either way, teams can easily plug their own work habits into the overall project schedule thus completing it on time.
The Gantt charts help a project manager in scheduling the events in a sequenced manner and reduce the probability of overburdening team members. Sometimes, project managers also use a few combinations of charts in order to break down project tasks into more manageable sets of activities. This enhances coordination and reduces the chances of project failure.
With visible project start and end time, team members, as well as the project manager, can keep a track of their assigned tasks and finish them on time. This will provide them with an ample amount of time to focus more on the task at hand and come up with innovative ideas. Also, with everything at a place, the project manager can plan for new partnerships and collaborations.
One of the most important benefits of having the Gantt Chart is scheduling. Since time is an integral factor that decides the project’s success, the Gantt chart provides a unified view of the project’s progress along with start and end dates. This prevents unnecessary delays and helps the team members from getting swayed from their original timeline. With this, the tasks can be easily prioritized and ensure timely completion.
A project generally consists of a variety of complex tasks working towards the same goal. Gantt Charts helps in putting all these pieces together of a project puzzle and presents them in a simplified and visual manner. This helps project managers in making effective decisions regarding team, resources, assigning timelines, distributing tasks, etc.
Nothing is constant in this world. The same applies to project management as well where change is a crucial part of the process. Even with experts in your team, variations are bound to happen. Thus a project manager needs to stay prepared to make any adjustments required to keep the project on track and proceed towards success. With Gantt Charts at your aid, you can easily react to unexpected changes in the project scope or timeline. Gantt charts also help the project team in proceeding towards the project goals while tweaking the ways to reach there.
With this, we come to the end of this article on the Gantt Chart in Project Management. I hope I was able to provide you with a fair share of knowledge. If you want to know more, you can refer to this link: Project Management.
If you found this “Gantt Chart in Project Management” article relevant, check out the PMP Certification Course by Edureka, a trusted online learning company with a network of more than 250,000 satisfied learners spread across the globe.
Also Read:
How to enable vertical scroll bar on David Bacci’s Deneb Gantt Chart?
Got a question for us? Please mention it in the comments section of this Gantt Chart in Project Management and we will get back to you.


 Thank you for registering Join Edureka Meetup community for 100+ Free Webinars each month JOIN MEETUP GROUP

