
Advanced Power BI Certification Course with G ...
- 13k Enrolled Learners
- Weekend
- Live Class
(4230)


 Copy Link!
Tableau provides the ability to filter individual views or even entire data sources on dimensions, measures, or sets. What’s more, most of these Tableau filters can be put into the hands of you and your end-users to change – a powerful tactic for finding stories in the data.
Now, because this serves such an important purpose in the data cycle of any given organization, it makes for a very essential module in Tableau.
The filtering capability in a BI tool can serve a variety of purposes including minimizing the size of the data for efficiency purposes, cleaning up underlying data, removing irrelevant dimension members, and setting measure or date ranges for what you want to analyze. Data can also be organized and simplified before actual drill downs and aggregation functions through these Tableau filters.
Filtering is the way of expelling certain esteems or scope of qualities from an outcome set. Scene filtering highlight permits both basic situations utilizing field esteems and also propelled count or setting based channels.
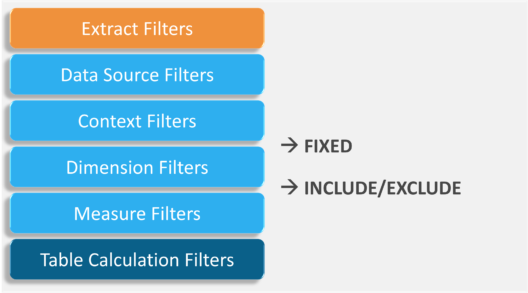
There are basically, 6 types of filters in Tableau and by order of operation they are:
Extract Filter
When you’re loading in your data you can choose to extract it, saving a snapshot of how it looks in your workbook and ultimately reducing the number of times Tableau queries the data source. To further reduce the size of the data going into Tableau, you can apply Tableau filters to the extract, which can be either by a certain dimension or measurement.
♠ A tip you can use to enhance your performance is that when you have finished with your Dashboard(s), extract and Hide All Unused Fields, which filters out all columns not used in the workbook.
Data Source Filter
Data Source Filters reduce the amount of data being fed into Tableau and restrict what data the viewer sees. With certain access rights, the viewer can view all of the underlying data, so if not done in the data source, Data Source Filters can be used to control sensitive data. One thing that is important to note is that, Extract and Data Source Filters are not linked. So, if you change back to a live connection your Data Source Filters will still be intact.
Context Filter
All filters in Tableau are applied to all rows of your data without regards to other filters. If for example, you need one filter to be applied before other filters, either for performance reasons (filter out a certain category to show Top X) or if you have a FIXED function in your view that needs to be filtered, making this a Context filter will make sure it is processed first. Context Filters are limited to the view but can be applied to Selected Sheets, All Using Same Data Source or All Using Related Data Source. While Context filters can improve performance, if they do not reduce the data enough (the rule is by 1/10 or more), the cost of computing them is too high to be beneficial.
Dimension Filter
Another name for non-aggregated filters (blue pills), such as Dimensions, Groups, Bins, Sets in Tableau, etc. These are applied by both dragging them on the Filters pane or right-clicking on the specific dimension and selecting Show Filter.
You can choose to either only show the things highlighted or by ticking Exclude it will instead filter out the Dimensions selected. This will be shown by a strikethrough. If you have many dimensions you can search for it, but make sure to click All or None to select/deselect all depending on what you want to do.
In the filter dialog that pops up, there are three tabs for Wildcard, Condition, and Top. Here you can choose if you want to show the Top 10 (or by Parameter) by certain measurement or by a certain condition. The filters can be edited at any time by right-clicking on the pill and Edit Filter.
Measure Filters
Aggregated filters are applied after Non-Aggregated filters, no matter what order they are shown on the Filters pane. When dragging it on, Tableau will ask you how you want to filter – in other words, what aggregation to use (Sum, Avg, Median, Standard Deviation, etc.) The second step will give you four options: Range of values, At least, At most and Special. You can choose to drag or type in the number you want to filter on. Special is if you want to include Null values or not.
Table Calculation Filters
A Table Calculation is the last filter applied and it applies the filters after the view has been produced. So if you want to filter the view without filtering the underlying data, Table Calculations Filters are the way to go. For example, if you are showing a reference line and don’t want this to change when using a quick filter.
You can filter individual data points (marks), or a selection of data points from your view. For example, if you have a scatter plot with outliers, you can exclude them from the view so you can better focus on the rest of the data.
To filter marks from the view, select a single mark (data point) or click and drag in the view to select several marks. On the tooltip that appears, you can:
♠ These filtering options are not available if a Wildcard Match filter is already specified for the same field.
You can also select headers to filter them from your view. To filter entire rows or columns of data from your view, select the header in the view. On the tooltip that appears, select to Exclude or Keep Only the selected data.
When you select a table header that is part of a hierarchy, all of the next level headers are also selected.
Another way to create a filter is to drag a field directly from the Data pane to the Filters shelf.
In Tableau Desktop, when you add a field to the Filters shelf, the Filter dialog box opens so you can define the filter. The Filter dialog box differs depending on whether you are filtering categorical data (dimensions), quantitative data (measures), or date fields.
You can control the appearance and interaction of your filter card in the view by selecting a filter card mode. To select a filter card mode, in the view, click the drop-down menu on the filter card and then select a mode from the list.
The types of filter card modes you see in the list of options depending on whether your filter is on a dimension or a measure.
♠ In addition to the general filter options and the filter modes, you control how your filter appears in the worksheet, on dashboards, or when published to the web even further in Tableau Desktop.
I hope you all, now, have a fair idea about Filters in Tableau from this blog. To get a better idea of Tableau as a whole, you can go through the various informative blogs on the list.
Related FAQ
How to make one filter independent and the other dependent?
Edureka has a specially curated Tableau Course which covers various concepts of data visualization in-depth, including conditional formatting, scripting, linking charts, dashboard integration, Tableau integration with R, and more. New batches are starting soon.


 Thank you for registering Join Edureka Meetup community for 100+ Free Webinars each month JOIN MEETUP GROUP