
Agentic AI Certification Training Course
- 138k Enrolled Learners
- Weekend/Weekday
- Live Class
(63442)


 Copy Link!
In a machine learning application, there might a few relevant variables present in the data set that may go unobserved while learning. In this article, we will learn about the Expectation-Maximization or EM algorithm in learning to understand the estimation of latent variables using the observed data. The following topics are discussed in this article:
In statistic modeling, a common problem arises as to how can we try to estimate the joint probability distribution for a data set.
Probability Density estimation is basically the construction of an estimate based on observed data. It involves selecting a probability distribution function and the parameters of that function that best explains the joint probability of the observed data.
import matplotlib.pyplot as plt
from numpy.random import normal

sample = normal(size=2000)

plt.hist(sample, bins=50)
plt.show()
Output: 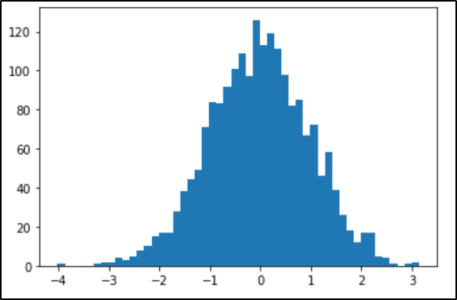
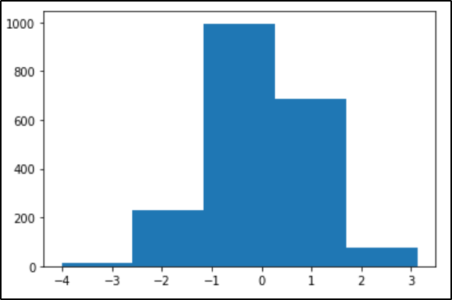
The choice of number of bins plays an important role here in terms of the number of bars in the distribution and in terms of how well the density is plotted. If we change the bins to 5 in the above example, the distributions will be divided into 5 bins as shown in the image below.
Density estimation requires selecting a probability distribution function and the parameters of that distribution that best explain the joint probability distribution of the sample. The problem with the density estimation can be the following:
How do you choose the probability distribution function?
How do you choose the parameters for the probability distribution function?
The most common technique to solve this problem is the Maximum Likelihood Estimation or simply “maximum likelihood”.
Maximum Likelihood Estimation
In statistics, maximum likelihood estimation is the method of estimating the parameters of a probability distribution by maximizing the likelihood function in order to make the observed data most probable for the statistical model.
But there lies a limitation with Maximum Likelihood, it assumes that the data is complete, fully observed, etc. It does not really mandate that the model will have access to all the data. Instead, it assumes that all the variables relevant to the model are already present. But in some cases, some relevant variables may remain hidden and cause inconsistencies.
And these unobserved or hidden variables are known as Latent Variables.
In the presence of latent variables, a conventional maximum likelihood estimator will not work as expected. One such approach to finding the appropriate model parameters in the presence of latent variables is the Expectation-Maximization algorithm or simply EM algorithm. Let us take a look at the EM algorithm in Machine Learning.
EM algorithm was proposed in 1997 by Arthur Dempster, Nan Laird, and Donald Rubin. It is basically used to find the local maximum likelihood parameters of a statistical model in case the latent variables are present or the data is missing or incomplete.

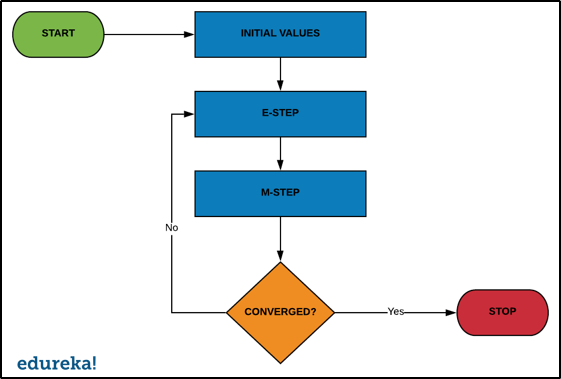
The EM Algorithm follows the following steps in order to find the relevant model parameters in the presence of latent variables.
Consider a set of starting parameters in incomplete data.
Expectation Step – This step is used to estimate the values of the missing values in the data. It involves the observed data to basically guess the values in the missing data.
Maximization Step – This step generates complete data after the Expectation step updates the missing values in the data.
Execute the step 2 and 3 until the convergence is met.
Convergence – The concept of convergence in probability is based on intuition. Let’s say we have two random variables if the probability of their difference is very small, it is said to be converged. In this case, convergence means if the values match each other.
Now that we know what is EM algorithm in Machine Learning, let us take a look at how it actually works.
The basic idea behind the EM algorithm is to use the observed data to estimate the missing data and then updating those values of the parameters. keeping the flowchart in mind, let us understand how the EM algorithm works.
The EM algorithm is also known for clustering other than density estimation. So, let us try to understand the EM algorithm with the help of the Gaussian Mixture Model.
The GMM or Gaussian Mixture Model is a mixture model that uses a combination of probability distributions and also requires the estimation of mean and standard deviation parameters.
Even though there are a lot of techniques to estimate the parameters for a Gaussian Mixture Model, the most common technique is the Maximum Likelihood estimation.
Let us consider a case, where the data points are generated by two different processes and each process has a Gaussian probability distribution. But it is unclear, which distribution a given data point belongs to since the data is combined and distributions are similar. And the processes used for generating the data points represent the latent variables and influence the data. The EM algorithm seems like the best approach to estimate the parameters of the distributions.
In the EM algorithm, the E-STEP would estimate the expected value for each latent variable and the M-STEP would optimize the parameters of the distribution using the Maximum Likelihood.
Example
Let’s say we have a data set where points are generated from one of the two Gaussian processes. The points are one dimensional, the mean is 20 and 40 respectively with a standard deviation 5.
We will draw 4000 points from the first process and 8000 points from the second process and mix them together.
from numpy import hstack
from numpy.random import normal
import matplotlib.pyplot as plt

sample1 = normal(loc=20, scale=5 , size=4000)
sample2 = normal(loc=40, scale=5 , size=8000)
sample = hstack((sample1,sample2))
plt.hist(sample, bins=50, density=True)
plt.show()
Output: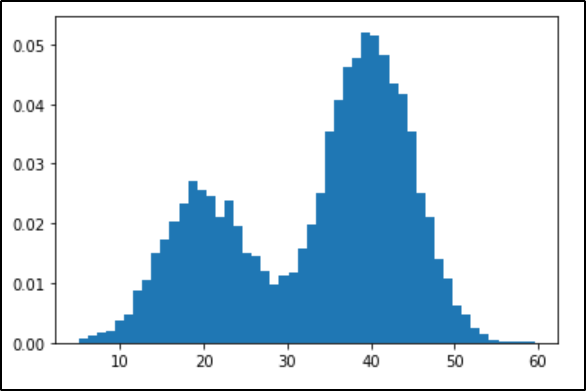
The plot clearly shows the expected distribution with the peak for the first process is 20 and the second process is 40. And for many points in the middle of the distribution, it is unclear as to which distribution they are picked up from.
We can model the problem of estimating the density of this data set using the Gaussian Mixture Model.
# example of fitting a gaussian mixture model with expectation maximization
from numpy import hstack
from numpy.random import normal
from sklearn.mixture import GaussianMixture
# generate a sample
sample1 = normal(loc=20, scale=5, size=4000)
sample2 = normal(loc=40, scale=5, size=8000)
sample = hstack((sample1, sample2))
# reshape into a table with one column
sample = sample.reshape((len(sample), 1))
# fit model
model = GaussianMixture(n_components=2, init_params='random')
model.fit(sample)
# predict latent values
yhat = model.predict(sample)
# check latent value for first few points
print(yhat[:80])
# check latent value for last few points
print(yhat[-80:])
Output: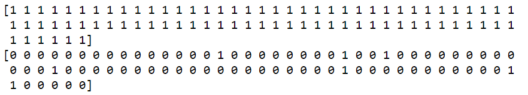
The above example fits the Gaussian mixture model on the data set using the EM algorithm. In this case, we can see that for the first few and the last few examples in the data set, the model mostly predicts the accurate value for the latent variable.
Now that we are clear with the implementation of the EM algorithm using the Gaussian mixture model, let us take a look at other EM algorithm applications as well.
With immense applications and easier implementations of Python with data science, there has been a significant increase in the number of jobs created for data science every year. Enroll for Edureka’s Python For Data Science and get hands-on experience with real-time industry projects along with 24×7 support, which will set you on the path of becoming a successful Data Scientist,


| Advantages | Disadvantages |
| It is guaranteed that the likelihood will increase with each iteration | EM algorithm has a very slow convergence |
| During implementation, the E-Step and M-step are very easy for many problems | It makes the convergence to the local optima only |
| The solution for M-Step often exists in closed form | EM requires both forward and backward probabilities |
This brings us to the end of this article where we have learned the Expectation-Maximization(EM) algorithm in Machine Learning. I hope you are clear with all that has been shared with you in this tutorial.
If you found this article on “EM Algorithm In Machine Learning” relevant, check out Edureka’s Machine Learning Online Course, a trusted online learning company with a network of more than 250,000 satisfied learners spread across the globe.
We are here to help you with every step on your journey and come up with a curriculum that is designed for students and professionals who want to be Machine Learning engineers. The course is designed to give you a head start into Python programming and train you for both core and advanced Python concepts along with various Machine Learning Algorithms like SVM, Decision Tree, etc.
Now that you know about machine learning which is a subset of Deep Learning, check out the Artificial Intelligence Course Training by Edureka, a trusted online learning company with a network of more than 250,000 satisfied learners spread across the globe. The Edureka Deep Learning with TensorFlow Certification Training course helps learners become experts in training and optimizing basic and convolutional neural networks using real-time projects and assignments along with concepts such as SoftMax function, Auto-encoder Neural Networks, Restricted Boltzmann Machine (RBM).
If you come across any questions, feel free to ask all your questions in the comments section of “EM Algorithm In Machine Learning” and our team will be glad to answer.


 Thank you for registering Join Edureka Meetup community for 100+ Free Webinars each month JOIN MEETUP GROUP