


With more and more IT infrastructures switching to the cloud, need for public cloud security tools and log analytics platforms is also increasing rapidly. Irrespective of the size of the organization a huge amount data is generated on daily basis. A considerable amount of this data is composed of the company’s web server logs. Logs are one of the most important and often-neglected sources of information. Each log file contains invaluable pieces of information which are mostly unstructured and makes no sense. Without a careful and detailed analysis of this log data, an organization can remain oblivious to both opportunities as well as threats surrounding it. Here is where the log analysis tools come in handy. ELK Stack or Elastic Stack is a complete log analysis solution which helps in deep searching, analyzing and visualizing the log generated from different machines. Through this blog on ELK Stack tutorial, I will give you the insights on it.
But before I start, let me list down the topics I will be discussing:
- What Is ELK Stack?
- ELK Stack Architecture
- ELK Stack Installation
- Elasticsearch Tutorial
- Logstash Tutorial
- Kibana Tutorial
You may go through this ELK Tutorial recording where our ELK stack training expert has explained the topics in a detailed manner with examples that will help you to understand this concept better.
ELK Tutorial | Edureka
This Edureka tutorial on What Is ELK Stack will help you in understanding the fundamentals of Elasticsearch, Logstash, and Kibana together and help you in building a strong foundation in ELK Stack.
So, lets quickly get started with this ELK Stack Tutorial blog, by first understanding what exactly is ELK Stack.
What Is ELK Stack? – ELK Stack Tutorial
Popularly known as ELK Stack has been recently re-branded as Elastic Stack. It is a powerful collection of three open source tools: Elasticsearch, Logstash, and Kibana.
These three different products are most commonly used together for log analysis in different IT environments. Using ELK Stack you can perform centralized logging which helps in identifying the problems with the web servers or applications. It lets you search through all the logs at a single place and identify the issues spanning through multiple servers by correlating their logs within a specific time frame.
Lets now discuss each of these tools in detail.
Logstash
Logstash is the data collection pipeline tool. It the first component of ELK Stack which collects data inputs and feeds it to the Elasticsearch. It collects various types of data from different sources, all at once and makes it available immediately for further use.
Elasticsearch

Elasticsearch is a NoSQL database which is based on Lucene search engine and is built with RESTful APIs. It is a highly flexible and distributed search and analytics engine. Also, it provides simple deployment, maximum reliability, and easy management through horizontal scalability. It provides advanced queries to perform detailed analysis and stores all the data centrally for quick search of the documents.

Kibana
Kibana is a data visualization tool. It is used for visualizing the Elasticsearch documents and helps the developers to have an immediate insight into it. Kibana dashboard provides various interactive diagrams, geospatial data, timelines, and graphs to visualize the complex queries done using Elasticsearch. Using Kibana you can create and save custom graphs according to your specific needs.
The next section of this ELK Stack Tutorial blog will talk about the ELK Stack architecture and how data flows within it.
ELK Stack Architecture – ELK Stack Tutorial
The following is the architecture of ELK Stack which shows the proper order of log flow within ELK. Here, the logs generated from various sources are collected and processed by Logstash, based on the provided filter criteria. Logstash then pipes those logs to Elasticsearch which then analyzes and searches the data. Finally, using Kibana, the logs are visualized and managed as per the requirements.

ELK Stack Installation – ELK Stack Tutorial
STEP I: Go to https://www.elastic.co/downloads.
 STEP II: Select and download Elasticsearch.
STEP III: Select and download Kibana.
STEP IV: Select and download Logstash.
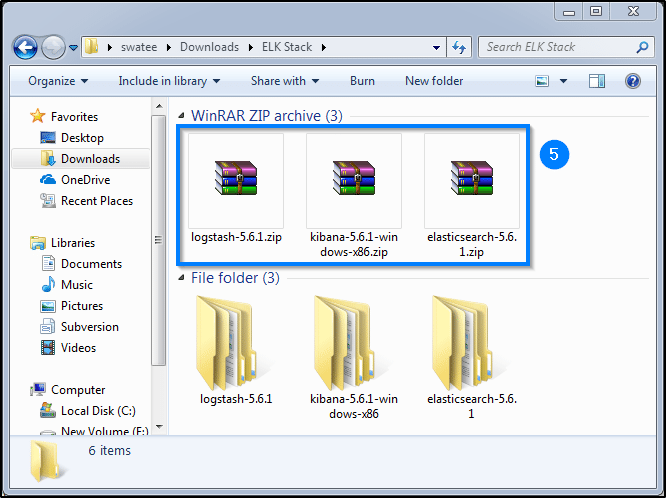
STEP V: Unzip all the three files to get their folder files.
Installing Elasticsearch
STEP VI: Now open the elasticsearch folder and go to its bin folder.
STEP VII: Double click on the elasticsearch.bat file to start the elasticsearch server.
STEP VIII: Wait for the elasticsearch server to start.
STEP IX: To check whether the server has started or not go to the browser and type localhost:9200.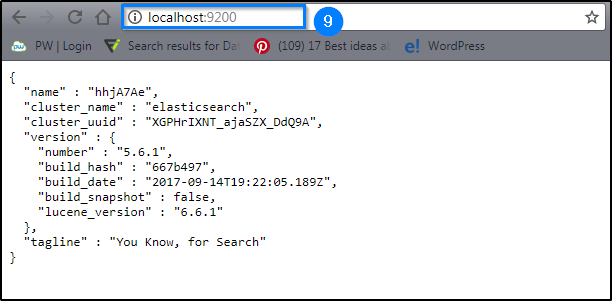
Installing Kibana
STEP X: Now open the kibana folder and go to its bin folder.
STEP XI: Double click on the kibana.bat file to start the elasticsearch server.

STEP XII: Wait for the kibana server to start.
STEP XIII: To check whether the server has started or not go to the browser and type localhost:5601.
Installing Logstash
STEP XIV: Now open the logstash folder.
STEP XV: To test your logstash installation, open the command prompt and go to your logstash folder. Now type :
binlogstash -e 'input { stdin { } } output { stdout {} }'STEP XVI: Wait until “Pipeline main started” appears on the command prompt.
STEP XVII: Now enter a message at the command prompt and hit enter.
STEP XVIII: Logstash appends timestamp and IP address information to the message and displays it on the command prompt.
Since we are done with the installation, lets now take a deeper dive into these tools. Let’s start with Elasticsearch.
Elasticsearch – ELK Stack Tutorial
As mentioned before, Elasticsearch is a highly scalable search engine which runs on top of Java-based Lucene engine. It is basically a NoSQL database; which means it stores data in an unstructured format and SQL queries can’t be performed for any kind of transaction. In other words, it stores the data inside the documents instead of tables and schemas. To have a better picture, check the following table which shows what is what, in Elasticsearch when compared to a database.
 Let’s now get familiar with the basic concepts of Elasticsearch.
When you work with Elasticsearch there are three major steps which you need to follow:
- Indexing
- Mapping
- Searching
Let’s talk about them in detail, one by one.
Indexing
Indexing is the process of adding the data Elasticsearch. It is called ‘indexing’ because when the data is entered into Elasticsearch, it gets placed into Apache Lucene indexes. Elasticsearch then uses these Lucene indexes to store and retrieve the data. Indexing is similar to the create and update process of CRUD operations.
An index scheme consists of name/type/id, where name and type are mandatory fields. In case you do not provide any ID, Elasticsearch will provide an id on its own. This entire query is then is appended to an HTTP PUT request and the final URL looks like:PUT name/type/id Along with the HTTP payload a JSON document, which contains the fields and values, is sent as well.
Following is an example of creating a document of a US-based customer with his details in the fields.
PUT /customer/US/1
{
 "ID" : 101,
 "FName" : "James",
 "LName" : "Butt",
 "Email" : "jbutt@gmail.com",
 "City" : "New Orleans",
 "Type" : "VIP"
}
It will give you the following output:
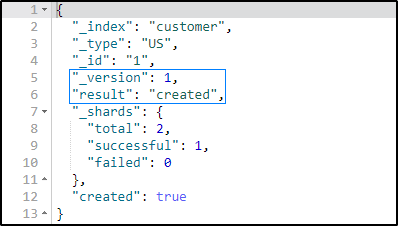
Here it shows the document has been created and added to the index.
Now if you try to change the field details without changing the id, Elasticsearch will overwrite your existing document with the current details.
PUT /customer/US/1
{
 "ID" : 101,
 "FName" : "James",
 "LName" : "Butt",
 "Email" : "jbutt@yahoo.com",
 "City" : "Los Angeles",
 "Type" : "VVIP"
}
Here it shows the document has been updated with new details the index.
Mapping
Mapping is the process of setting the schema of the index. By mapping, you tell Elasticsearch about the data types of the attributes present in your schema. If the mapping is not done for a specific at the pre-index time, dynamically a generic type will be added to that field by Elasticsearch. But these generic types are very basic and most of the times do not satisfy the query expectations.
Lets now try to map our query.
PUT /customer/
{
 "mappings":{
 "US":{
 "properties":{
 "ID":{
 "type": "long"
 },
 "FName" : {
 "type" : "text"
 },
 "LName" : {
 "type" : "text"
 },
 "Email" : {
 "type" : "text"
 },
 "City" : {
 "type" : "text"
 },
 "Type" : {
 "type" : "text"
 }
 }

 }
 }
}
When you execute your query you will get this type of output.
Searching
A general search query with specific index and type will look like: POST index/type/_search
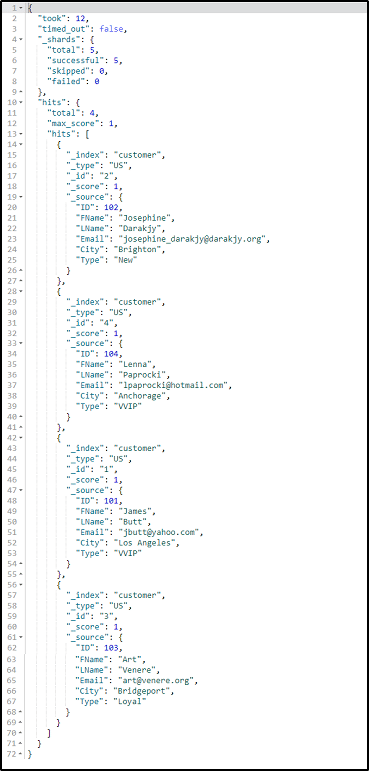
Lets now try to search for the details of all the customers present in our ‘customer’ index.
POST /customer/US/_search
When you execute this query, following result will be generated:
 But when you want to search for specific results, Elasticsearch provides three ways in which you can perform it:
Using queries
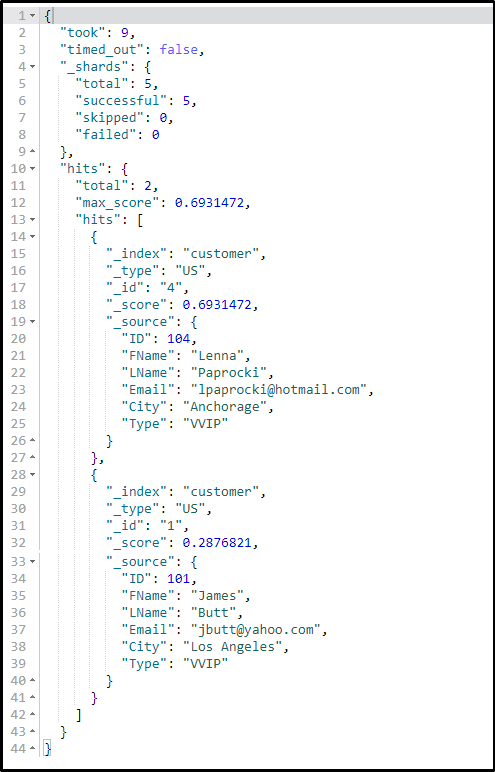
Using queries you can search for some specific document or entries. For example, let us perform a search query for the customers who fall under ‘VVIP’ category.
POST /customer/US/_search
{
 "query": {
 "match": {
 "Type": "VVIP"
 }
 }
}
Using filters
Using filters, you can further narrow down your searches. Following is an example which searches for a VVIP customer with ID as ‘101’:
POST /customer/_search
{
 "query": {
 "match": {
 "Type": "VVIP"
 }
 },
 "post_filter": {
 "match" : {
 "ID" : 101
 }
 }
}
If you execute this query you’ll get the following kind of result:
Using aggregations
Aggregation is a framework which helps in aggregating data through a search query. Small aggregations can be joined together in order to build up complex summaries of the data provided. Let’s perform a simple aggregation to check how many types of customers do we have in our index:
POST /customer/_search
{
 "size": 0,
 "aggs" : {
 "Cust_Types" : {
 "terms" : { "field" : "Type.keyword" }
 }
 }
}
Lets now see how to retrieve a data set from an index.
Getting Data
To check the list of documents you have within an index, you just need to send an HTTP GET request in the following format: GET index/type/id
Let us try to retrieve the details of the customer with ‘id’ equals 2:
GET /customer/US/2
It will give you the following type of result, on executing successfully.

With Elasticsearch, you can not only browse through the data, but you can delete or remove the documents as well.
Deleting Data
Using the delete convention you can easily remove the unwanted data from your index and free up the memory space. To delete any document you need to send an HTTP DELETE request in the following format: DELETE index/type/id.
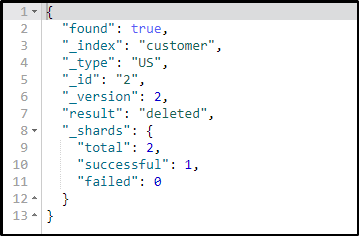
Lets now try to delete the details of a customer with id 2.
DELETE /customer/US/2
On executing this query, you will get the following type of result.
 So, this concludes the basics of CRUD operations using Elasticsearch. Knowing these basic operations will help you perform a different kind of searches and you are good enough to proceed with the ELK Tutorial. But if you want to learn Elasticsearch in depth, you can refer to my blog on Elasticsearch Tutorial.
Lets now begin with next tool of ELK Stack, which is Logstash.
Logstash – ELK Stack Tutorial
As I have already discussed, Logstash is a pipeline tool generally used for collecting and forwarding the logs or events. It is an open source data collection engine which can dynamically integrate data from various sources and normalize it into the specified destinations.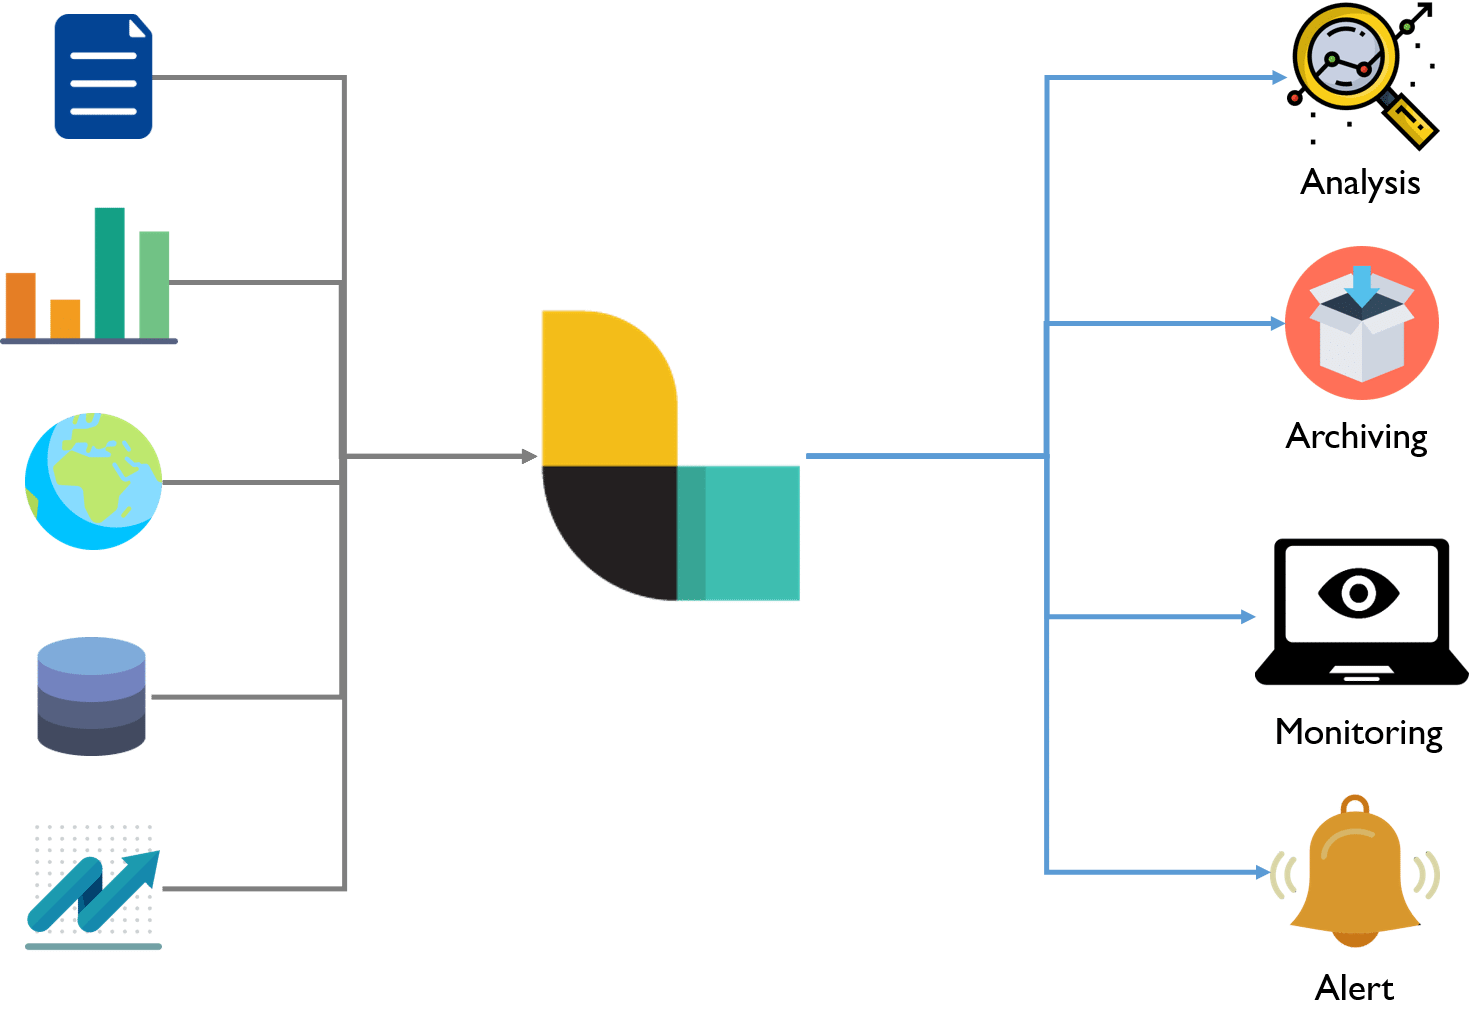
Using a number of input, filter, and output plugins, Logstash enables the easy transformation of various events. At the very least, Logstash needs an input and an output plugin specified in its configurational file to perform the transformations. Following is the structure of a Logstash config file:
input {
 ...
}

filter {
 ...
}

output {
 ...
}
As you can see, the entire configuration file is divided into three sections and each of these sections holds the configuration options for one or more plugins. The three sections are:
- input
- filter
- output
You can apply more than one filter in your config file as well. In such cases, the order of their application will be the same as the order of specification in the config file.
Lets now try to configure our US customer data set file which is in CSV file format.
input{
          file{
          path => "E:/ELK/data/US_Customer_List.csv"
          start_position => "beginning"
          sincedb_path => "/dev/null"
        }
}
filter{
     csv{
     separator => ","
     columns =>["Cust_ID","Cust_Fname","Cust_Lname","Cust_Email","Cust_City","Cust_Type"]
     }
     mutate{convert => ["Cust_ID","integer"]}
}
output{
     elasticsearch{
     hosts => "localhost"
     index => "customers"
     document_type => "US_Based_Cust"
     }
     stdout{}
}
To insert this CSV file data into the elasticsearch you have to notify the Logstash server.
For that follow the below steps:
- Open command prompt
- Go the bin directory of Logstash
- Type: logstash –f X:/foldername/config_filename.config and hit enter. Once your logstash server is up and running it will start pipelining your data from the file, into the Elasticsearch.


If you want to check whether your data was inserted successfully or not, go to the sense plugin and type:
GET /customers/
It will give you the number of documents that have been created.
Now if you want to visualize this data, you have to make use of the last tool of ELK Stack i.e Kibana. So, in the next section of this ELK Stack Tutorial, I will be discussing Kibana and the ways to use, it to visualize your data.
Kibana – ELK Stack Tutorial
As mentioned earlier, Kibana is an open source visualization and analytics tool. It helps in visualizing the data that is piped down by the Logstash and is stored into the Elasticsearch. You can use Kibana to search, view, and interact with this stored data and then visualize it in various charts, tables, and maps.The browser-based interface of Kibana simplifies the huge volumes of data and reflects the real-time changes in the Elasticsearch queries. Moreover, you can easily create, customize, save and share your dashboards as well.
Once you have learned, how to work with Elasticsearch and Logstash, leaning Kibana becomes no big deal. In this section of the ELK tutorial blog, I will introduce you to the different functions which you need in order to perform the analysis on your data.
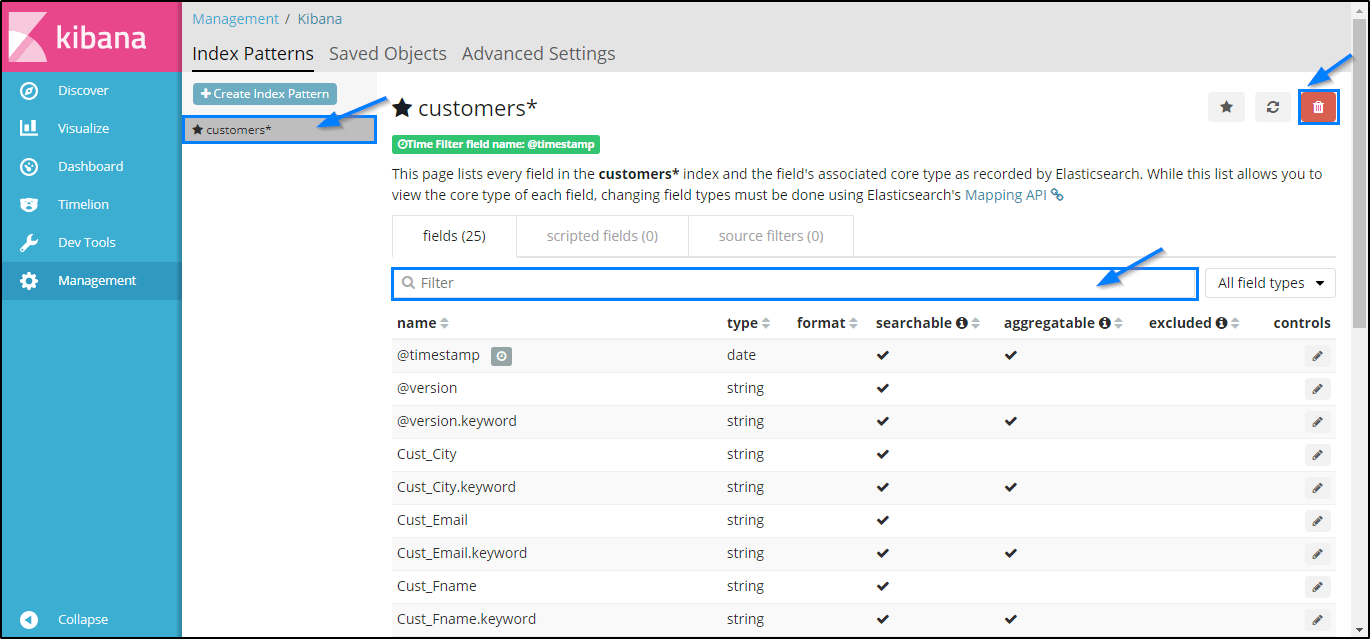
Management Page
This is where you have to perform your runtime configurations of Kibana. In this page, you need to specify few things for your search. See the following example, in which I have configured the entries for my ‘customer’ index.
Here as you can see, in the ‘Index pattern’ field you need to specify the index on which you want to use. In the ‘Time Filter field name’ make sure you select it as @timestamp. Then you can go ahead and click on Create in order to create the index. If your index is created successfully you will see the following type of page: Here you can choose for different filters from the drop-down list, according to your requirements. Moreover, to free up your memory you can delete a particular index as well.Discover Page
Through the Discover page, you have access to every document present each index which matches the selected index pattern. You can easily interact and explore, every bit of data that is present on your Kibana server. Moreover, you can view the data present in the documents and perform search queries on it.
Below you can see, I am performing a search for the ‘VIP’ customers hailing from ‘Los Angeles’.
So, as you can see, we have only one VIP customer from Los Angeles.Visualize Page
Visualize page enables you to visualize the data present in your Elasticsearch indices, in the form of charts, bars, pies etc. Here you can even build the dashboards which will display the related visualizations based on Elasticsearch queries. Generally, a series of Elasticsearch aggregation queries are used to extract and process the data. When you go to the Visualize page and search for your saved visualizations or you can create a new one.
You can aggregate your data in any form. For the user’s ease, different types of visualization options are provided.
Let me show you how can you visualize the US customer data based on the user types. To perform the visualization, follow the below steps:- Select the visualization type. [Here I am using a Pie]
- In the aggregation field, select ‘term’ from the drop-down list.
- In the ‘field’, select the field type based on which you want to perform the search.
- You can specify the order and the size of your visualizations as well.
- Now click on the execute button to generate the Pie chart.
Dashboard Page
The Dashboard page displays a collection of saved visualizations. Here you can either add new visualizations or you can use any saved visualization as well.
Timelion Page
Timelion is a time series data visualizer which brings together totally independent data sources into a single interface. It is driven by a one-line expression language that one uses to retrieve time series data, perform calculations to simplify complex questions and visualize the results.
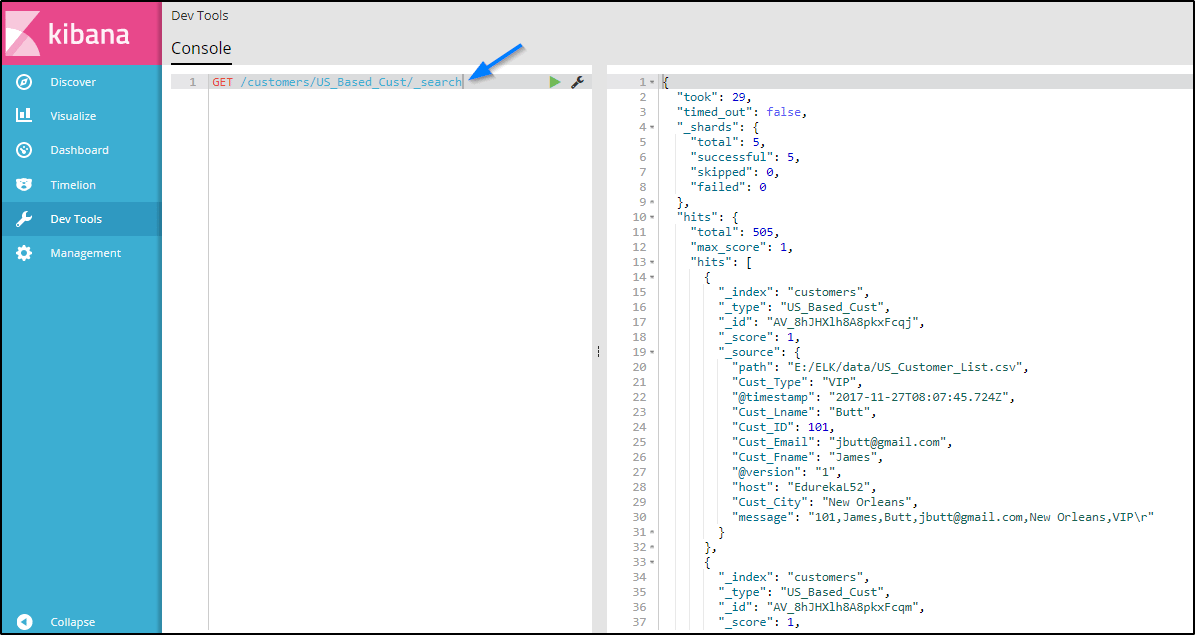
Dev Tools Page
The Dev Tools page of Kibana contains the development tools like ‘Beta Sense’ plugin, which is used to interact with the data present in Elasticsearch. It is often referred as Kibana’s console. Following is an example in which I have used Kibana’s sense plugin to search for my ‘customers’ index with type ‘US_based_cust’:


This concludes this blog on ELK Stack Tutorial. Now you are ready to perform various search and analysis on any data you want, using Logstash, Elasticsearch, and Kibana.
If you found this ELK Stack Tutorial blog, relevant, check out the ELK Stack Training by Edureka, a trusted online learning company with a network of more than 250,000 satisfied learners spread across the globe. The Edureka ELK Stack Training and Certification course help learners to run and operate their own search cluster using Elasticsearch, Logstash, and Kibana.


So on the linux side it has exporters that ships logs to the ELK Server and uses an index in Kibana such as filebeat-*, How would I do that in the windows world?