
Data Science with Python Certification Course
- 132k Enrolled Learners
- Weekend
- Live Class
(49300)


 Copy Link!
In Supervised Machine Learning, we usually have 2 different types of use cases, Regression, and Classification problem. Confusion Matrix helps in calculating the accuracy of the classification model which indirectly helps us to describe the performance of the classification model. It is the most important step when it comes to evaluating a model. I’ll be covering the following topics in this article:
1. What is a Confusion Matrix?
2. Accuracy and Components of Confusion Matrix
3. Precision, Recall and F-Measure
4. Creating a Confusion Matrix by using Python and Sklearn

| Predicted Class 1 Value EG: 1 | Predicted Class 2 Value EG:0 | |
| Actual Class 1 Value EG: 1 | TP (True Positive) | FN (False Negative) |
| Actual Class 2 Value EG: 0 | FP (False Positive) | TN (True Negative) |
From the above figure:
We have,
The left side index of the confusion matrix basically indicates the Actual Values and the top column indicates the Predicted Values.
There are various components that exist when we create a confusion matrix. The components are mentioned below
Positive(P): The predicted result is Positive (Example: Image is a cat)
Negative(N): the predicted result is Negative (Example: Images is not a cat)
True Positive(TP): Here TP basically indicates the predicted and the actual values is 1(True)
True Negative(TN): Here TN indicates the predicted and the actual value is 0(False)
False Negative(FN): Here FN indicates the predicted value is 0(Negative) and Actual value is 1. Here both values do not match. Hence it is False Negative.
False Positive(FP): Here FP indicates the predicted value is 1(Positive) and the actual value is 0. Here again both values mismatches. Hence it is False Positive.
Transform yourself into a highly skilled professional and land a high-paying job with the Artificial Intelligence Course.
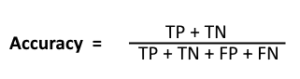
From the above formula, the sum of TP (True Positive) and the TN (True Negative) are the correct predicted results. Hence in order to calculate the accuracy in percentage, we divide with all the other components. However, there are some problems in the accuracy and we cannot completely depend on it.
Let us consider that our dataset is completely imbalanced. In this Scenario, 98% accuracy can be good or bad based on the problem statement. Hence we have some more key terms which will help us to be sure about the accuracy we calculate. The terms are as given below:
True Positive rate which is also known as Sensitivity measures the percentage of the True Positive with respect to the Total Actual Positives which is indicated by (TP+ FN)
| Predicted Class 1 Value EG: 1 | Predicted Class 2 Value EG:0 | Total | |
| Actual Class 1 Value EG: 1 | TP (True Positive) | FN (False Negative) | Total Actual Positives |
| Actual Class 2 Value EG: 0 | FP (False Positive) | TN (True Negative) | Total Actual Negatives |
True Negative Rate or Specificity measures the proportion of actual negatives with respect to the Total Negatives
| Predicted Class 1 Value EG: 1 | Predicted Class 2 Value EG:0 | Total | |
| Actual Class 1 Value EG: 1 | TP (True Positive) | FN (False Negative) | Total Actual Positives |
| Actual Class 2 Value EG: 0 | FP (False Positive) | TN (True Negative) | Total Actual Negatives |
TNR= True Negative/ (True Negative+ False Positive)
False Positive Rate is the percentage of Predicted False Positive (FP) to the Total No of Predicted Positive Results (TP + FP).
Predicted Class 1 Value EG: 1 | Predicted Class 2 Value EG:0 | |
Actual Class 1 Value EG: 1 | TP (True Positive) | FN (False Negative) |
Actual Class 2 Value EG: 0 | FP (False Positive) | TN (True Negative) |
Sum of Total Predicted Positive | Sum of Total Predicted Negative |
False Negative Rate is the percentage of Predicted False Negative (FP) to the Total No of Predicted Negative Results (TN + FN).
Predicted Class 1 Value EG: 1 | Predicted Class 2 Value EG:0 | |
Actual Class 1 Value EG: 1 | TP (True Positive) | FN (False Negative) |
Actual Class 2 Value EG: 0 | FP (False Positive) | |
Sum of Total Predicted Positive | Sum of Total Predicted Negative |
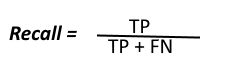
A recall is similar to the True Positive Rate and it is the ratio of the Total number of correctly predicted positive values(TP) to all the Positive Values.
The Precision basically indicates all the points the model predicted to be positive and what percentage of them are actually Positive.
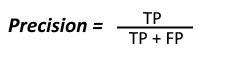
Precision and Recall are metrics results which focus on the positive class as shown from the above formulas.
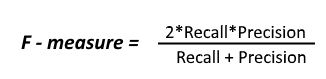
So F-Measure is a technique which combines both the Precision and Recall technique and it uses Harmonic Mean in the place of the usual Arithmetic Mean, due to which the extreme values are punished. The F-measure is also called as F1- score and is given by the below formula.
Let us consider an example and see how we can compute the Accuracy, Precision, Recall and the F1-score.
| N = 165 | Predicted YES | Predicted NO |
| Actual YES | TP = 150 | FN = 10 |
| Actual NO | FP = 20 | TN = 100 |
Now we will see an example of how we can create a confusion matrix using python along with the sklearn library.
1. Initially, we will create some list of the actual data and the predicted to check the accuracy as shown below
# Python script for confusion matrix creation.

actual_data = [1, 1, 0, 1, 0, 0, 1, 0, 0, 0,1,0,1]
predicted_data = [0, 1, 1, 1, 0, 0, 1, 0, 1, 0,1,0,1]
2. We need to import the confusion matrix from the sklearn library as shown below:
from sklearn.metrics import confusion_matrix
3. Next, we will create the confusion matrix as shown below:
final_results = confusion_matrix(actual_data, predicted_data)
4. Now we can go ahead and calculate the accuracy by importing the library as shown below:
from sklearn.metrics import accuracy_score
accuracy=accuracy_score(actual_data,predicted_data)
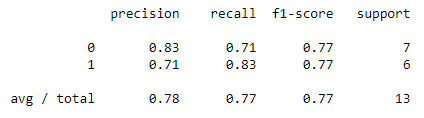
5. Finally, we compute the F1-score or F- Measure as shown below:
from sklearn.metrics import classification_report
report=classification_report(actual_data,predicted_data)
Below is the Complete Code:
actual_data = [1, 1, 0, 1, 0, 0, 1, 0, 0, 0,1,0,1]
predicted_data = [0, 1, 1, 1, 0, 0, 1, 0, 1, 0,1,0,1]

from sklearn.metrics import confusion_matrix

final_results = confusion_matrix(actual_data, predicted_data)

print(final_results)

from sklearn.metrics import accuracy_score
accuracy=accuracy_score(actual_data,predicted_data)

from sklearn.metrics import classification_report
report=classification_report(actual_data,predicted_data)

print(accuracy)

print(report)
![]()
![]()
So, with this, we come to an end of this article. I hope all your Confusion about the Confusion Matrix is now resolved.


 Thank you for registering Join Edureka Meetup community for 100+ Free Webinars each month JOIN MEETUP GROUP