
Tableau Certification Training Course
- 61k Enrolled Learners
- Weekend/Weekday
- Live Class
(23050)


 Copy Link!
In today’s world of data, organizations are highly dependent on usable, timely insights to make good decisions. One type of insight that is important and is of interest is anomalies or outliers in data. Anomalies can be useful for a variety of use cases. For example, detecting fraud in financial transactions, problems in the manufacturing process, and abnormal user behavior time series web analytics are all potential use cases for anomaly detection in modern Business Intelligence. The artificial intelligence enhancements in Microsoft Power BI allow users to find those anomalies natively, without the need for complex data science models or third-party software.
Suppose that you are a business analyst for a national supermarket chain. One of your stores in the northern region suddenly drops in daily sales. It’s not seasonal sales variation, and it’s not related to any current marketing activity. Then, you apply some anomaly detection in Power BI’s line chart for daily sales. Power BI will highlight this anomaly and provide Possible Explanations such as “low inventory” or “store renovations.” Now, your team can promptly act on this, look into the inventory data, and reach out to the regional managers, saving time and money!
We will now examine the definitions of anomalies and anomaly detection in Power BI.
An anomaly is a data point or pattern that deviates markedly from expected behavior or trends. Examples of anomalies in business are extremely high website traffic, a sharp decline in sales, a spike in errors in your system, or anything that is out of the ordinary concerning the usual pattern.
Anomaly Detection in Power BI is a built-in AI feature designed to assist users in automatically finding anomalies in time series data. It was made available to preview users in November 2020. It provides report creators with tools to apply the anomaly detection feature directly over a line chart and enhance the analysis with smart narratives and AI insights as provided by Power BI.
According to Microsoft documentation (source), Anomaly detection works best with time series data, referring to sales over hours, temperature over days, and system performance over months. Power BI uses a statistical model on the underlying data to locate deviations from similar historical periods and displays them with specific requested annotations and insights.
Then, we’ll look at some important things to think about when using Power BI’s anomaly detection.
We will now examine how to use Power BI’s anomaly detection feature.
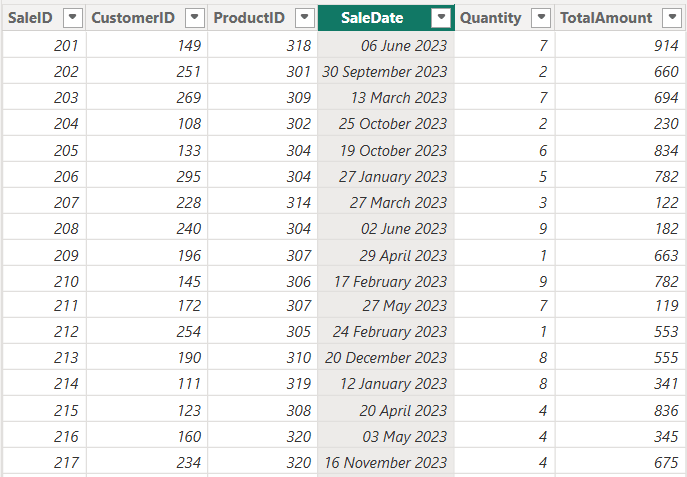
As you can see, my dataset includes SalesID, CustomerID, ProductID, SalesDate, Quantity, and TotalAmount.
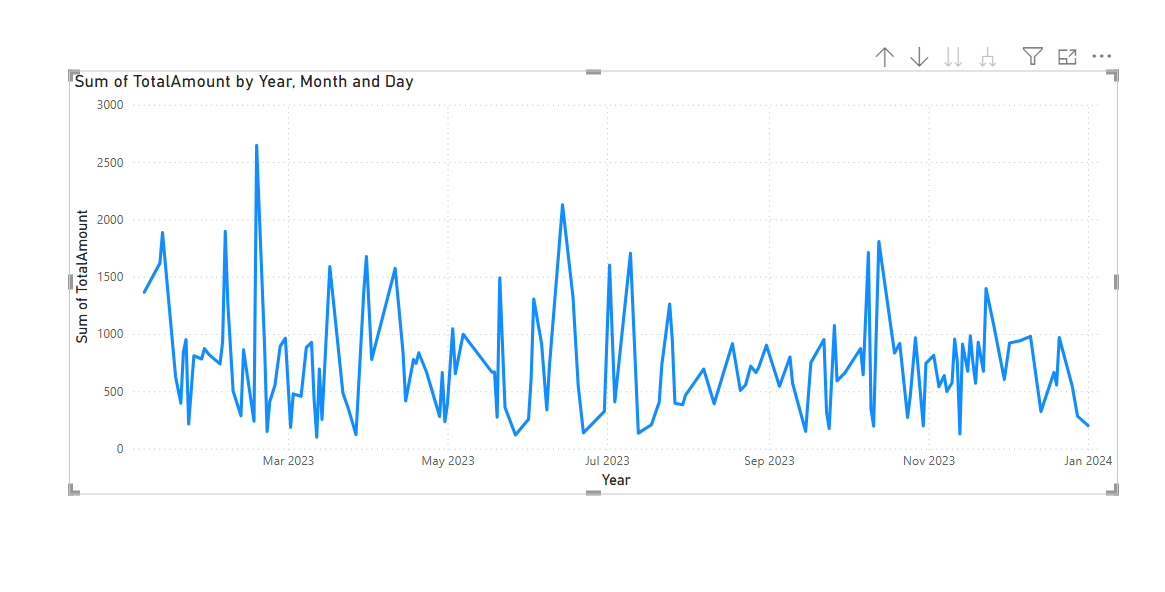
Plotting a line graph is the first step in the anomaly detection process. We therefore create a line graph with the Total amount on the y-axis and the SalesDate on the x-axis. The outcome is shown below.
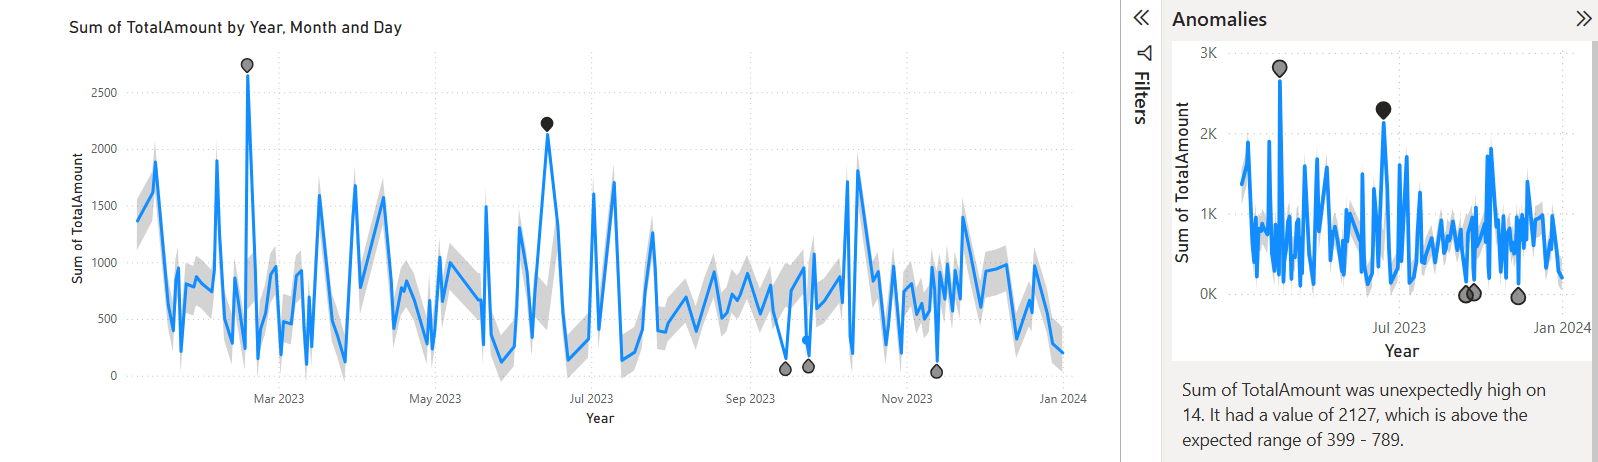
 Now observe how your line chart has changed. A formatable marker is used to identify the anomalies. Five anomalies have been found here. Since it is visually evident that there is a sudden increase at both points and a sudden decrease, which deviates from the usual trend, the anomalies make sense.


It is very easy to customize the anomaly markers. Additionally, you can alter the marker’s size, color, and style.
The anomalies in the data can also be automatically explained. Power BI performs an analysis to determine potential causes for the anomalies found. It provides a natural language explanation and the contributing factors to the anomaly, arranged according to how well they explain it. Here’s how to accomplish it.
To see the explanation, click on the anomaly on the line chart. Here’s an illustration. To view the chart based on the potential explanations, click “Anomaly.”
 I hope you have a better understanding of Power BI anomalies now.
1. Retail: Monitoring Sales and Inventory Retailers utilize anomaly detection to identify unusual dips or spikes in sales across stores. By doing this, retailers are able to locate stockouts, overstocking, or inefficiencies in their promotions.
2. Finance: Fraud detection. Financial institutions check for transaction volume or payments to flag suspicious behavior, such as unexpected increases or decreases in transfer volumes.
3. Manufacturing: Equipment Monitoring Organizations operating a fleet of machines or other industrial equipment often utilize sensors that measure and monitor data from those machines. Data can be visualized and analyzed for anomalies in temperature, vibration, or output rates to ensure the machines are running properly, resulting in unplanned downtime that is costly for manufacturers.
4. IT Operations: Server Health and Performance Anomaly detection is particularly suited for monitoring memory spikes, unusual network lag, or other downtime incidents, enabling IT teams to be proactive in responding to an incident.
5. Web Analytics: User Behavior Monitoring Digital marketing teams monitor metrics and analytics around web traffic, using anomaly detection to identify bots, unusual bounce rates, or sudden drops in traffic to enhance user experience and optimize ad spend.
Now we will discuss techniques behind the scenes, limitations, and best practices.
Power BI applies statistical algorithms based on models of decomposition and time series forecasting to establish a baseline of normal behavior. Power BI will identify the baseline and monitor deviations, using seasons and trends to help reduce false positives.
More advanced users can further improve anomaly detection by integrating with Azure Cognitive Services or through Python scripts and R visualizations, particularly when we are looking at multivariate or high-frequency data.
While anomaly detection is one of the best features of Power BI, it is best applied to regularly timed, high-quality time series data. To ensure you get the best possible results, you should:
Also, remember that anomalies are not necessarily bad – some may represent unexpected successes or new patterns that are worth exploring further.
Anomaly detection in Power BI will provide the next level of analytics to everyday business users, enabling them to find insights with minimal effort. This feature will make it possible for data irregularities to be highlighted, causes determined, and actions occurring through the dashboards in a timely fashion, without the need for a team of analysts to find the next big opportunity.
As Power BI evolves, delivering advanced analysis capabilities like anomaly detection to every user will be fundamental to creating real-time intelligence that drives responsive, informed, and data-driven businesses against a competitive landscape.
Now, we will look at the Frequently Asked Questions (FAQ) – Anomalies in Power BI.
In Power BI, anomalies can be easily detected using the Anomaly Detection function that appears on inline charts:
Furthermore, you may enable “Explain the anomaly,” which would allow you to view AI insights on potential causes according to other data dimensions.
Finding anomalies in data usually entails:
Visualization tools such as Tableau or Power BI can be used to examine data for odd trends visually.
Anomaly detection comes in the following primary forms:
Statistical methods, namely time series decomposition models that take trend, seasonality, and noise into account, are used in the background for anomaly detection in Power BI. Users can also use the following for more sophisticated detection:
The blog highlights how Anomaly Detection in Power BI simplifies the process of identifying unexpected data patterns using built-in AI. It replaces manual checks with automated insights, improving accuracy, readability, and the overall maintainability of reports.
If you’re looking to advance your Power BI skills and career opportunities, consider enrolling in the Power BI Certification Training Course by Edureka. This program, designed in collaboration with PwC, provides dual certification in Business Intelligence and prepares you for the PL-300 certification exam. With live instructor-led sessions, hands-on real-world projects, and simulated business scenarios, this training ensures you gain practical expertise in Power BI
Do you have any questions or need further information? Feel free to leave a comment below, and we’ll respond as soon as possible!


 Thank you for registering Join Edureka Meetup community for 100+ Free Webinars each month JOIN MEETUP GROUP