


Data Science and Machine Learning Internship ...
- 22k Enrolled Learners
- Weekend/Weekday
- Live Class
(8500)
R is the most popular data analytics tool as it is open-source, flexible, offers multiple packages and has a huge community. It’s designed for software programmers, statisticians and data miners, alike and hence, given rise to the popularity of Data Science with R certification. In this R Tutorial blog, I will give you a complete insight about R with examples.
Below are the topics in this R Tutorial blog which I will be discussing in the following sequence:
Before I answer the question, let me brief you with some of the problems and their solutions in R in multiple domains.

Banking :
Large amount of customer data is generated everyday in Banks. While dealing with millions of customers on regular basis, it becomes hard to track their mortgages.
Solution:
R builds a custom model that maintains the loans provided to every individual customer which helps us to decide the amount to be paid by the customer over time.

Insurance:
Insurance extensively depends on forecasting. It is difficult to decide which policy to accept or reject.
Solution:
By using the continuous credit report as input, we can create a model in R that will not only assess risk appetite but also make a predictive forecast as well.

Healthcare:
Every year millions of people are admitted in hospital and billions are spent annually just in the admission process.
Solution:
Given the patient history and medical history, a predictive model can be built to identify who is at risk for hospitalization and to what extent the medical equipment should be scaled.
Now we know how data analytics helps organizations to harness their data and use it to identify new opportunities. If we talk about the need for analytics in an organization, you must come across these 4 aspects:
Next, let us move forward in R tutorial blog, where we will first understand what exactly is business analytics.
Business analytics is a process of examining large sets of data and achieving hidden patterns, correlations and other insights. It basically helps you understand all the data that you have gathered, be it organisational data, market or product research data or any other kind of data. It becomes easy for you to make better decisions, better products, better marketing strategies etc. Refer to the below image for better understanding:

If you look at the above figure, your data in the first image is scattered. Now, if you want something specific such as a particular record in a database, it becomes cumbersome. To simplify this, you need analysis. With analysis, it becomes easy to strike a correlation between the data. Once you have established what to do, it becomes quite easy for you to make decisions such as, which path you want to follow or in terms of business analytics, which path will lead to the betterment of your organization.
But you can’t expect people in the chain above to always understand the raw data that you are providing them after analytics. So to overcome this gap, we have a concept of data visualization.
Data visualization: Data visualization is a visual access to huge amounts of data that you have generated after analytics. The human mind processes visual images and visual graphics are more better than compare to raw data. Its always easy for us to understand a pie chart or a bar graph compare to raw numbers. Now you may be wondering how can you achieve this data visualization from the data you have already analyzed?
There are various tools available in the market for Data Visualization:

You all must be wondering there are already so many tools that help you achieve data visualization and certain amount of analytics, why go with R ?
So my next topic in R tutorial blog deals with ‘why R’ and ‘who uses R’.
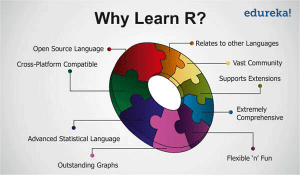
Why R?
 R is a programming and statistical language.
 R is used for data Analysis and Visualization.
 R is simple and easy to learn, read and write.
 R is an example of a FLOSS (Free Libre and Open Source Software) where one can freely distribute copies of this software, read it’s source code, modify it, etc.
Who uses R?
Below are some of the domains where R is used:
Now, let us move forward in R tutorial blog and install R.
Let me guide you through the process of installing R on your system. Just follow the below steps:
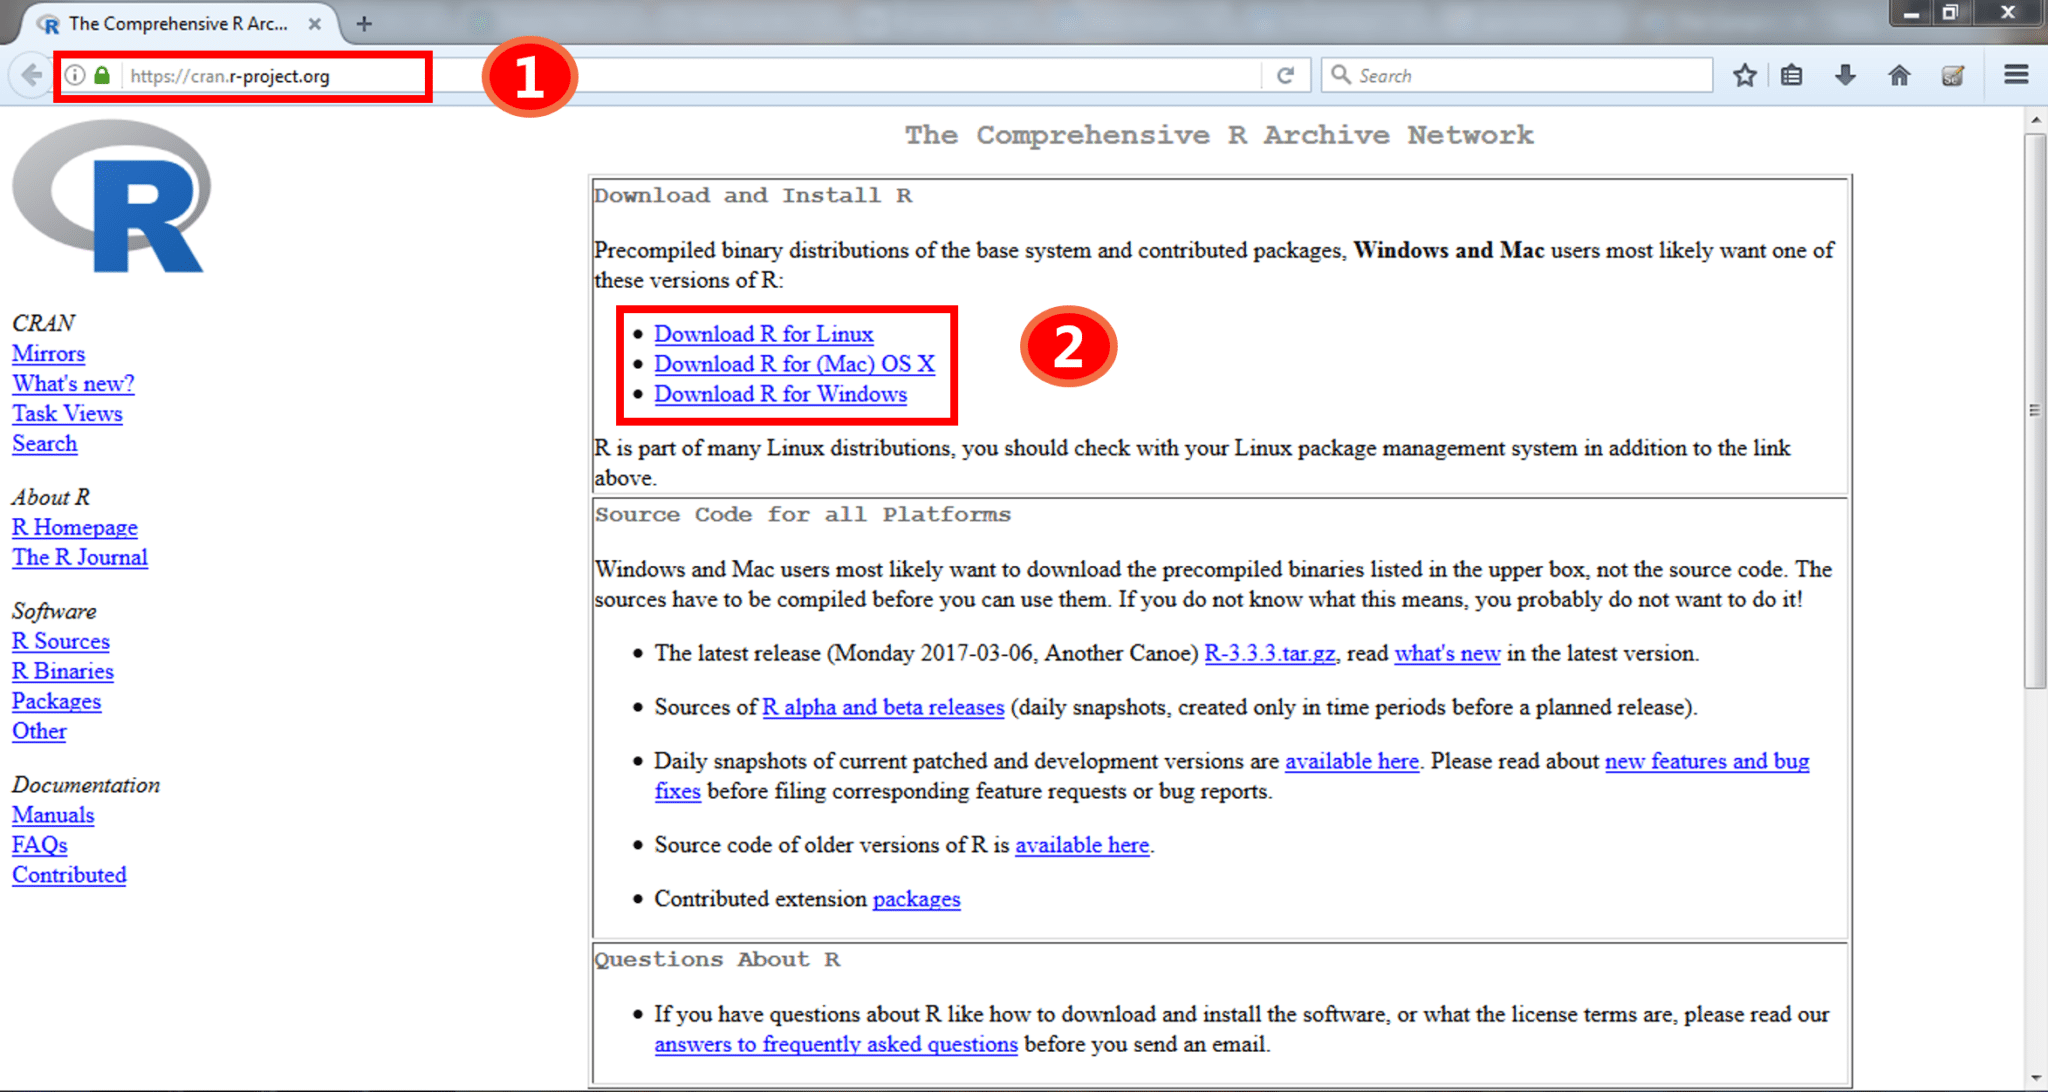
Step 1 : Go to the link- https://cran.r-project.org/
Step 2 : Download and install R 3.3.3 on your system.
Refer to the below screenshot to get a better understanding.
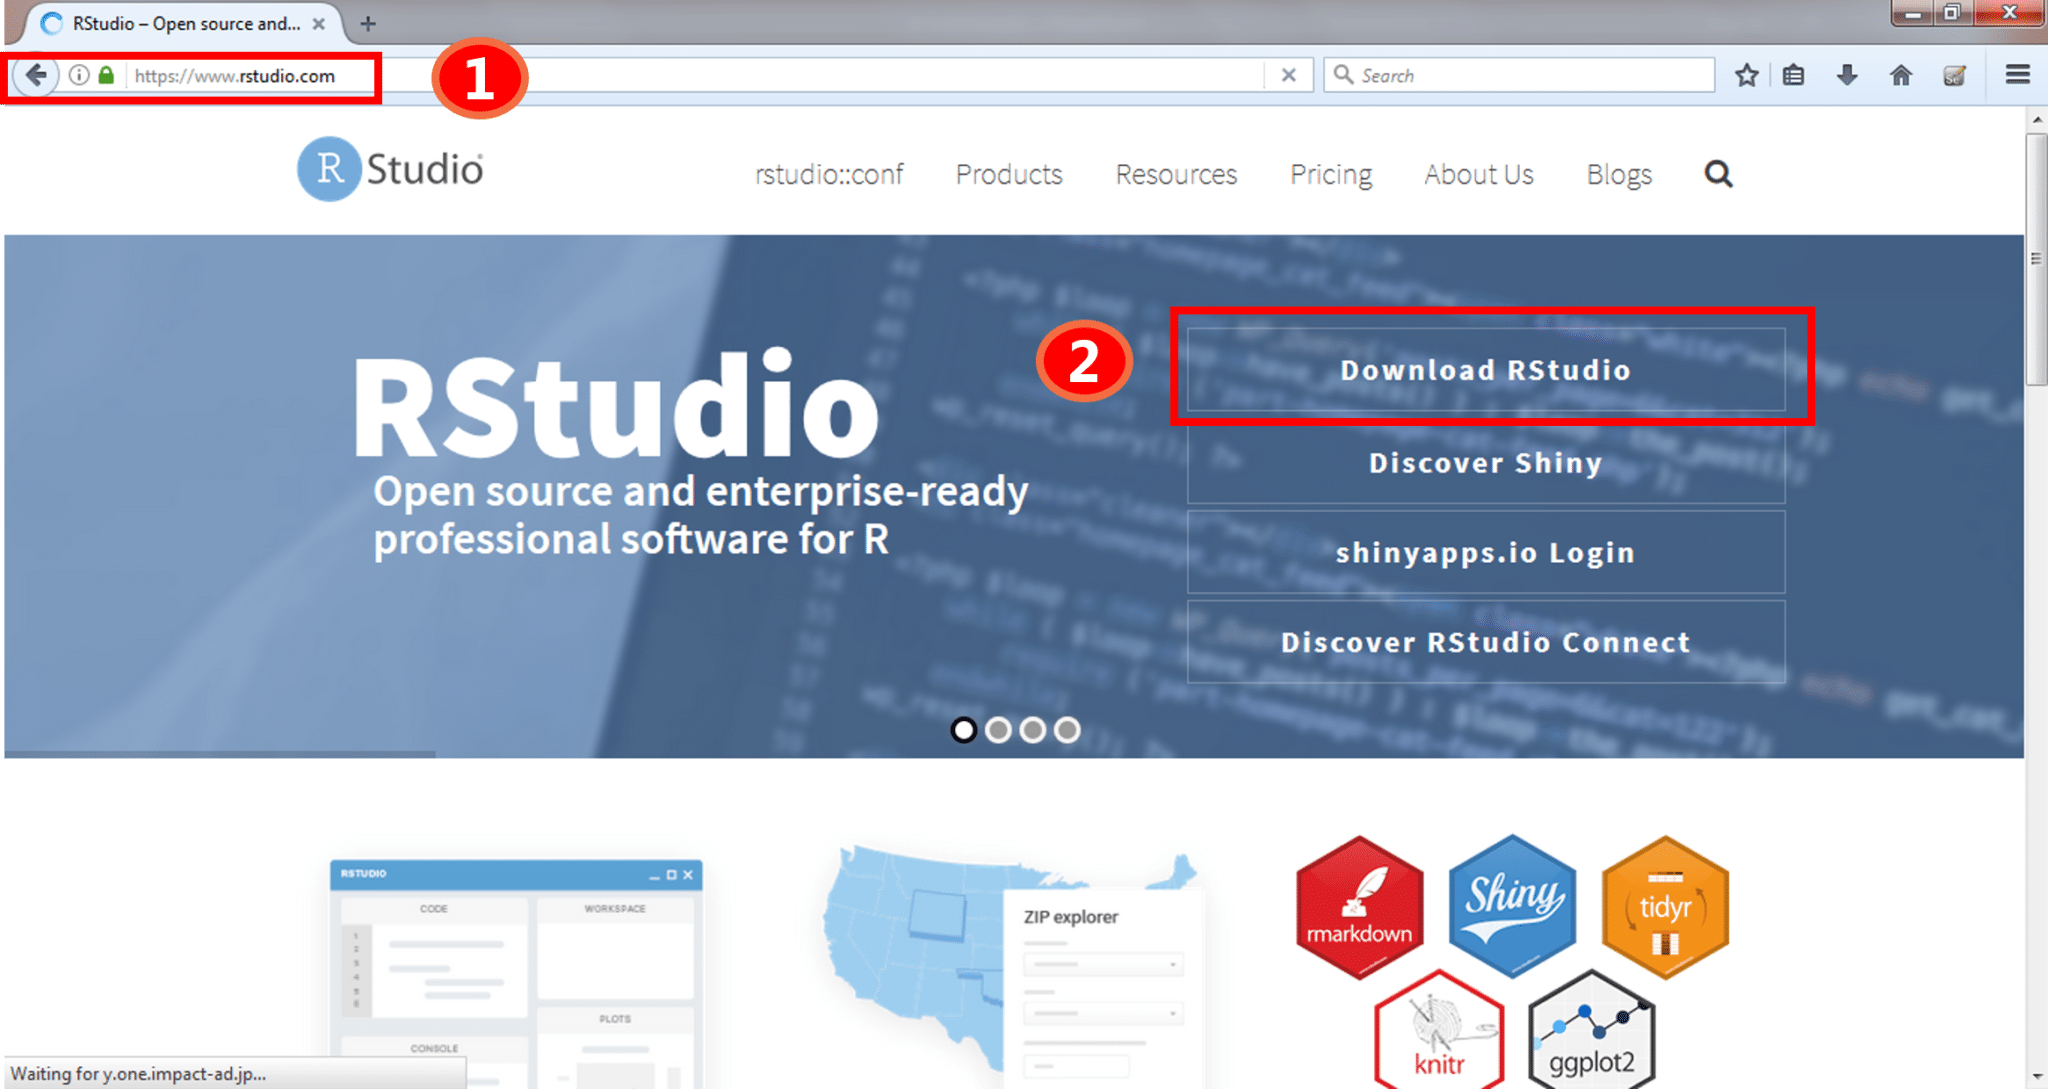
By following the above steps, you are done with the R installation part. Now, you can directly start coding in R by downloading RStudio IDE. To download this, follow the below steps:
Step 1: Go to the link- https://www.rstudio.com/
Step 2: Download and install Rstudio on your system.
After installing everything, you are all set to code!
Next, let us move ahead in R Tutorial blog and understand what are data operators in R.
There are mainly 5 different types of operators, which are listed below:
>x=5
>x
Output : [1] 5
Assignment Operator <-
Syntax:variable name <- value
>x<- 15
>x
Output : [1] 15>x <<- 2 >x
Output : [1] 2>25 -> x >x
Output : [1] 253. Relational Operator: It defines a relation between two entities. For example: <,>,<=,!= etc.
>x<-3
>x!=2
Output: [1] TRUE4. Logical Operators: These operators compare the two entities and are typically used with boolean (logical) values such as &, | and !.
>x<-2
>2&3
Output: [1] TRUE5. Special Operators: These operators are used for specific purpose, not for logical computation. For example:
>x<-2:8
>x
Output: [1] 2 3 4 5 6 7 8>x<- 2:8
>y<-5
>y %in% x
Output : [1] TRUEData types are used to store information. In R, we do not need to declare a variable as some data type. The variables are assigned with R-Objects and the data type of the R-object becomes the data type of the variable. There are mainly six data types present in R:

Let us go into more detail on each one of them:
Vector: A Vector is a sequence of data elements of the same basic type. Example:
vtr = (1, 3, 5 ,7 9)
or
vtr <- (1, 3, 5 ,7 9)
There are 5 Atomic vectors, also termed as five classes of vectors.
 List: Lists are the R objects which contain elements of different types like − numbers, strings, vectors and another list inside it.
>n = c(2, 3, 5)

>s = c("aa", "bb", "cc", "dd", "ee")

>x = list(n, s, TRUE)

>x
Output –
[[1]]
[1] 2 3 5
[[2]]
[1] "aa"  "bb"  "cc" "dd" "ee"
[[3]]
[1] TRUE
Arrays: Arrays are the R data objects which can store data in more than two dimensions. It takes vectors as input and uses the values in the dim parameter to create an array.
vector1 <- c(5,9,3)

vector2 <- c(10,11,12,13,14,15)

result <- array(c(vector1,vector2),dim = c(3,3,2))
Output –
, , 1
     [,1] [,2] [,3]

[1,]    5   10   13

[2,]    9   11   14

[3,]    3   12   15

, , 2
     [,1] [,2] [,3]

[1,]    5   10   13

[2,]    9   11   14

[3,]    3   12   15
Matrices: Matrices are the R objects in which the elements are arranged in a two-dimensional rectangular layout. A Matrix is created using the matrix() function. Example: matrix(data, nrow, ncol, byrow, dimnames) where,
data is the input vector which becomes the data elements of the matrix.
nrow is the number of rows to be created.
ncol is the number of columns to be created.
byrow is a logical clue. If TRUE then the input vector elements are arranged by row.
dimname is the names assigned to the rows and columns.
>Mat <- matrix(c(1:16), nrow = 4, ncol = 4 )

>Mat
         [,1]  [,2]  [,3]  [,4]
[1,]    1      5       9     13
[2,]    2      6       10   14
[3,]    3      7       11   15
[4,] 4 8 12 16Factors: Factors are the data objects which are used to categorize the data and store it as levels. They can store both strings and integers. They are useful in data analysis for statistical modeling.
>data <- c("East","West","East","North","North","East","West","West“,"East“)

>factor_data <- factor(data)

>factor_data
Output :
[1] East  West  East  North North East  West  West  East
Levels: East North West
Data Frames: A data frame is a table or a two-dimensional array-like structure in which each column contains values of one variable and each row contains one set of values from each column.
>std_id = c (1:5)

>std_name = c("Rick","Dan","Michelle","Ryan","Gary")

>marks = c(623.3,515.2,611.0,729.0,843.25)

>std.data <- data.frame(std_id, std_name, marks)

>std.data
Output :
    std_id     std_name     marks

1      1          Rick            623.30

2      2          Dan            515.20

3      3         Michelle       611.00

4      4          Ryan          729.00

5      5          Gary           843.25
By this, we come to the end of different data types in R. Next, let us move forward in R Tutorial blog and understand another key concept – flow control statements.
Flow control statements play a very important role as they allow you to control the flow of execution of a script inside a function. The most commonly used flow control statements are represented in the below image:
 Now, let us discuss each one of them with examples.
 In this flowchart, the code will respond in the following way:
Below is an example of if control statement in R. Try running this example in R Studio.
x=2
repeat {
x= x^2
print(x)
if(x>100) {
break
}
Output :
[1] 4
[1] 16
[1] 256
 In this flowchart, the code will respond in the following way:
Below is an example of if else control statement in R. Try running this example in R Studio.
x<-5
if(x>5) {
print("x is greater than 5")
}
elseif(x==5) {
print("x is equal to 5")
}
else {
print("x is not greater than 5")
}
Output:
[1] "x is equal to 5"
 In this Switch case flowchart, the code will respond in the following steps:
Below is an example of switch statement in R. Try running this example in R Studio.
vtr <- c(150,200,250,300,350,400)
option <-"mean"
switch(option,
"mean" = print(mean(vtr)),
"mode" = print(mode((vtr))),
"median" = print(median((vtr)))
)
Output :
[1] 275
Loops help you to repeat certain set of actions so that you don’t have to perform them repeatedly. Imagine you need to perform an operation 10 times, if you start writing the code for each time, the length of the program increases and it would be difficult for you to understand it later. But at the same time by using a loop, if I write the same statement inside a loop, it saves time and makes easier for code readability. It also gets more optimized with respect to code efficiency.

In the above image, ‘repeat’ and ‘while‘ statements help you to execute a certain set of rules until the condition is true but’ for’ is a loop statement that is used when you know how many times you want to repeat a block of statement. Now, if you know that you want to repeat it for 10 times, then you will go with ‘for’ statement but if you are not sure about how many times you want the code to be repeated, you will go with ‘repeat’ or ‘while’ loop.
Let’s discuss each one of them with examples.

In the above flowchart, the code will respond in the following steps:

In the above flowchart, the code will respond in the following steps:
Below is an example of while statement in R. Try running this example in R Studio.
x=2
while(x<1000)
{
x=x^2
print(x)
}
Output:
4
16
256
65536
So you must be wondering how these two statements differ? Let me clear your doubt!
Here the major difference between the repeat and while statement is that it changes with respect to your condition. While loop basically defines when you are going to enter the loop to execute the statements and repeat loop defines when you leave from the loop after the execution of the statements. So these two statements are known as entry control loop and exit control loop. That’s how while and repeat statements are different.
 In the above flowchart, the code will respond in the following steps:
Below is an example of for statement in R. Try running this example in R Studio.
vtr <- c(7,19,25,65, 45)
 for( i in vtr) {
 print(i)
 }
Output :
7
19
25
65
45
Next, let us move to our last set of statements in R Tutorial blog, i.e jump statements.
Break Statement: Break statements help to terminate the program and resumes the control to the next statement following the loop. These statements are also used in switch case. Refer to the below flowchart to get a better understanding:
 In the above flowchart, the code will respond in the following steps:
Below is an example of jump statement in R. Try running this example in R Studio.
x <- 1:5
for (val in x) {
if (val == 3){
break
}
print(val)
}
Output:
[1] 1
[1] 2
Next Statement: A next statement is used when you want to skip the current iteration of the loop without terminating it. Next statement is quite similar to ‘continue’ in other programming language. Refer to the below flowchart to get a better understanding:

In the above flowchart, the code will respond in the following steps:
First of all, it will enter the loop where it checks the condition.
If the loop condition is false, it directly exits the loop.
If the loop condition is true, it will execute block 1 statements.
After that it will check for ‘next’ statement. If it is present, then the statements after that will not be executed in the same iteration of the loop.
If ‘next’ statement is not present, then all the statements after that will be executed.
Below is an example of next statement in R. Try running this example in R Studio.
for(i in 1:15)
 {
 if((i%%2)==0) {
 next
 }
 print(i)
 }
Output :
1
3
5
7
9
11
13
15
This is the end of the R tutorial blog. I hope you guys are clear about each and every concept that I have discussed above. Stay tuned, my next blog will be on R training where I will be explaining some more concepts of R in detail with examples.
Now that you have understood basics of R, check out the R training by Edureka, a trusted online learning company with a network of more than 250,000 satisfied learners spread across the globe. Edureka’s Data Analytics with R training will help you gain expertise in R Programming, Data Manipulation, Exploratory Data Analysis, Data Visualization, Data Mining, Regression, Sentiment Analysis and using R Studio for real life case studies on Retail, Social Media.
Got a question for us? Please mention it in the comments section of this “R Tutorial” blog and we will get back to you as soon as possible.


 REGISTER FOR FREE WEBINAR
  Thank you for registering Join Edureka Meetup community for 100+ Free Webinars each month JOIN MEETUP GROUP


Nice Blog.Can you please tell me what is scope of R-programming.
i like the way the express your knowledge about r programming through this article. please upload more program related to this topic.
Hi Neel,
As you said i have downloaded Rstudio for windows but i am unable to see a workspace and environment space in Rstudio.it shows only Rconsole.Can you help me.