In a typical modeling process, it is important to start drawing a hypothesis. An RFP (Request for Proposal) is received and then a Hypothesis is drawn.
Determine Right Data Source – Here, the customer may give data source, if not, we have to look for a data source. Given a scenario, where we try to evaluate who would win the election, a public analysis of data is done with sources that include social media, news channels or public opinion. We also need to understand the amount of data needed to analyze the problem. In this case, we typically look for large samples, since it is an Election case. On the other hand, if the analysis is done on Healthcare, it is difficult to go for a large population because there is a possibility of not getting enough people to validate the hypothesis. Also, the quality of data is very important.
Extract Data – For example, if we take a population sample, we can look at attributes, such as high income, low income, age, working population (offsite/onsite), residents, NRI, coverage of hospitals, etc., to initiate the study. Here, we may not need so many attributes for the hypothesis. We understand that attributes, such as high and low income may not be the contributing factors in determining who will win the election. But age can make a difference as it will give a direct count of how many people are going to vote. Many a times we may exclude less used attributes or include attributes that are useful. It could go wrong in both cases. That is the reason why analytics is a challenge.
Massage the Data to fit the Tool – This is because not all tools can accept all data. Certain tools accept only CSV data or excel data. Lack of tools is a challenge.
Run the Analysis– This operation can be performed using many techniques of analytics.
Draw Conclusions – The analysis gives out numbers to be precise. But it is up to a user to derive conclusions out of these numbers. For example, if it says 10% or 20%, we must understand what it means? Does it derive correlation between Attribute A and Attribute B?
Implement Results – It is important to implement conclusions to see results in business. For example, it may be concluded that ‘People buy Umbrella in rainy season’ which may result in more business. Here, we need to implement conclusion where we make umbrella, available in shops, but then it can have management problems. The moment statistics gives result, the implementation may go wrong.
Monitor Progress– The last step here, monitoring plays an important role. Monitoring may go wrong because not many organizations want to monitor progress, and it is considered as a negligible step. But monitoring is important as we can understand if our research and conclusions are heading in the right direction.
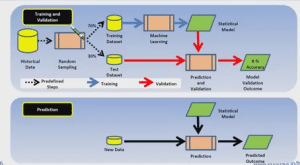
Also check out this article ‘Correlation does not mean Causation’ which gives an insight into how analysts can go wrong. An important point to note in this chart is that Running Analysis is the only step where the machine is accountable and beyond that its up to a human being who will ultimately determine how the research is done.
If you wish to learn Power BI and build a career in data visualization or BI, then check out our Power BI Certification Training which comes with instructor-led live training and real-life project experience. This training will help you understand Power BI in-depth and help you achieve mastery over the subject. Also, Take your career to the next level by mastering the skills required for business analysis. Enroll in our Business Analyst Course today and take the first step towards a fulfilling and lucrative career.
Got a question for us? Mention them in the comments section and we will get back to you.


 REGISTER FOR FREE WEBINAR
  Thank you for registering Join Edureka Meetup community for 100+ Free Webinars each month JOIN MEETUP GROUP


