


Microsoft Power BI Certification Training Cou ...
- 77k Enrolled Learners
- Weekend/Weekday
- Live Class
(30700)
Today, we see data visualization being embraced like never before. Organizations that know and understand it, love its very existence. Since Big Data is a popular lingo in the tech world today across industries ranging from finance to communications, the need to drive better business decisions is the need of the hour. As a result, organizations are looking for better data visualization tools, to turn their essential load of data into something that is more comprehensible.
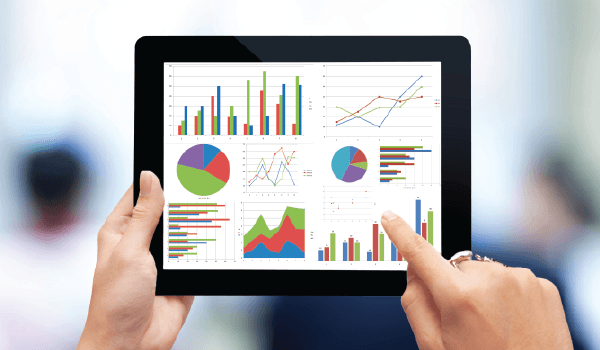
Developers of business intelligence and data analytics applications are increasingly using advanced data visualization technology to handle huge volumes of data that helps information workers better interpret analytical results.
Today businesses are being bombarded with data, and hence, there is a need to convert it into smart business decisions. While most traditional business intelligence tools are geared toward either market analysts or a few decision makers, data visualization is seen as a way to make business analytics available to a wider audience.
Data Visualization’s interactive tools like Dygraphs, ZingChart, FusionCharts and many others afford a better understanding of relationships and trends in data sets. These tools were initially developed as ad hoc solutions by organizations to address a specific question within a specific set of data and have gained tremendous popularity. Consequently, companies are racing to develop better, faster data visualization tools and in turn, have expectations that data visualization is the magic wand for tackling Big Data.
While success stories have leveraged the need for data visualization, it is imperative that data analysts and programmers ensure they are asking the right questions and utilizing the right methods in order to generate valuable analyses of the data. After all, data visualization cannot be everyone’s cup of tea. Organizations need to ask themselves whether they really require these tools.
Data visualization can be really expensive, especially if it involves massive data and complex algorithms. If you’re selling solutions to simple problems, data visualization is probably not worth the money. For example, firms like Coca-Cola and Nestle don’t need interactive graphics to explain their products. If your organization sells ideas rather than products, then maybe you could let data visualization in.
On the other hand, many non-governmental organizations and publishers have embraced Data Visualization, along with other professional firms. There are financial services who have adopted these tools to help you keep a close eye on where your money is going. Also, explaining a complex idea to an online audience requires a level of personalization, detail, and openness that only an interactive visualization can provide.
These organizations let their audience play with their data to make their findings more useful and convincing. That, of course, is the bottom line since such experiences have to give your users value, hopefully resulting in return value to your organization in the form of sales and referrals.
According to IDC, by end-2015, the global annual rate of data production is expected to be double the rate of growth than in 2012. Data visualization tools and techniques offer executives, and others new approaches to dramatically improve their ability to grasp information hiding in their data.
Here are some of the benefits that data visualization offers to decision makers and their organizations:
1. Constructing ways in absorbing information
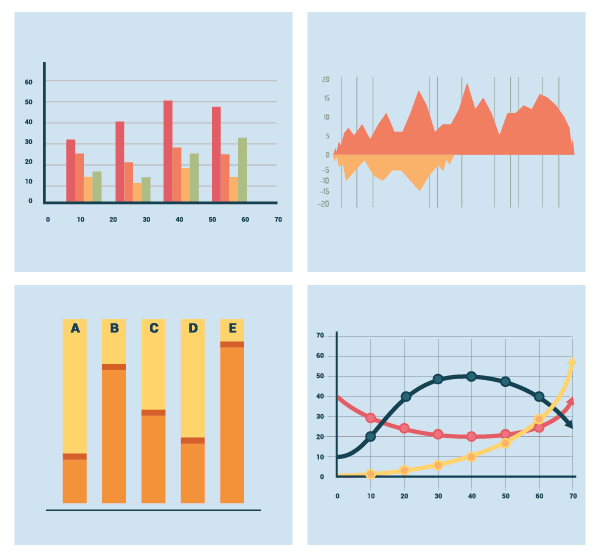
Data visualization enables users to receive vast amounts of information regarding operational and business conditions. It allows decision makers to see connections between multi-dimensional data sets and provides new ways to interpret data through the use of heat maps, fever charts, and other rich graphical representations. Organizations that use visual data discovery are more likely to find the information they need, and then end up being more productive than other companies.
A survey reveals that managers who use visual data discovery tools are 28% more likely to find timely information, than those who rely solely on managed reporting and dashboards. Moreover, 48% of business intelligence users at companies that use visual data discovery are able to find the information they need without any help from IT staff most of the time.
2. Visualize relationships and patterns in Businesses
Suppose a network provider company is viewing their monthly customer data, and they are presented with a bar chart that shows the company’s net promoter score (NPS) has dipped by five points over the past month in that particular region; the data suggests that there’s a problem with customer satisfaction in this territory, but doesn’t provide any insights about why the NPS has tumbled.
These are one of the key benefits of data visualization that enables users to effectively see connections as they are occurring between operating conditions and business performance. In today’s highly competitive business environment, finding these correlations among the data has been very important.
By providing a multi-faceted view of business and operating dynamics, data visualization permits the senior leadership team to see that first-contact resolution rates in the customer call center of that particular region, which has recently dipped, dramatically impacting customer satisfaction.
The ability to make these types of correlations allows the executives to identify the root cause of the problem and act quickly to resolve it.
3. Acting on emerging trends faster
The volume of data that companies are able to gather about customers and market conditions can provide business leaders with insights into new revenue and business opportunities. Using data visualization will enable decision makers to grasp shifts in customer behavior and market conditions, across multiple data sets much more efficiently.
Business leaders can use data visualization to see that not only customers are spending more in its stores as macro-economic conditions improve, but are also increasingly interested in purchasing ready-made food items. Taking a look into a customer’s sentiments and other data reveals an emerging opportunity for the company to act on new business opportunities ahead of its rivals.
4. Geo-Spatial Visualization
Another scope of data visualization that has emerged in the business world lately is the geo-spatial visualization. The popularity of geo-spatial visualization has occurred due to a lot of websites providing web-services, attracting visitors’ interest. This type of business needs to take advantage of location specific information, which is already present in the system in the form of customer’s zip code, providing better daily analysis experience. This type of visualization adds a new dimension to the figures and helps in better understanding of the matter.
Got a question for us? Please mention it in the comments section and we will get back to you.
Related Posts:
| Course Name | Date | Details |
|---|---|---|
| Tableau Certification Training Course | Class Starts on 20th April,2024 20th April SAT&SUN (Weekend Batch) | View Details |
| Tableau Certification Training Course | Class Starts on 4th May,2024 4th May SAT&SUN (Weekend Batch) | View Details |


 REGISTER FOR FREE WEBINAR
  Thank you for registering Join Edureka Meetup community for 100+ Free Webinars each month JOIN MEETUP GROUP


No visualization or example of visualization in data visualization post. Strange!
Thanks for the feedback Abhi! We will update the post soon.